

What is a TV dashboard?
A TV dashboard displays key business metrics in real-time on a television or wallboard, giving every team member a shared view of performance at a glance. Learn how to set one up, design it well, and drive team engagement.
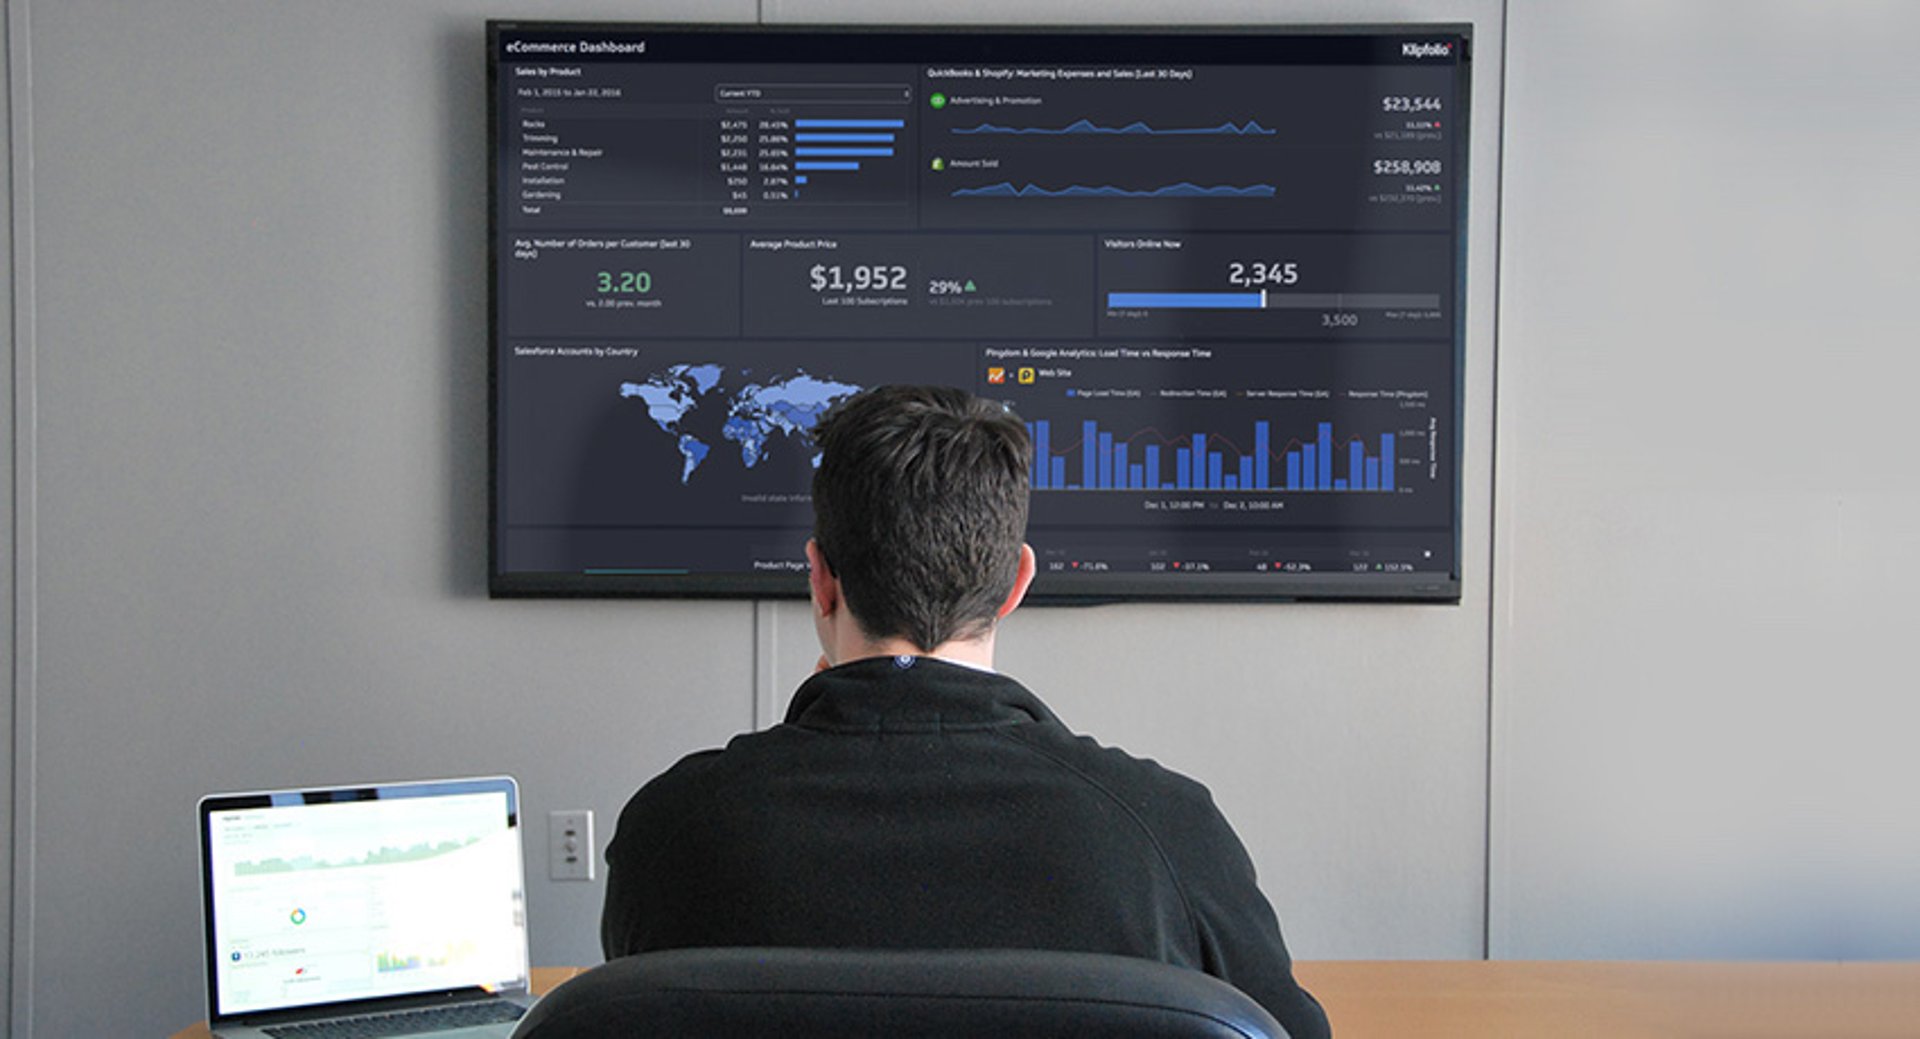
A TV dashboard displays key business metrics in real-time on a television or wallboard, giving every team member a shared view of performance at a glance.
TV dashboards have evolved from office whiteboards to wall-mounted screens, but the purpose has stayed the same: make metrics and KPIs visible and actionable. When the right data is always in view, business goals become a shared responsibility, not just a manager's concern. Your team stops waiting to be told how things are going and starts knowing.
The benefits of a TV dashboard
You might wonder why a TV dashboard is necessary when the same data lives on a computer. The answer is visibility. A screen on the wall removes the barrier of opening an app or pulling up a report. Data becomes ambient: always present, always current. You don't have to go looking for the number; the number is already there.
Here are the core benefits teams experience:
Improved transparency across the business, so everyone sees the same numbers
Departmental alignment through shared metrics that reinforce common goals
Real-time confidence in decisions, backed by live data that hasn't been copy-pasted or manually refreshed
Less time in meetings spent sharing results that a dashboard already communicates
A smaller team operating like a bigger one, because no one is waiting on a report that should already exist
Klipfolio customers set up TV dashboards in boardrooms, departmental work areas, and home offices for KPI reporting. When teams can see their performance at a glance, motivation to hit targets follows naturally.
How to set up a TV dashboard
Six steps take you from blank screen to a live display your team actually relies on.
Determine your use case
Select your dashboard software
Pick your KPIs
Select your hardware
Start casting and drive engagement
Determine your use case
Before you build anything, outline what you want the dashboard to accomplish. A clear use case shapes every decision that follows.
Common use cases include:
Engaging foot traffic at a school, business, or event
Displaying real-time business metrics for the whole team
Helping departments align around shared goals
From there, get specific. If you want your sales team to monitor individual and team performance, sketch out what the best sales dashboard for that team looks like before you start building.
Select your dashboard software
The right dashboard software makes the difference between a TV display people ignore and one they rely on. Evaluate your options against these questions:
How does the dashboard look on a TV screen?
How easy is it to activate TV mode?
Is there a mobile and desktop version?
Does the software support custom CSS?
How does the vendor handle multi-tenancy and licensing?
Klips is built with TV display in mind. You can start a free trial here and follow along step by step, or visit the pricing page for full details.
Pick your KPIs
Choose KPIs based on what you want to communicate and what drives performance for each team. If you find yourself with more metrics than fit on one screen, consider running multiple TV dashboards, one per department or role.
TV dashboard tip: Organize dashboards by role or department so the data is easy to understand at a glance.
Design your dashboard
A strong TV dashboard starts with software built for the display experience, and it also requires applying dashboard design best practices.
If you are starting a free trial and are not sure where to begin, use the Dashboard Gallery and Klip Gallery to build out a dashboard with your data quickly. For example, you can set up a rich Salesforce dashboard in just a few minutes.
A well-designed dashboard consolidates data that would otherwise live across multiple spreadsheets and browser tabs into a single screen. When you pull data dynamically, it updates in real-time with no manual refreshes required. That means the number on the wall is the number you can trust, not a snapshot someone exported yesterday.
Place your TV dashboard close to the team it is meant to guide. If you have multiple dashboards, position each one near the relevant team. In a smaller office, set up a common-area display and rotate dashboards automatically. TV dashboards should drive performance, not distract from it.
Trim content on the dashboard
Details that are easy to read on a laptop screen can become hard to parse on a wall-mounted TV. Build a TV-specific version of your dashboard. Remove clutter and keep only the essential metrics that are readable at a distance.
Adjust your browser zoom level
For viewers within 20 feet of the screen, zoom in to 150% to 175% for ideal readability.
Use suffixes for large numbers
Format numbers for quick scanning. Use $34.2M instead of $34,231,342.23.
Create custom dashboards for you and your team.
Get started with KlipsMake heights consistent
Uneven metric alignment creates visual noise. Consistent height and spacing make dashboards easier to read at a glance.
Select your hardware
Rise Vision
Rise Vision is a web-based digital signage platform. It lets you display dashboards, calendars, spreadsheets, webpages, RSS feeds, and YouTube videos. You need a media player, a display monitor, and a free account. Rise Vision supports Windows, Linux, Chrome, and Raspberry Pi media players.
Ideal for: Organizations that want a simple way to display dashboards and manage screens from a web app.
Airtame
Airtame is a compact wireless HDMI device that plugs into any TV or projector. It lets you stream content from any computer, tablet, or smartphone.
Ideal for: Schools and businesses that need an easy way to stream content and display dashboards on a shared screen.
Chromecast and Apple TV work in a similar capacity and are worth considering for smaller setups.
Start casting and drive engagement
Deploying a dashboard without preparing your team is a missed opportunity. Include them early: bring them into the initial planning conversations and walk them through how you want them to engage with the display.
If the TV dashboard is meant to drive performance, challenge each team to take ownership of what they see. That means going beyond the display itself and connecting it to your key performance indicators: understanding what you are measuring, why it matters, and what improvement looks like. A number on a wall only changes behaviour when the team knows what to do with it.
Dashboard examples you can use today
Marketing TV dashboard
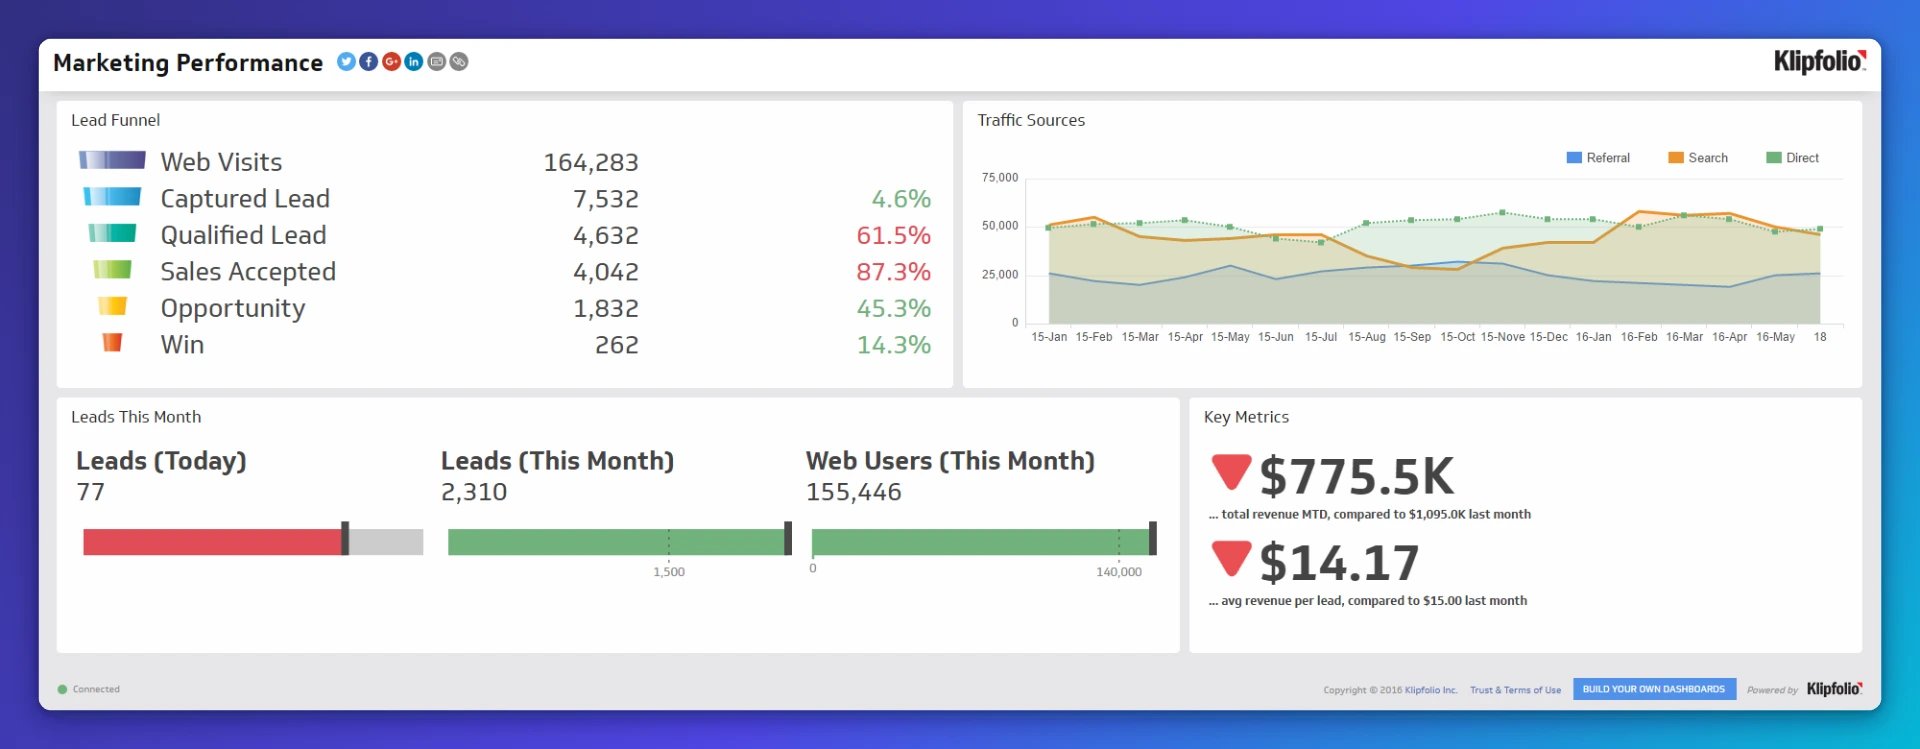
Marketing teams typically track metrics across multiple channels, from web analytics metrics to email marketing KPIs and more. Make sure your marketing dashboard surfaces the metrics that directly affect day-to-day performance. View Klipfolio's live Marketing Dashboards.
Developer TV dashboard
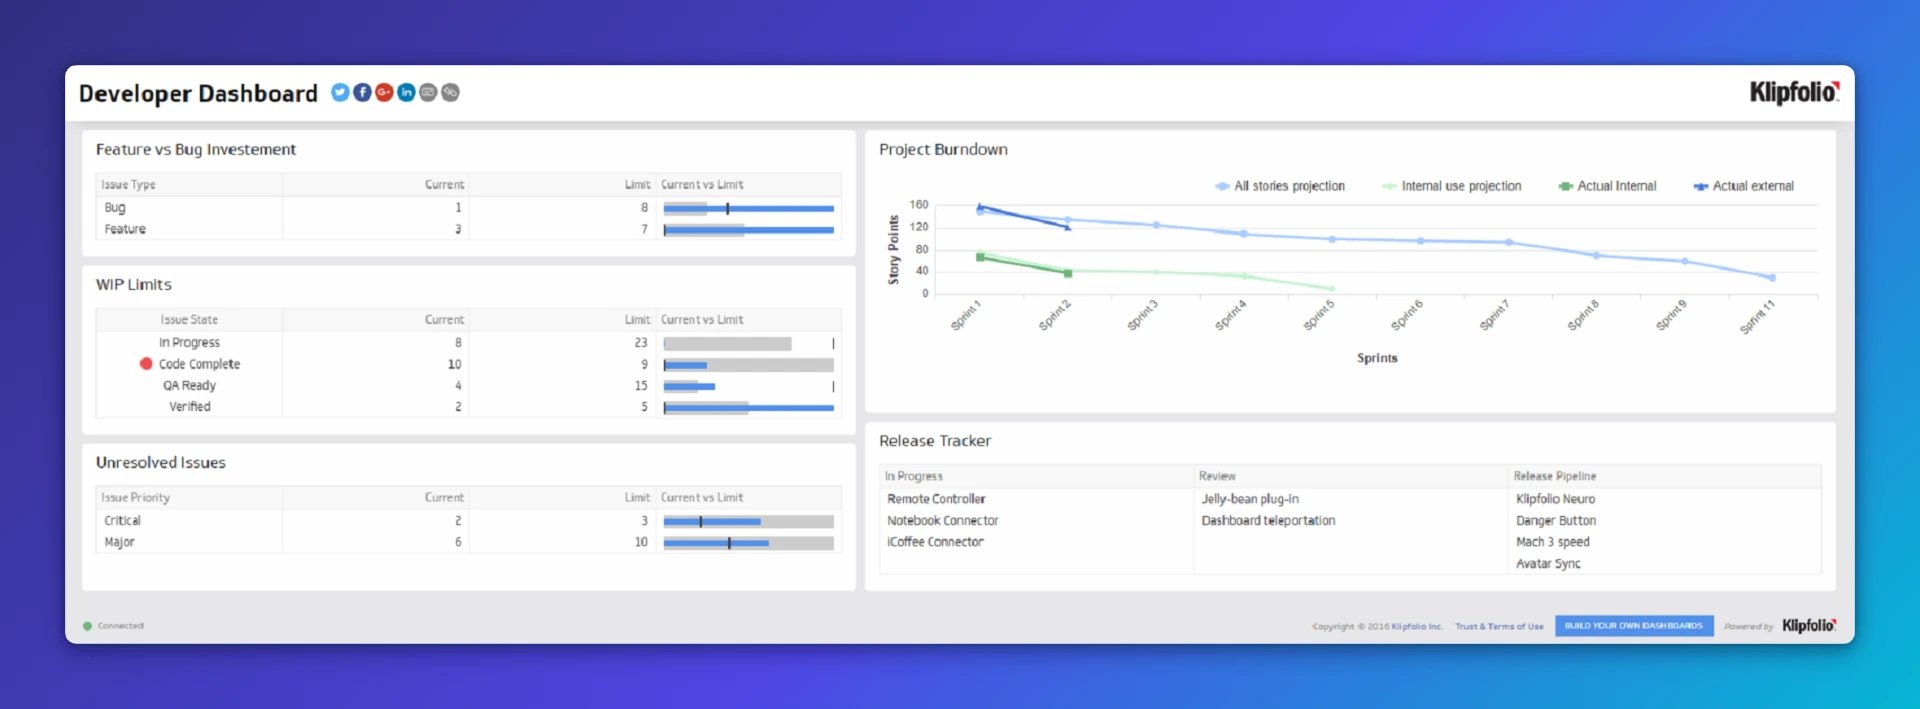
This developer dashboard displays a project burndown and release tracker to keep the DevOps team aligned. It also surfaces unresolved issues, WIP limits, and feature-versus-bug investment, so the team can monitor performance and address problems immediately. View Klipfolio's live DevOps Dashboard.
Sales TV dashboard
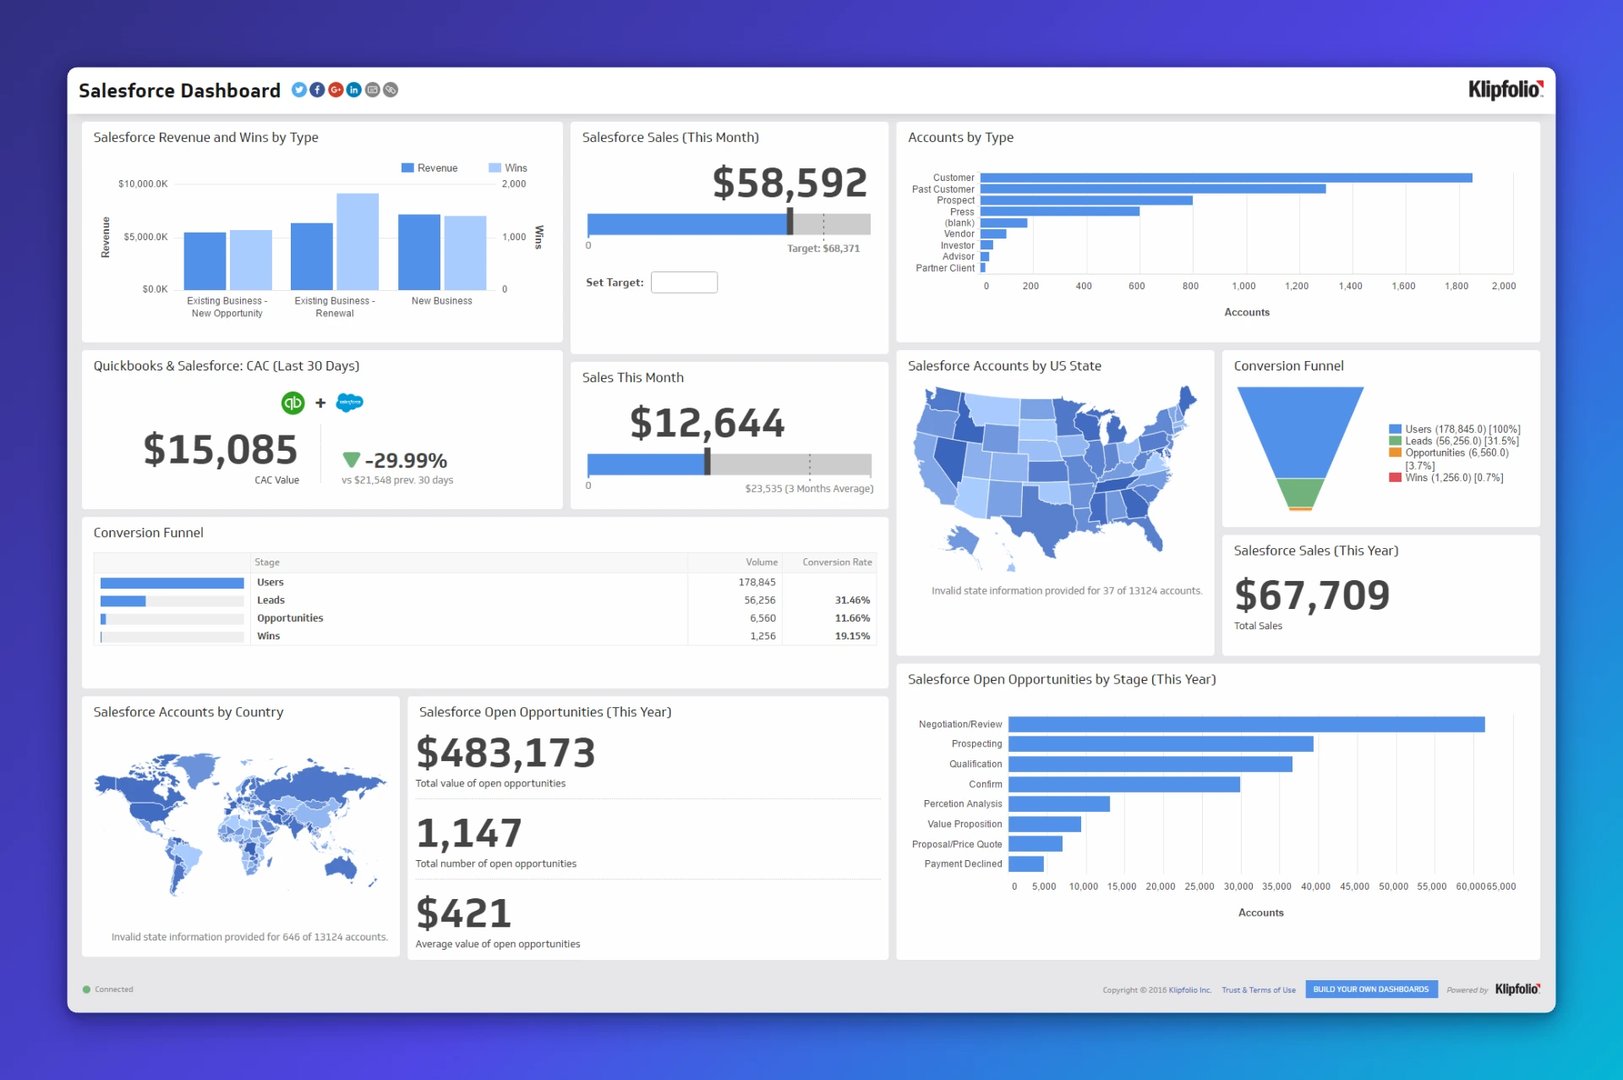
Sales teams need up-to-the-minute visibility into opportunities, closed deals, and new leads. The example below is built on our Salesforce Dashboard. Salesforce is an automated CRM platform that centralizes pipeline data, and when that data feeds a live TV dashboard, your team always knows where things stand. View Klipfolio's live Salesforce Dashboard.
Get started with Klips
Klips connects to 130+ data sources, updates automatically, and looks sharp on any screen. Your team's most important numbers stay on the wall without anyone having to pull them. Try Klips free and see what it feels like when the data is just there.
Published 2026-08-24



Most recent
- AUG 11Beyond simple sign-ups: how True Trials and Activation predict growth
- JUL 7Why business leaders miss important trends in their dashboards
- JUN 19The best chart for the job: Visualizing data for non-technical users
- JUN 95 tips to understand (and organize) your restaurant data
- MAY 26Think in Horizons, Not Seconds
- MAY 2010 Cloud BI Dashboard Tools for Small Businesses in 2026