

7 ways to present KPIs that your management team will love
Presenting KPIs well determines whether your management team acts on the data or ignores it. This guide covers seven practical ways to present KPIs using a complete dashboard solution like Klips, from automated email reports and PDFs to interactive dashboards, wallboards, and mobile access. Each method is designed to put the right numbers in front of decision-makers without manual effort, so your team stays aligned and confident without having to ask for a report.
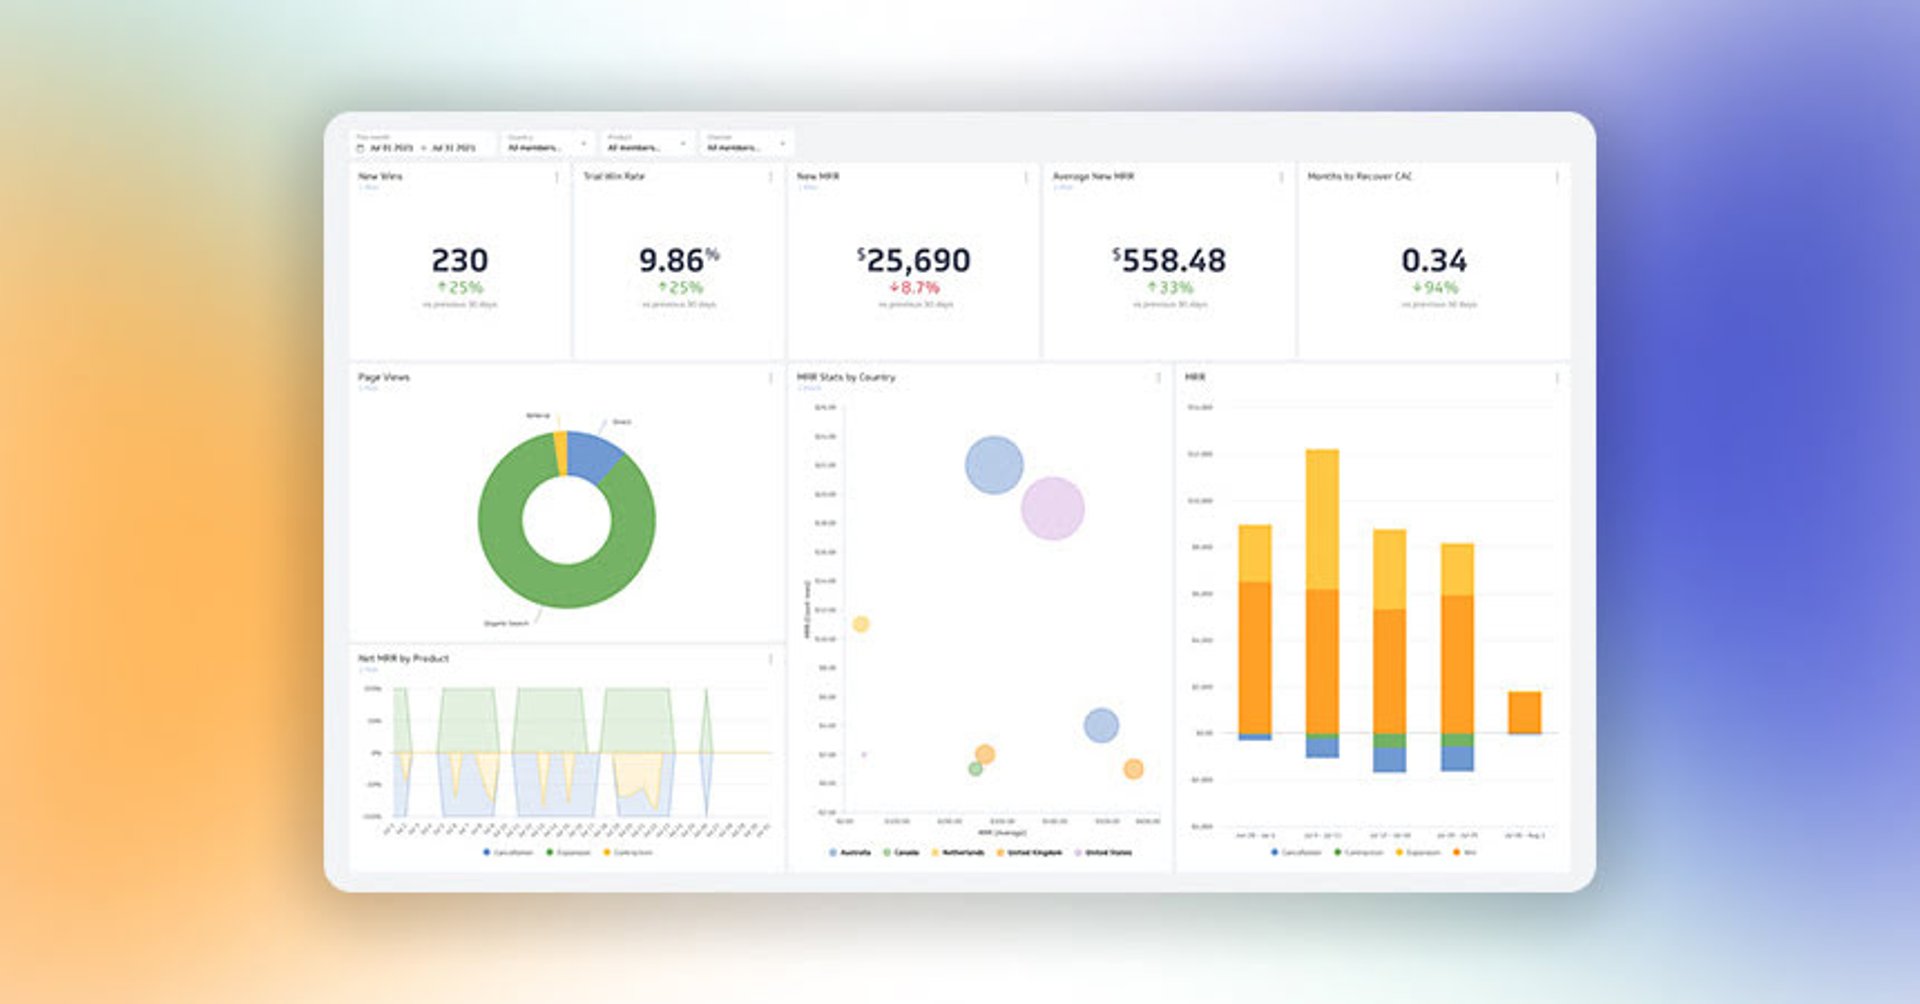
KPI reporting gets pushed to the bottom of the list because it feels like a lot of work for a result nobody gets excited about. But when your management team can see exactly where things stand, without asking, without waiting, and without decoding a spreadsheet, decisions get made faster and with more confidence.
KPIs are important, and the way you present them determines whether they drive action or collect dust. This guide covers seven practical ways to present KPIs that your management team will actually use.
What should be included in a KPI report?
A good KPI report gives your management team a clear answer to one question: how are we doing against what matters most?
Every report should have a defined objective, a small set of metrics that support it, and visuals that make the story obvious at a glance. Accessibility matters too: if someone has to dig for the number or ask for clarification, the report has already lost them. This is why knowing how to define your organization's KPIs before you build anything saves time later.
A great KPI report is also easy to update. If refreshing it takes an hour every week, it will not stay current for long.
How do I create a KPI report?
When you track your KPIs on a dashboard in Klips (our dashboard software), reporting stops being a manual task. Klips connects to your data sources automatically, so the numbers are always current. Your team sees what they need without anyone having to pull, paste, or format anything.
That reliability matters more than it might seem. When your management team trusts that the number on the screen is the right number, they stop second-guessing it and start acting on it.
How do I present a KPI report?
Here are seven ways to present KPIs to managers and executives using a complete dashboard solution like Klips:
- Share an email report with KPIs
- Distribute a PDF that shows KPIs
- Present KPIs using a slide presentation
- Display KPIs on a TV dashboard
- Visualize KPIs using a KPI dashboard
- Share KPIs using mobile reports or dashboards
- Build your own KPIs using dashboard software

1. Presenting KPIs in an email report
Email reporting puts your KPI data directly in front of the people who need it, on whatever device they happen to be using.
Send your KPI report as a mobile-friendly PDF or embedded image. No app to download, no login required. Your management team gets the update in the same place they already spend their time.
Automatically email a KPI presentation
Set up scheduled email reporting and the report lands in your team's inbox on its own. You spend less time assembling the update; your management team spends more time reviewing it. The numbers arrive before anyone has to ask.
Email a KPI report on demand
Scheduled reporting handles the routine. Email also works well for one-time or urgent requests. When your manager asks about this month's lead numbers or the current campaign performance, you already have something ready to share. You are not scrambling to pull data or explain your methodology from scratch.
2. Turn your KPI presentation into a PDF report
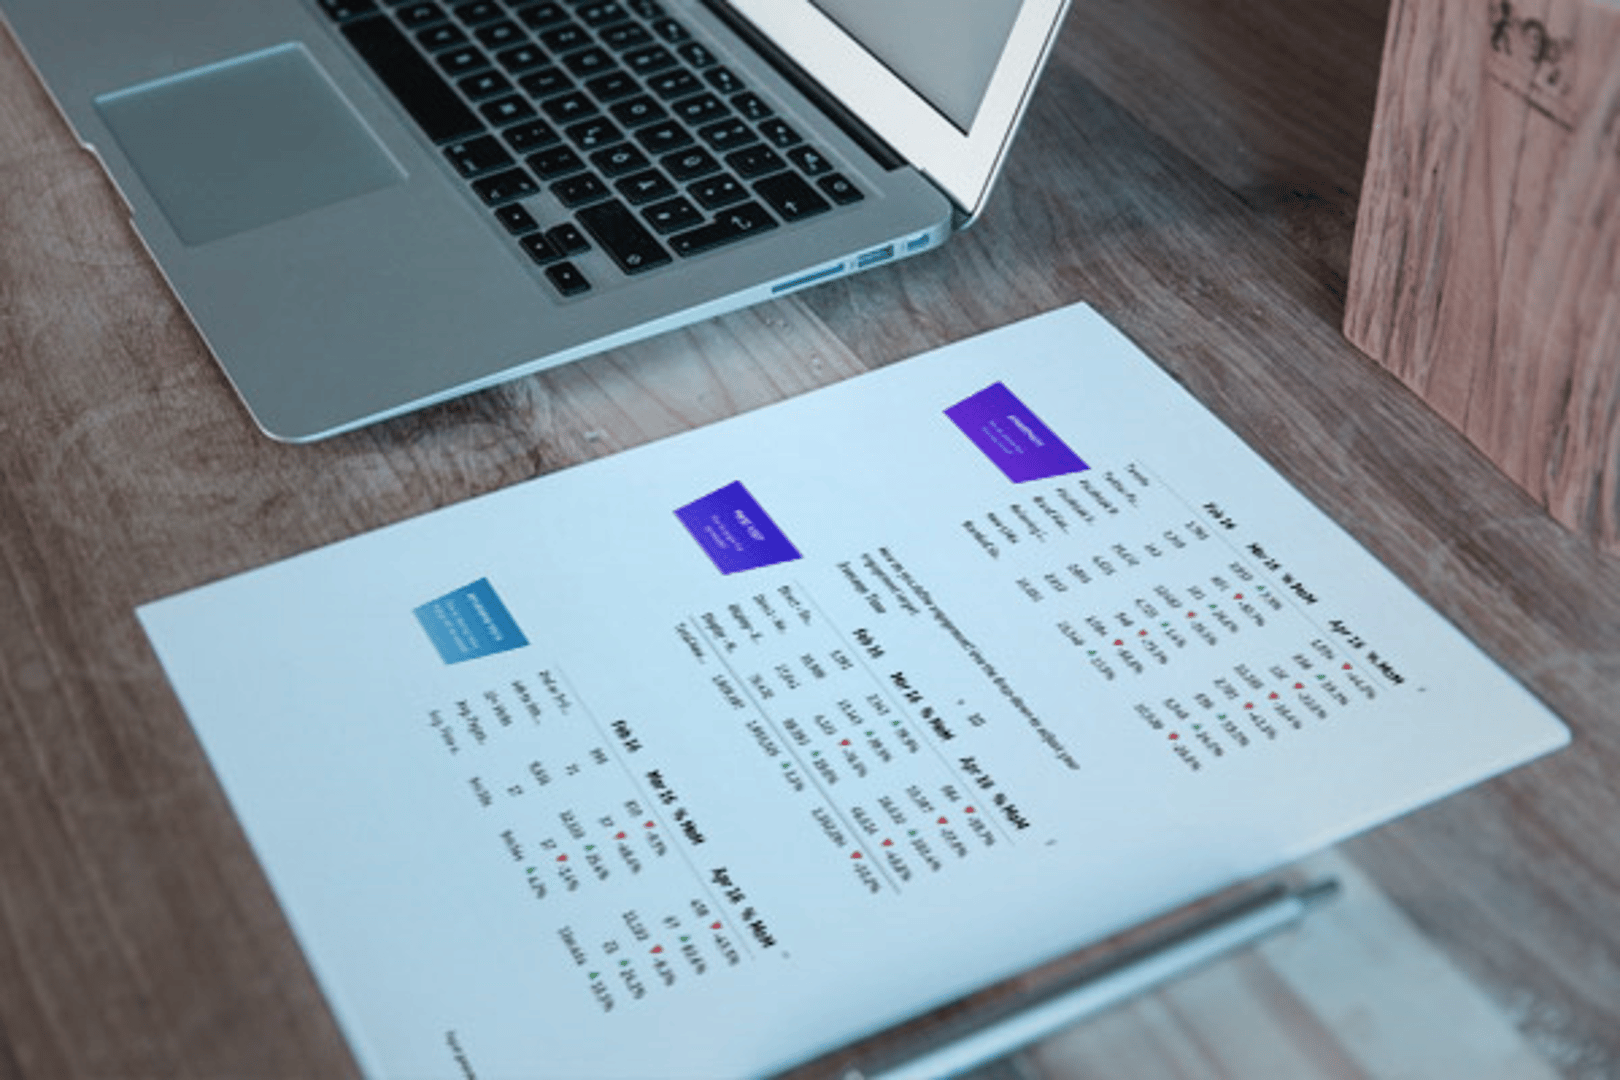
PDFs keep your data looking clean and consistent whether someone opens them on a screen or prints them for a meeting.
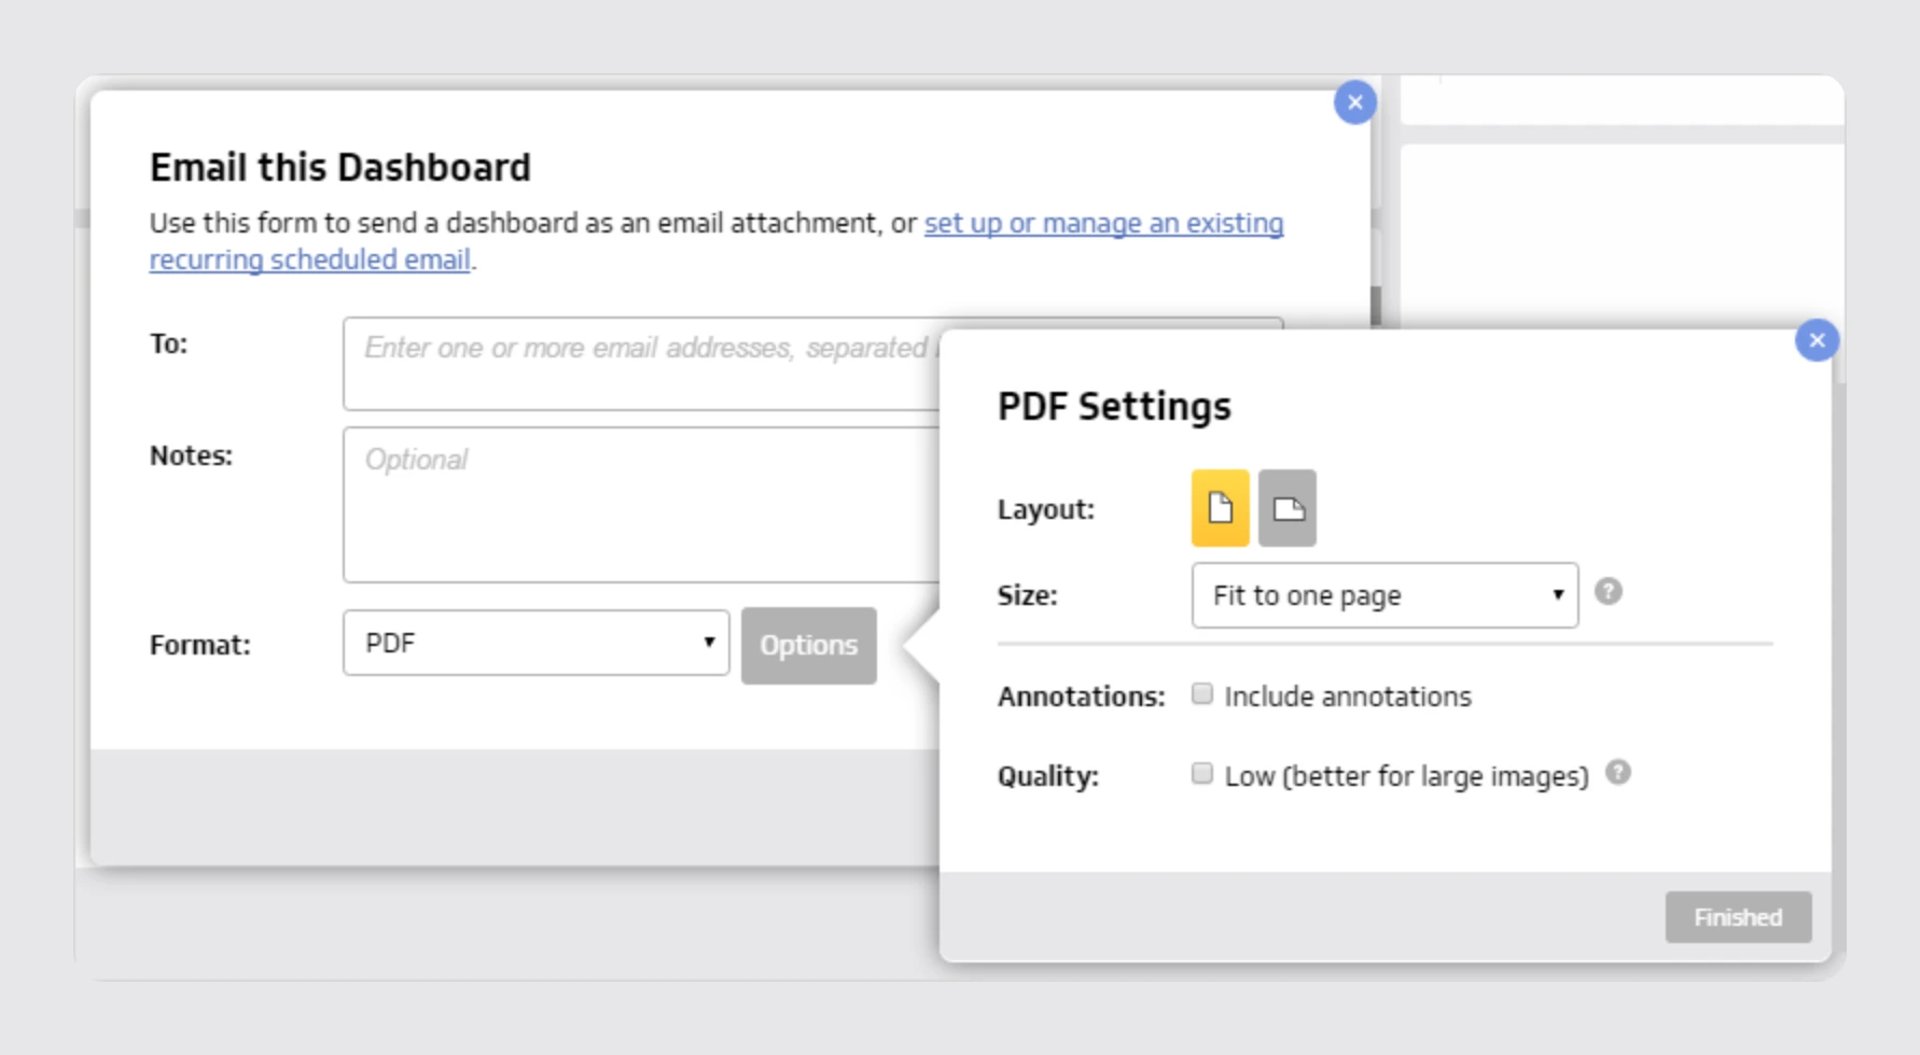
Klips lets you download your dashboard as a PDF, formatted exactly as it appears on screen. You can adjust layout, size, and style without rebuilding anything. Add your branding and the report looks like something your team prepared carefully, even if it took minutes.
The bigger benefit: you are not extracting data manually or recreating charts in a separate tool. The report builds itself from the live dashboard.
3. Create a KPI report slide presentation
A slide presentation turns KPI data into a conversation, not just a handoff.
Embed your dashboard as an image or drop it directly into PowerPoint or Google Slides. Keep text minimal. Let the visuals carry the story. When your management team can see progress at a glance, the discussion moves faster and stays focused on what to do next rather than what the numbers mean.
Create custom dashboards for you and your team.
Get started with KlipsHow do you show KPIs in a presentation?
Strong visuals keep everyone engaged when time is short. A useful rule: no more than two images per slide when text is present, and no more than four when it is not. If each slide covers a single KPI, connect it explicitly to the others and to the overall objective. KPIs do not live in isolation, and your presentation should reflect that.
Keep the conversation going after the meeting
After a dashboard-driven KPI presentation, executives often want to explore further. Share the live dashboard so they can keep looking without waiting for the next meeting. That follow-through is what turns a one-time presentation into an ongoing habit.
4. Present your KPIs on a KPI dashboard
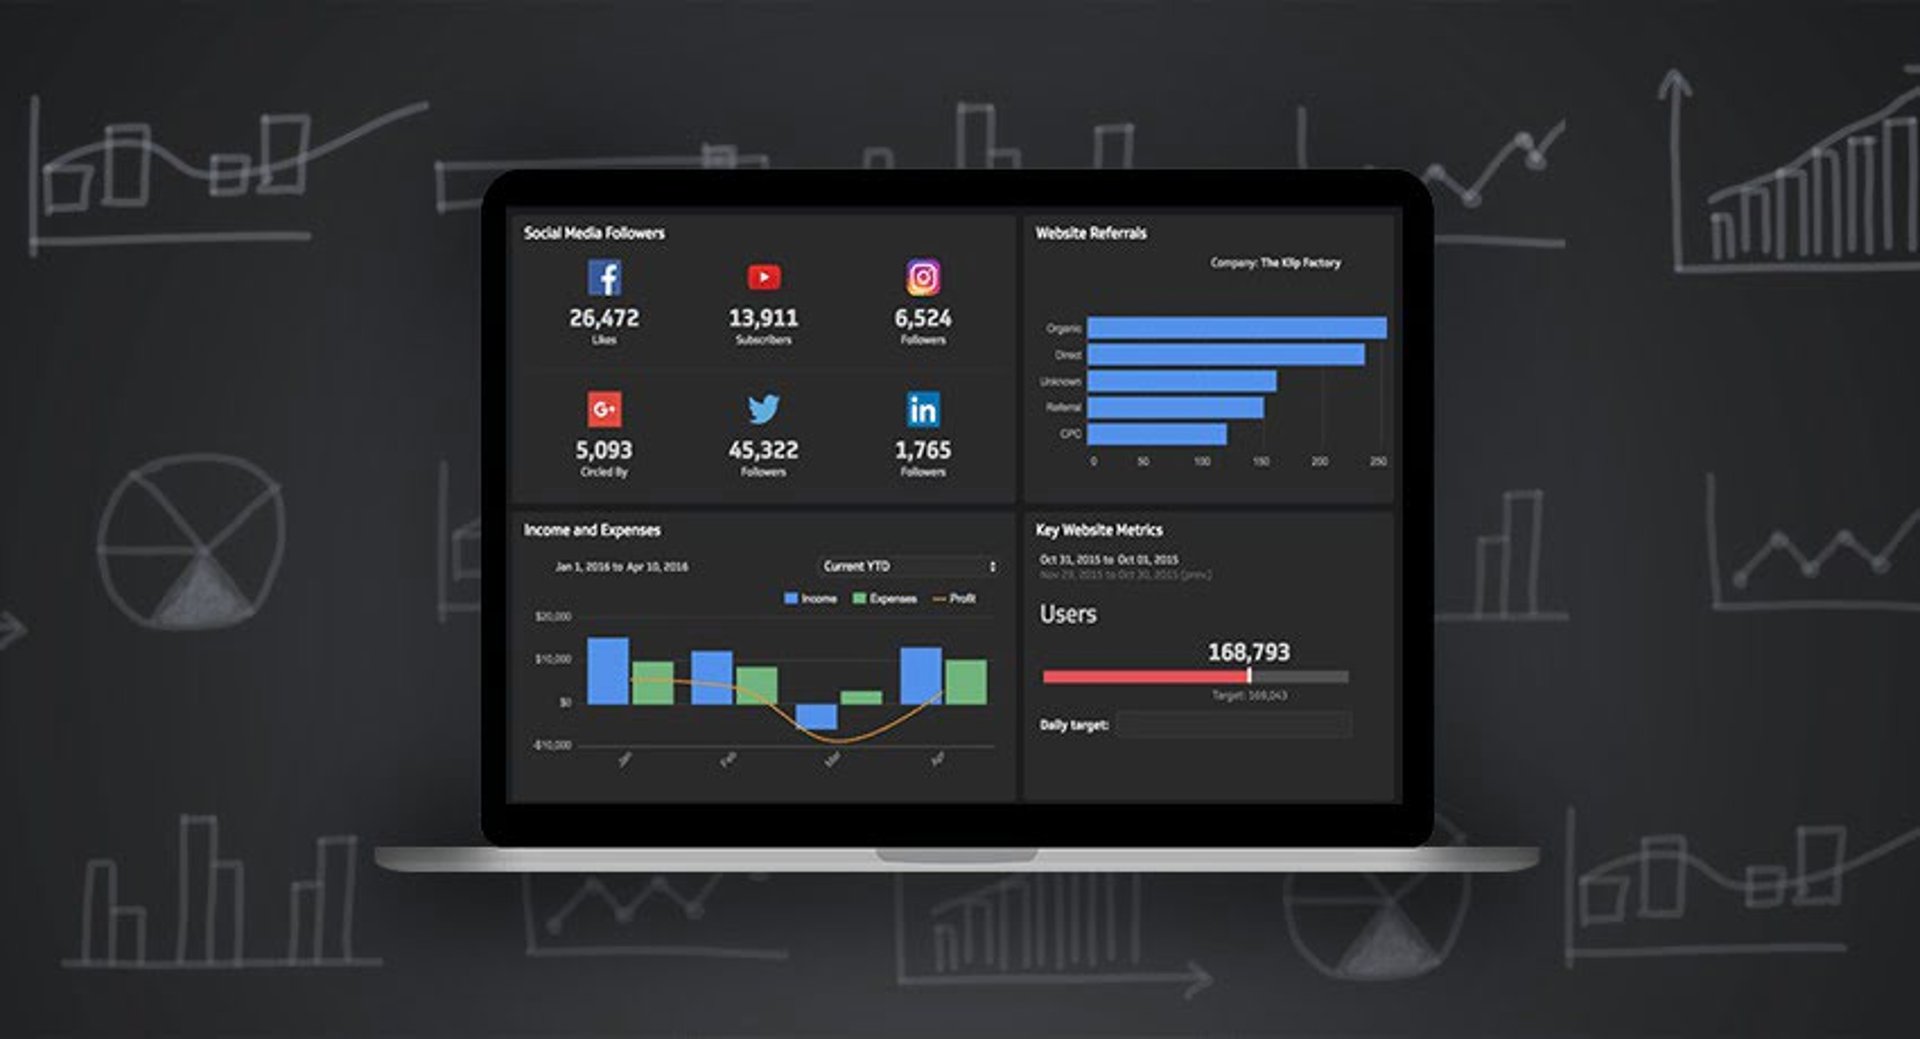
A KPI dashboard displays your metrics in dynamic, interactive visualizations that update automatically. No manual refresh, no version confusion.
When your management team has direct access to a Klips dashboard, they can check in whenever they want. They do not need to wait for a report, ask someone to pull a number, or piece together context from three different tools. The answer is already there.
There is no set time to review KPIs. The teams that get the most value from their data check in regularly, not just at month-end. A live dashboard makes that easy.

5. Combine live links and wallboards for an always-on KPI view
Shareable public links give anyone access to your dashboard without requiring a login. They are useful when you want to share data with a broader internal group, external stakeholders, or clients. Klips lets you publish a dashboard with or without password protection.
Public links for your KPI presentation
A public link means your management team, your clients, or your partners can check the numbers whenever they need to. For professional services firms tracking KPIs on behalf of clients, this removes a layer of back-and-forth from every reporting cycle.
Foster teamwork with a wallboard
Use wallboards to display one dashboard on a screen in a shared space and performance becomes part of the environment, not something people have to remember to check. When the numbers are visible, conversations happen naturally. Teams start asking questions across departments. That is the goal.
6. Grant direct KPI dashboard access
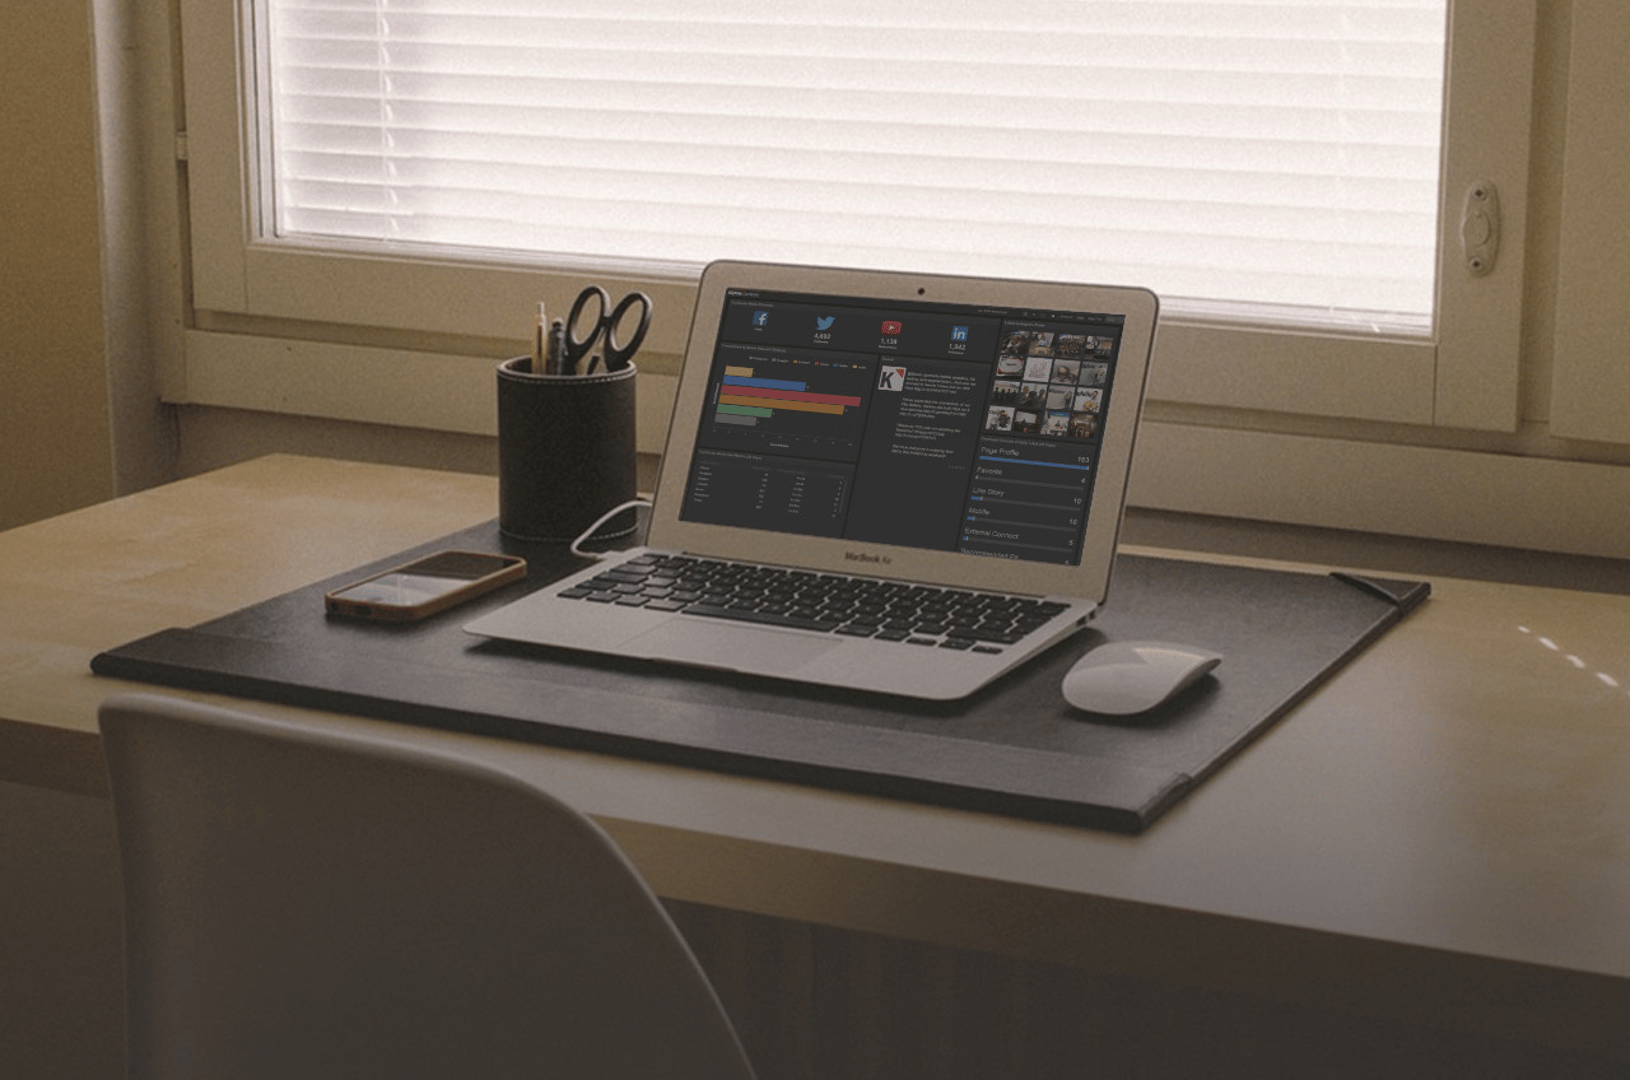
Direct access removes the bottleneck. When your management team can open a dashboard themselves, they are not waiting on anyone.
You can set up role-specific dashboards so each person sees what is relevant to their area. A sales leader sees pipeline and revenue metrics. A marketing lead sees campaign and acquisition data. Everyone gets clarity without getting noise. Direct access also signals something important: the data is trustworthy enough to share openly, and the team's work is visible to the people who need to see it.

7. Take your data everywhere with a mobile KPI presentation
Executives are rarely at their desks when a decision needs to be made. Mobile access means the data travels with them.
When KPI dashboards are accessible on a smartphone, performance is never more than a tap away. A quick check before a call, a number pulled up mid-conversation, a question answered without saying "I'll follow up when I'm back at my desk." That kind of immediacy changes how decisions get made.
Add real data to every conversation
How often does a casual work conversation end with "I'll send you that number later"? Mobile KPI access closes that gap. When you can show the data in the moment, the conversation moves forward instead of stalling. That is the difference between a discussion and a decision.
As remote and hybrid work becomes the norm for growing teams, mobile reporting is not a nice-to-have. It is how your team stays aligned without being in the same room.
Also, see:
Published 2026-08-24




Most recent
- AUG 11Beyond simple sign-ups: how True Trials and Activation predict growth
- JUL 7Why business leaders miss important trends in their dashboards
- JUN 19The best chart for the job: Visualizing data for non-technical users
- JUN 95 tips to understand (and organize) your restaurant data
- MAY 26Think in Horizons, Not Seconds
- MAY 2010 Cloud BI Dashboard Tools for Small Businesses in 2026