What are Financial Metrics?
Financial metrics are used to evaluate and assess the financial performance, health, and stability of a company or an investment. These metrics are derived from a company's financial statements, such as the balance sheet, income statement, and cash flow statement. They help investors, analysts, and management make informed decisions regarding the company's operations, financial position, and future prospects.
Common examples of financial metrics include revenue, net income, earnings per share (EPS), return on investment (ROI), return on equity (ROE), price-to-earnings (P/E) ratio, and debt-to-equity ratio. By analyzing these metrics, stakeholders can gain insights into a company's profitability, efficiency, liquidity, solvency, and overall financial performance.
Grow your business and monitor your fiscal accounting health
Whether you are a successful Fortune 1000 enterprise or an ambitious startup, success depends on generating revenue and managing your key financial metrics. Stakeholders, investors, and customers look to financial data and KPIs to assess the performance and viability of your business model.
Use these financial KPIs and ratios to create dashboards to track the health of your business.
What are the top 3 key financial metrics in any company?
There are 3 top financial metrics that are important in every company: revenue, net profit, and burn rate.
Revenue is the income generated through your business’ primary operations, often referred to as the “top line.” Net profit is the dollar value that remains after all expenses are subtracted from your company’s total income, often referred to as the “bottom line.” Net burn, or burn rate, is the amount of money a company loses per month as they burn through cash reserves.
Here are the key financial metrics and KPIs that you can add to a dashboard to track the financial health of your business.
Best Financial Metrics
The top KPIs for modern finance and accounting teams:
- Current Ratio
- Gross Margin
- Net Burn
- Net Profit
- Revenue
- Earnings Before Interests, Taxes, Depreciation, and Amortization (EBITDA)
- Annual Recurring Revenue
- CAC Payback Period
- Customer Lifetime Value
- Revenue Per Employee
- MRR Growth Rate
As we wrap up our exploration of financial metrics and KPIs, it's crucial to remember that keeping a close eye on these indicators is the key to unlocking insights into your organization's financial well-being. By staying in tune with these metrics, you'll be better equipped to make strategic decisions that foster growth and financial stability.
To further your knowledge and expertise in KPI analysis and implementation, we invite you to check out our extensive resource on KPI examples & templates. This handpicked collection showcases a variety of visual examples and easy-to-adapt templates aimed at helping you effectively measure, analyze, and enhance your organization's financial performance.
Financial Metrics & KPIs
Average Revenue Per User (ARPU)
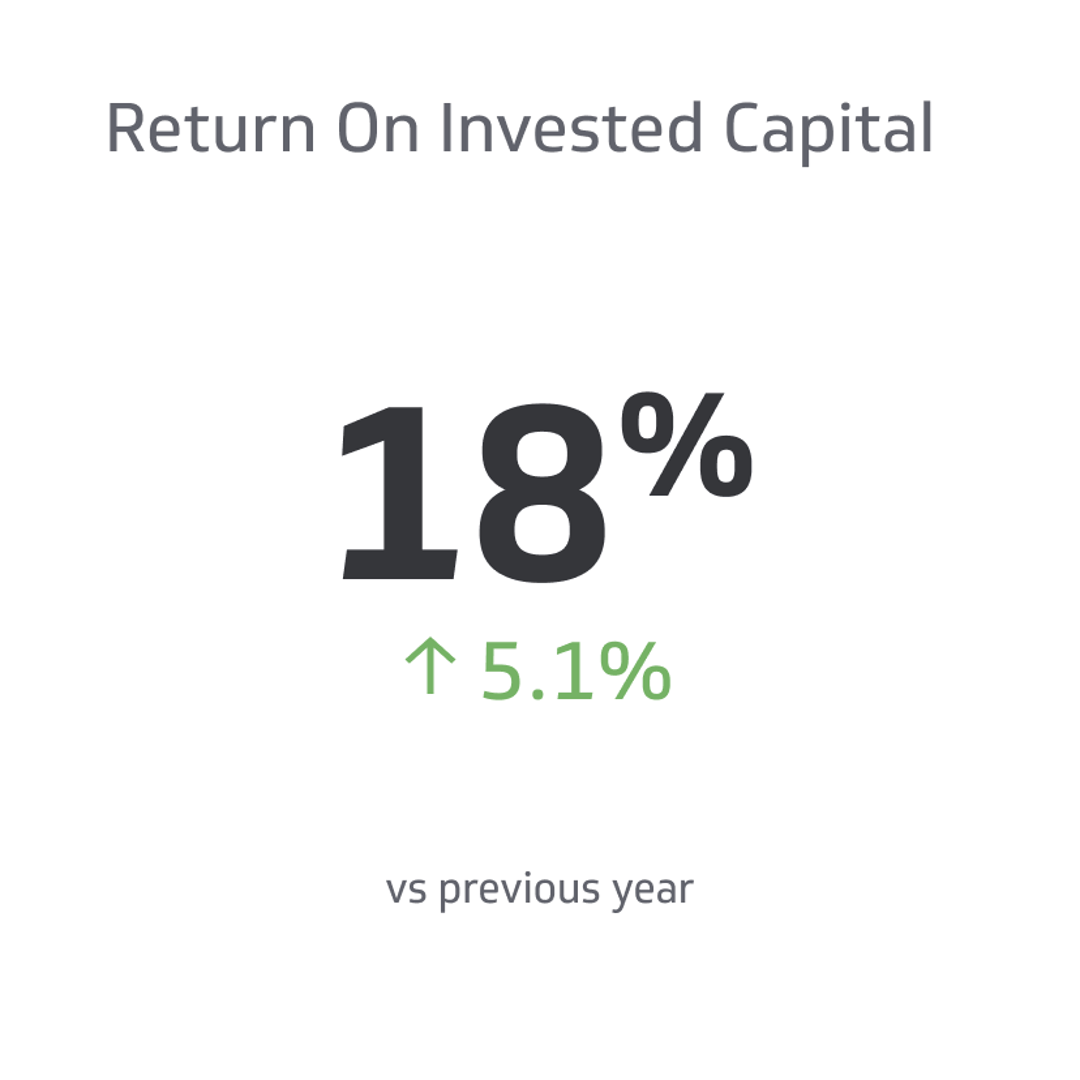
Return on Incremental Invested Capital (ROIIC)
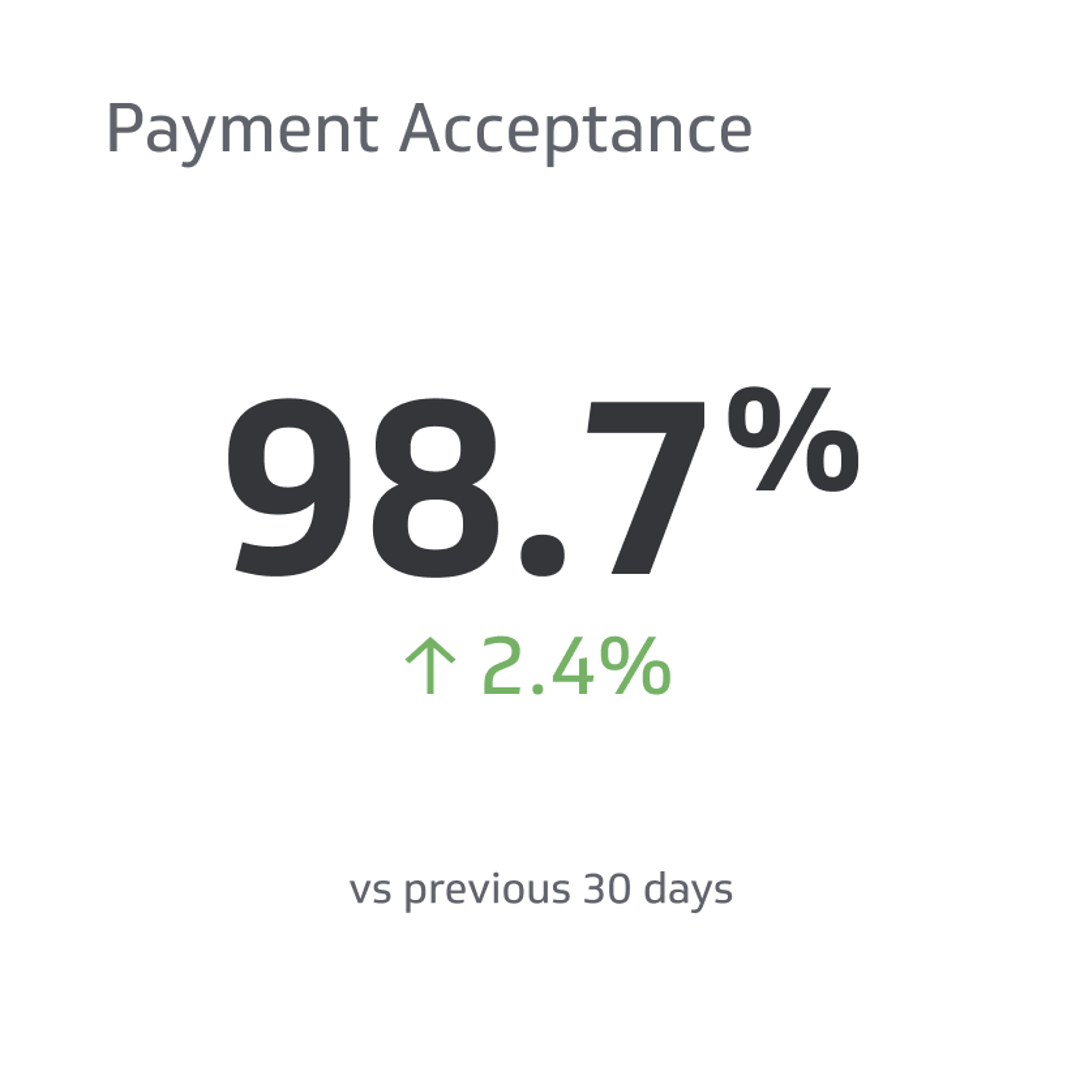
Payment Acceptance
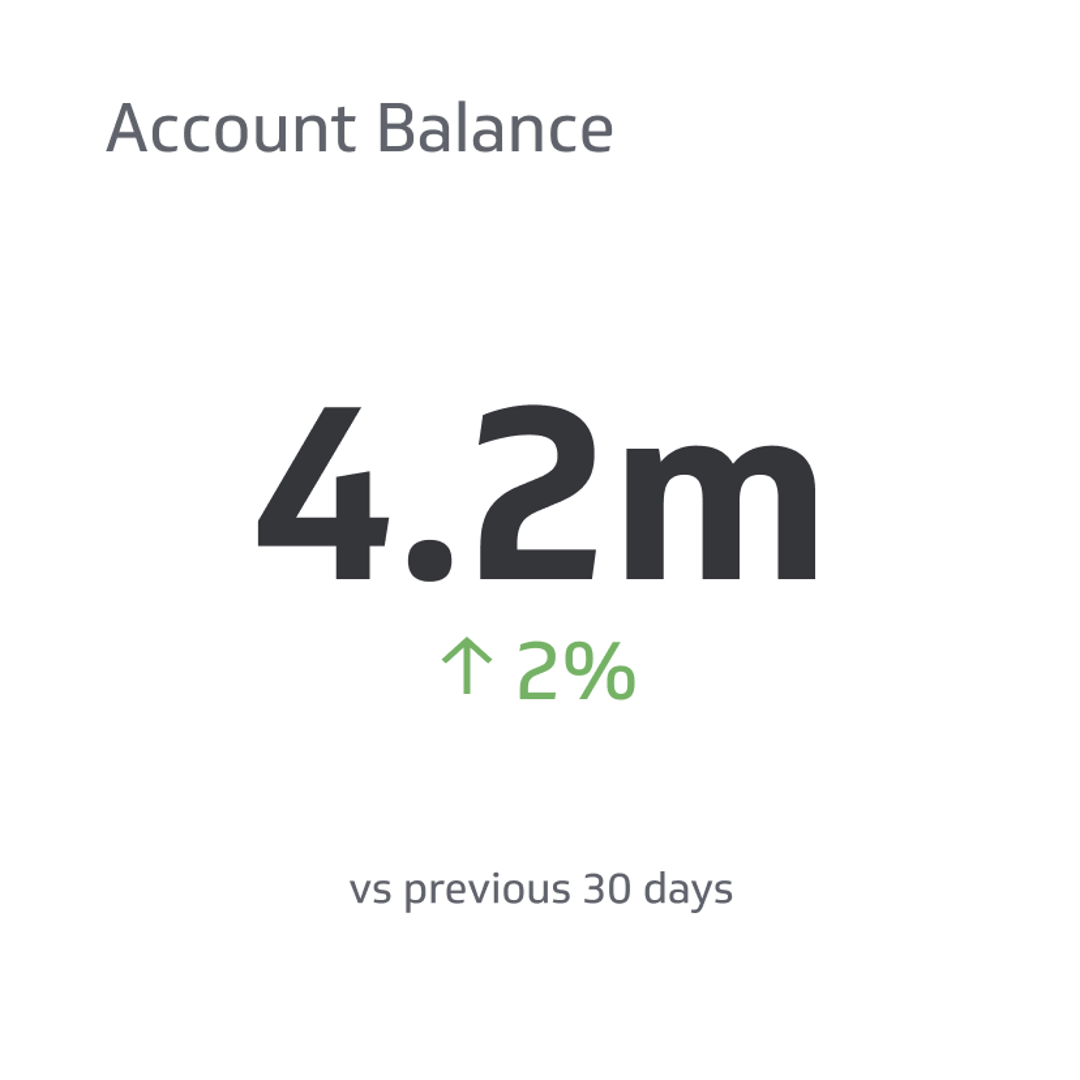
Account Balance
Account balance is the total amount of money held in a financial account at a specific time.
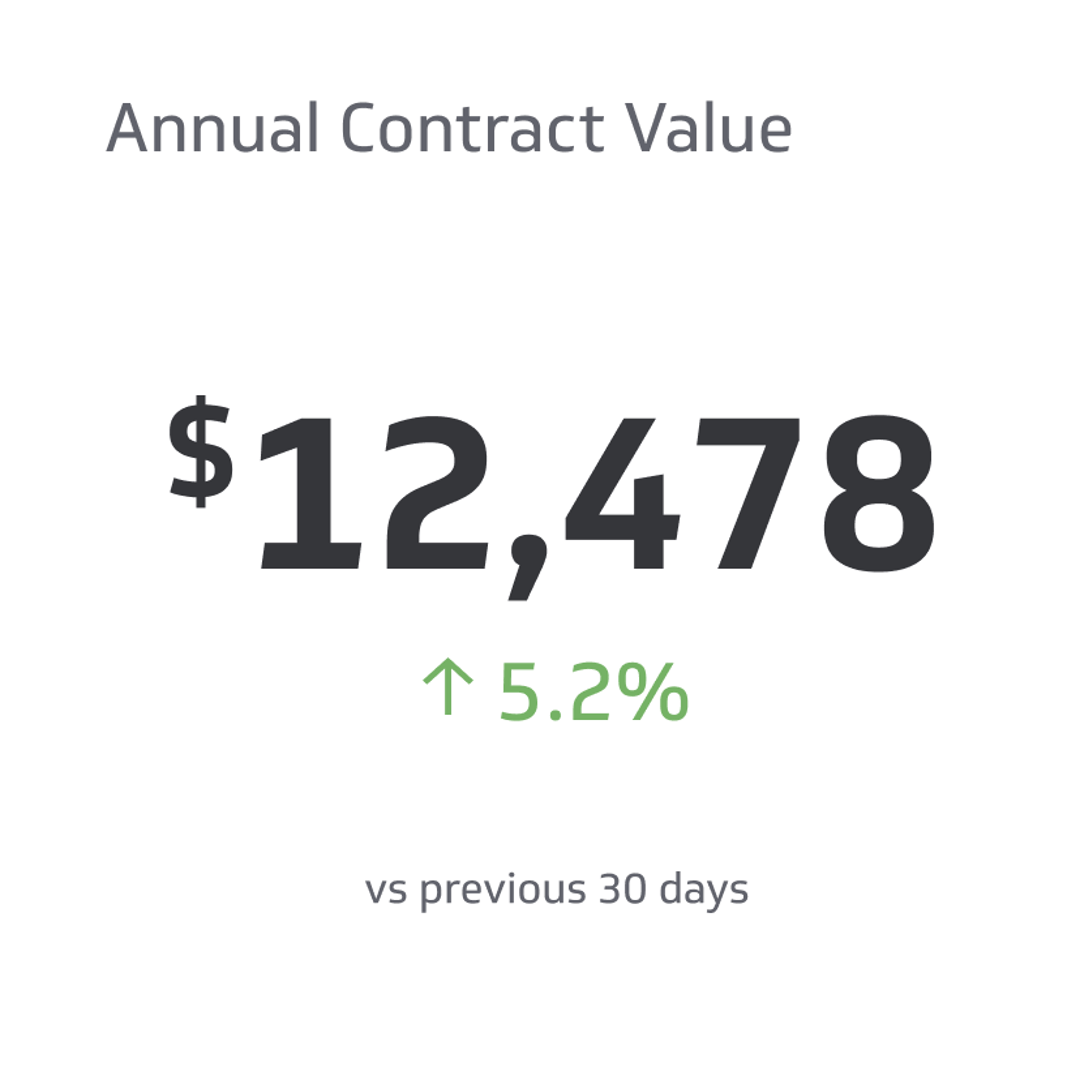
Annual Contract Value
At its core, ACV measures the value of a contract agreement over a single year.
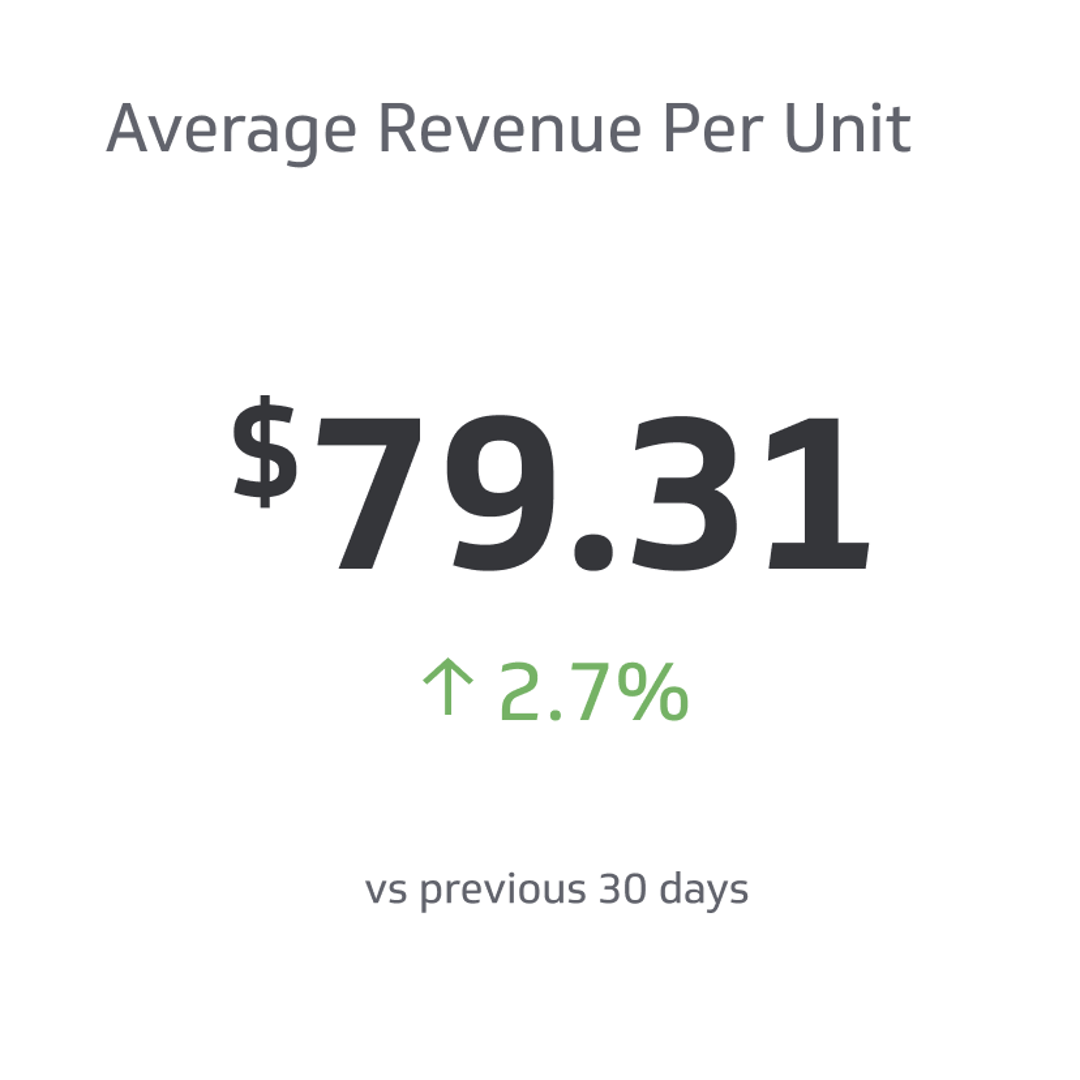
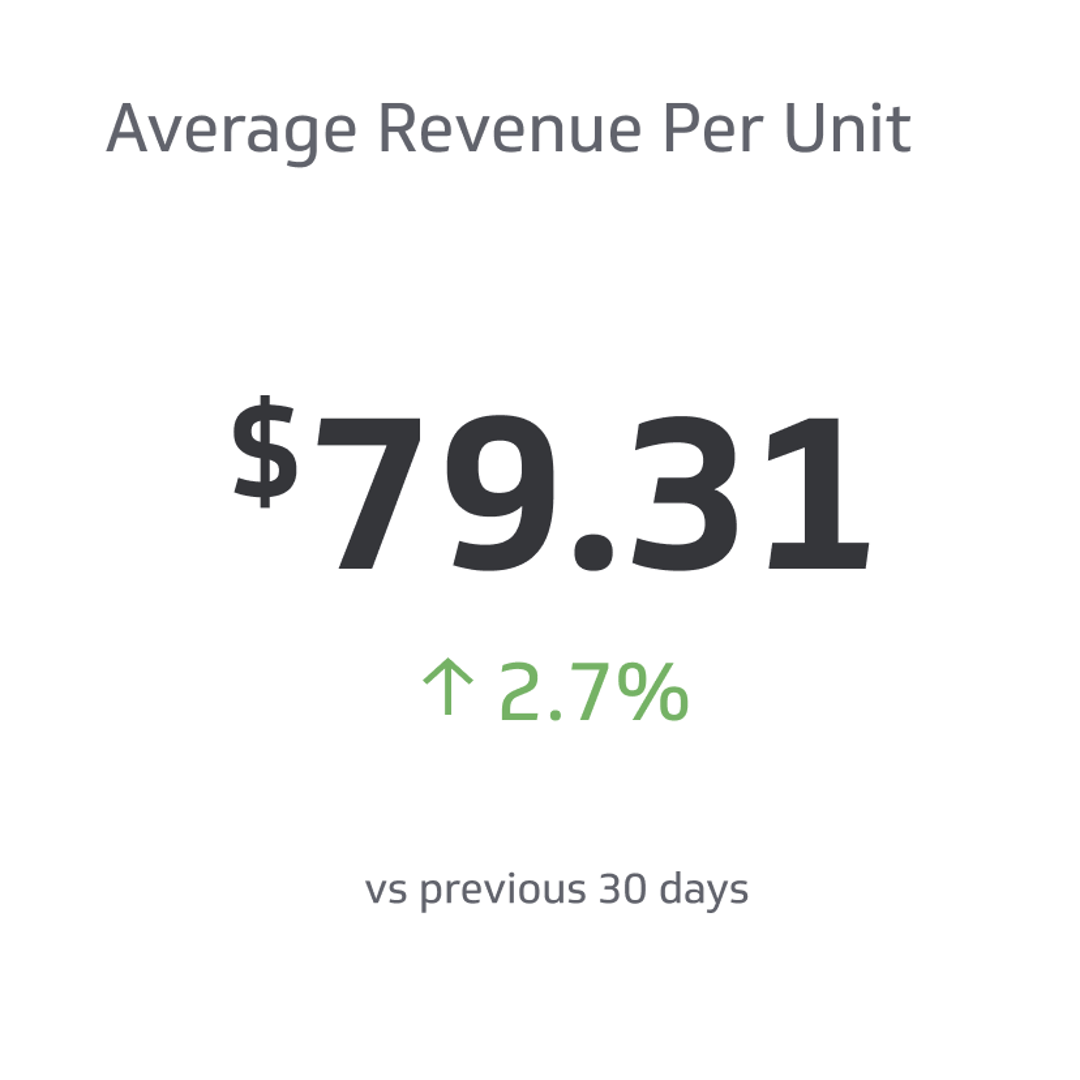
Average Revenue Per Unit (ARPU)
ARPU stands for Average Revenue Per Unit, and it measures the average revenue generated from a single customer or user.
ARR Multiple
The ARR Multiple gauges the ratio between a company’s valuation and its Annual Recurring Revenue (ARR).
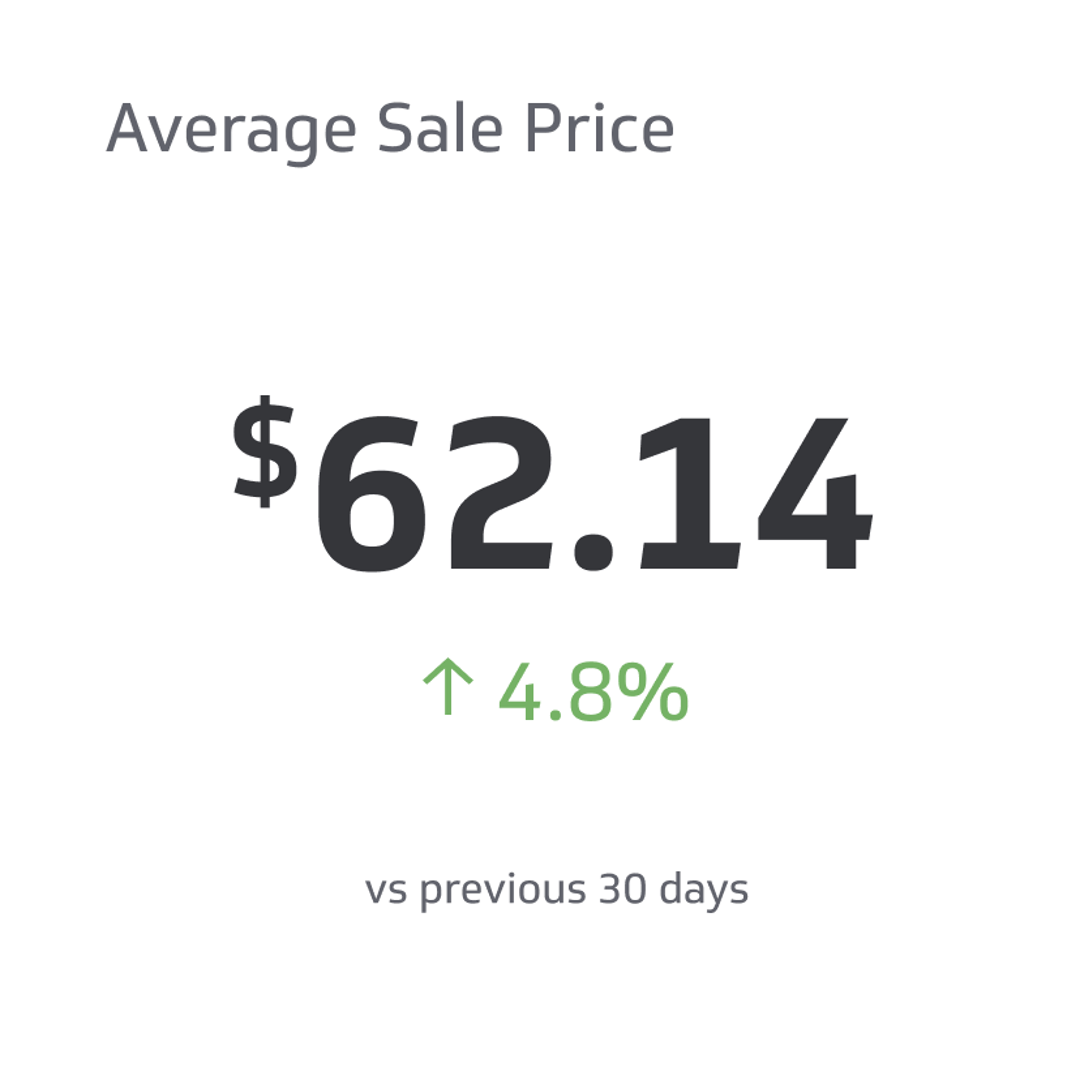
Average Sale Price (ASP)
The average sale price (ASP) is the money customers spend on your product or service in a given period.
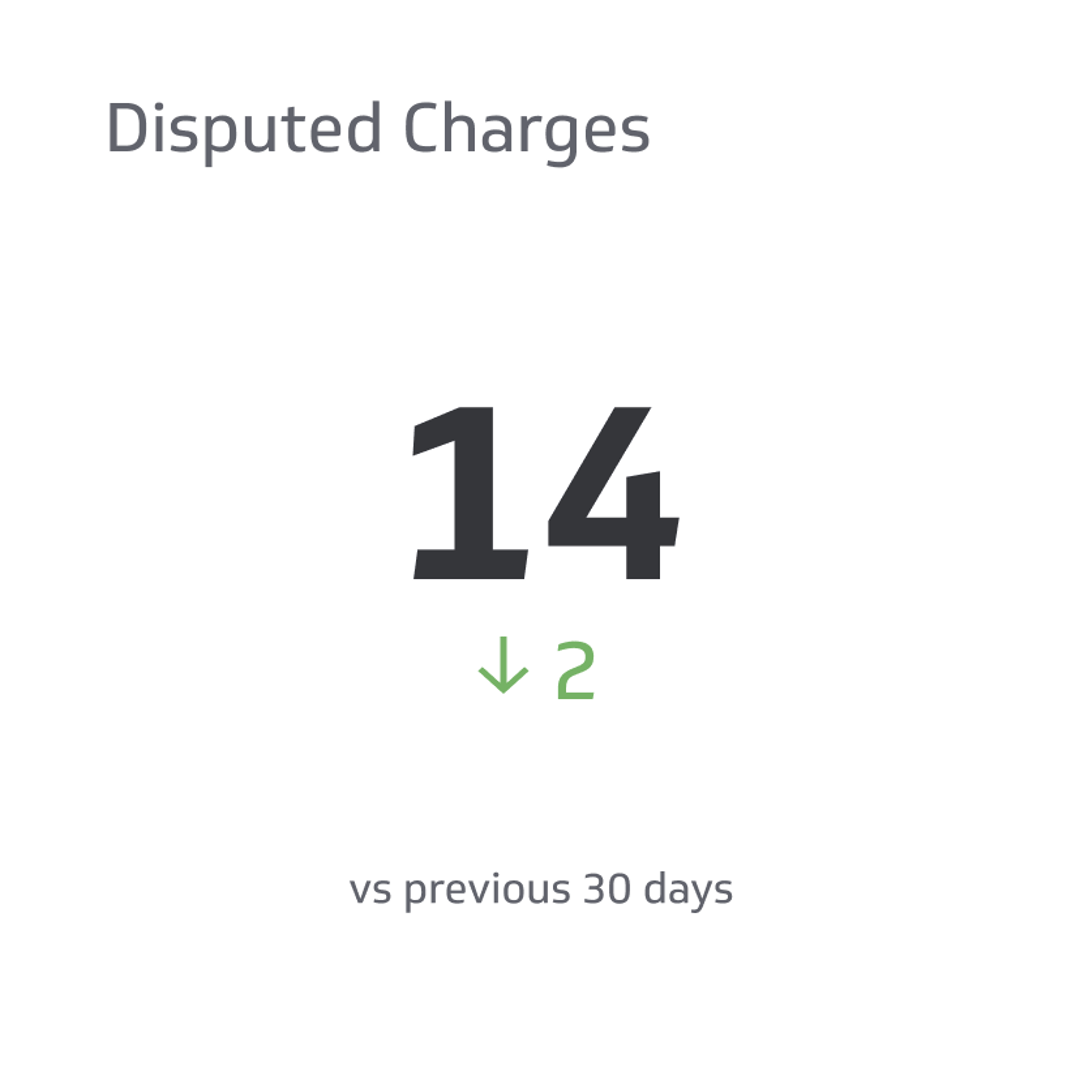
Disputed Charge
Disputed Charges represent the total of payments that have been contested and may result in chargebacks, which occur when your account is charged a fee to cover a contested amount.