

Display Poll Results with a Pie Chart
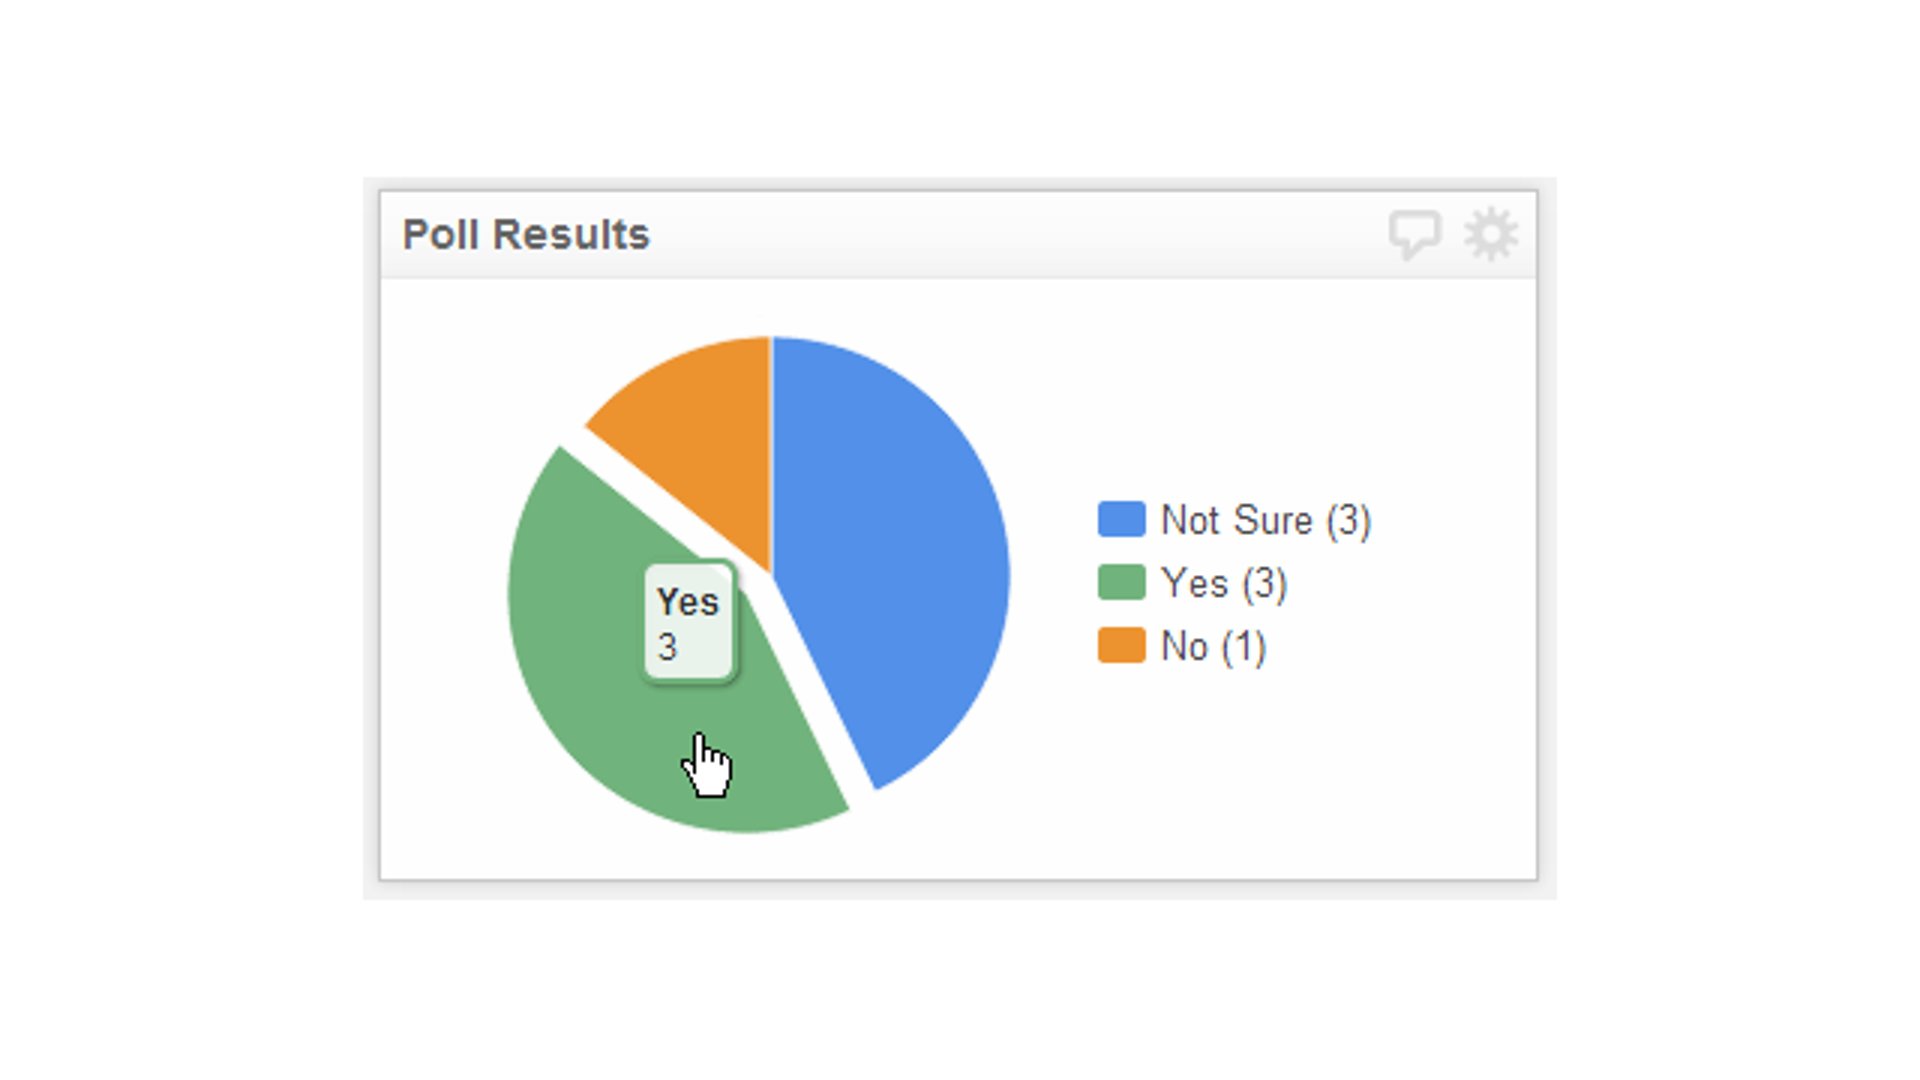
Pie charts are one of the most common ways to show poll results. They allow for quick dissemination of the data and to see results in terms of the whole picture. Let's take a look at how to display poll results using a pie chart.
A Klipfolio support case asked how to display poll results using a pie chart in Klipfolio Klips. The challenge: tally results when each vote is recorded as a separate row and the choice is stored as text. Here's what the data source may look like:
| A | B | |
| 1 | Date | Poll Result |
| 2 | 3/18/2025 | Yes |
| 3 | 4/18/2025 | Yes |
| 4 | 4/18/2025 | Yes |
| 5 | 4/18/2025 | No |
| 6 | 5/18/2025 | Not Sure |
| 7 | 5/19/2025 | Not Sure |
| 8 | 6/19/2025 | Not Sure |
How do we visualize this data?
The hurdle with a data set like this is tallying the results. The trick is using the Klip Editor to prepare the data so the dashboard reads it the way you intend. Use two functions: CountDistinct and Group.
Tallying the results
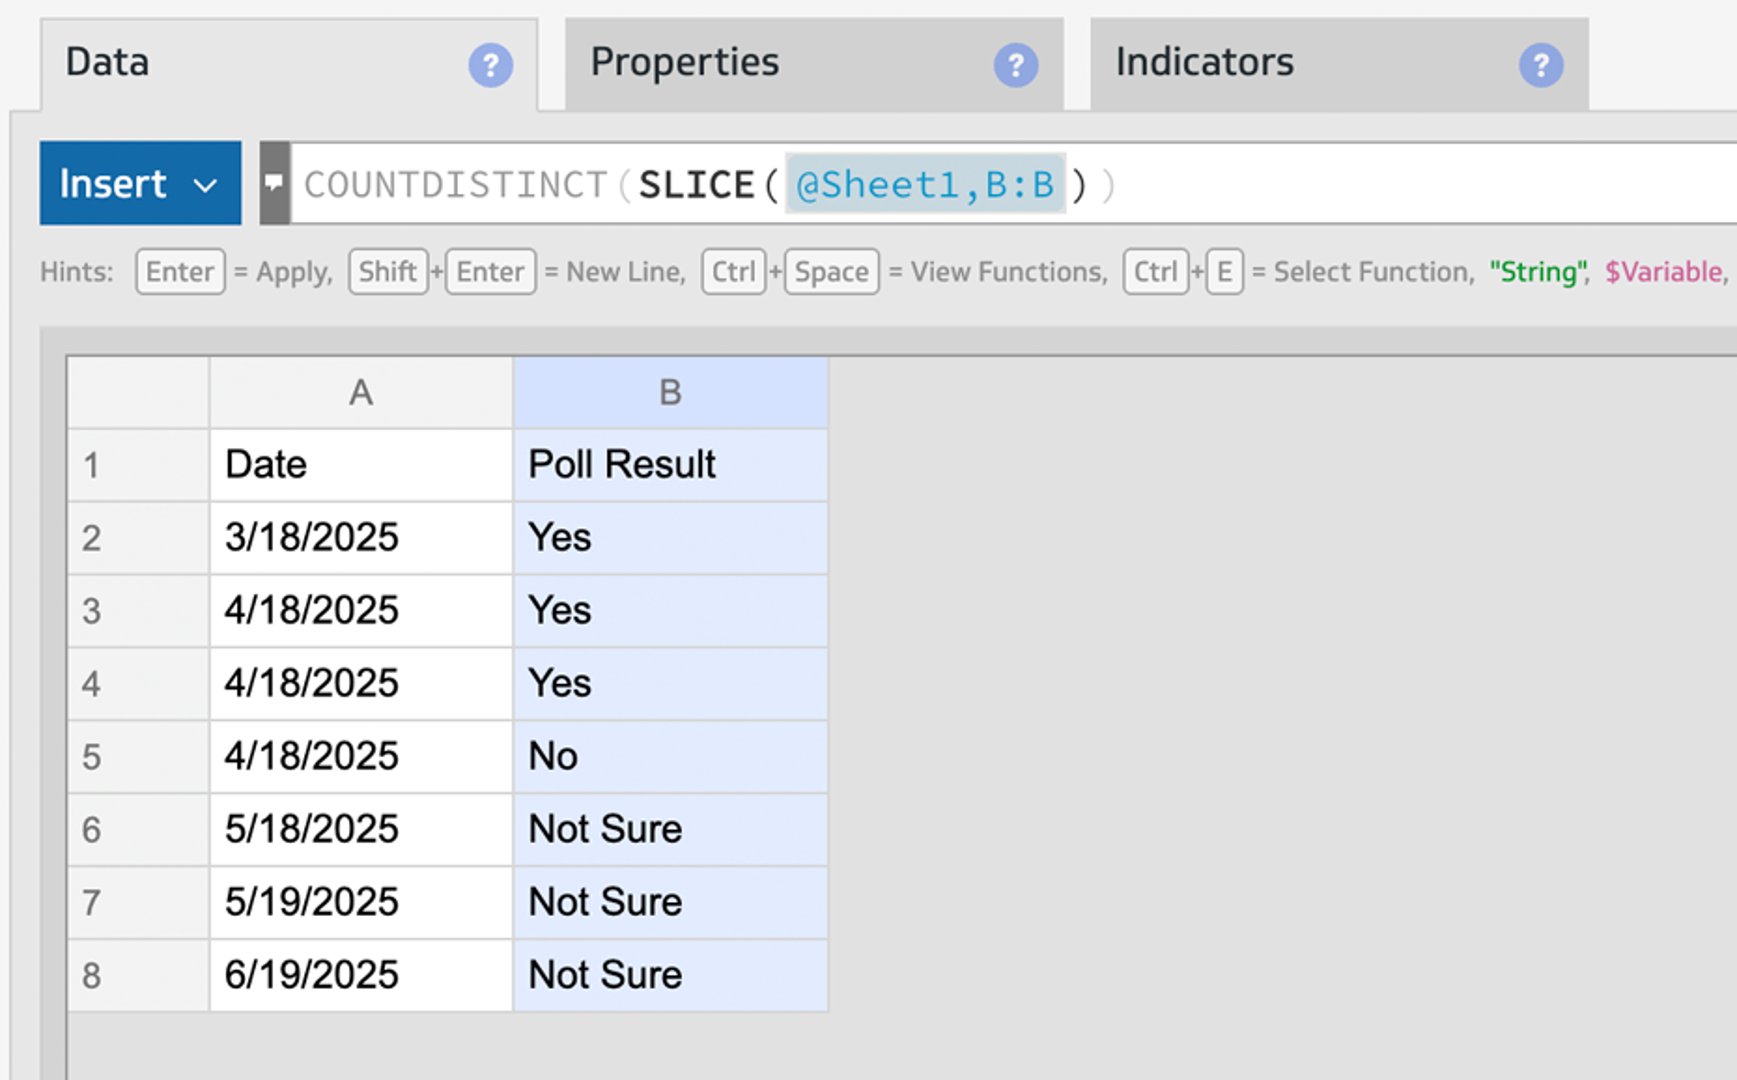
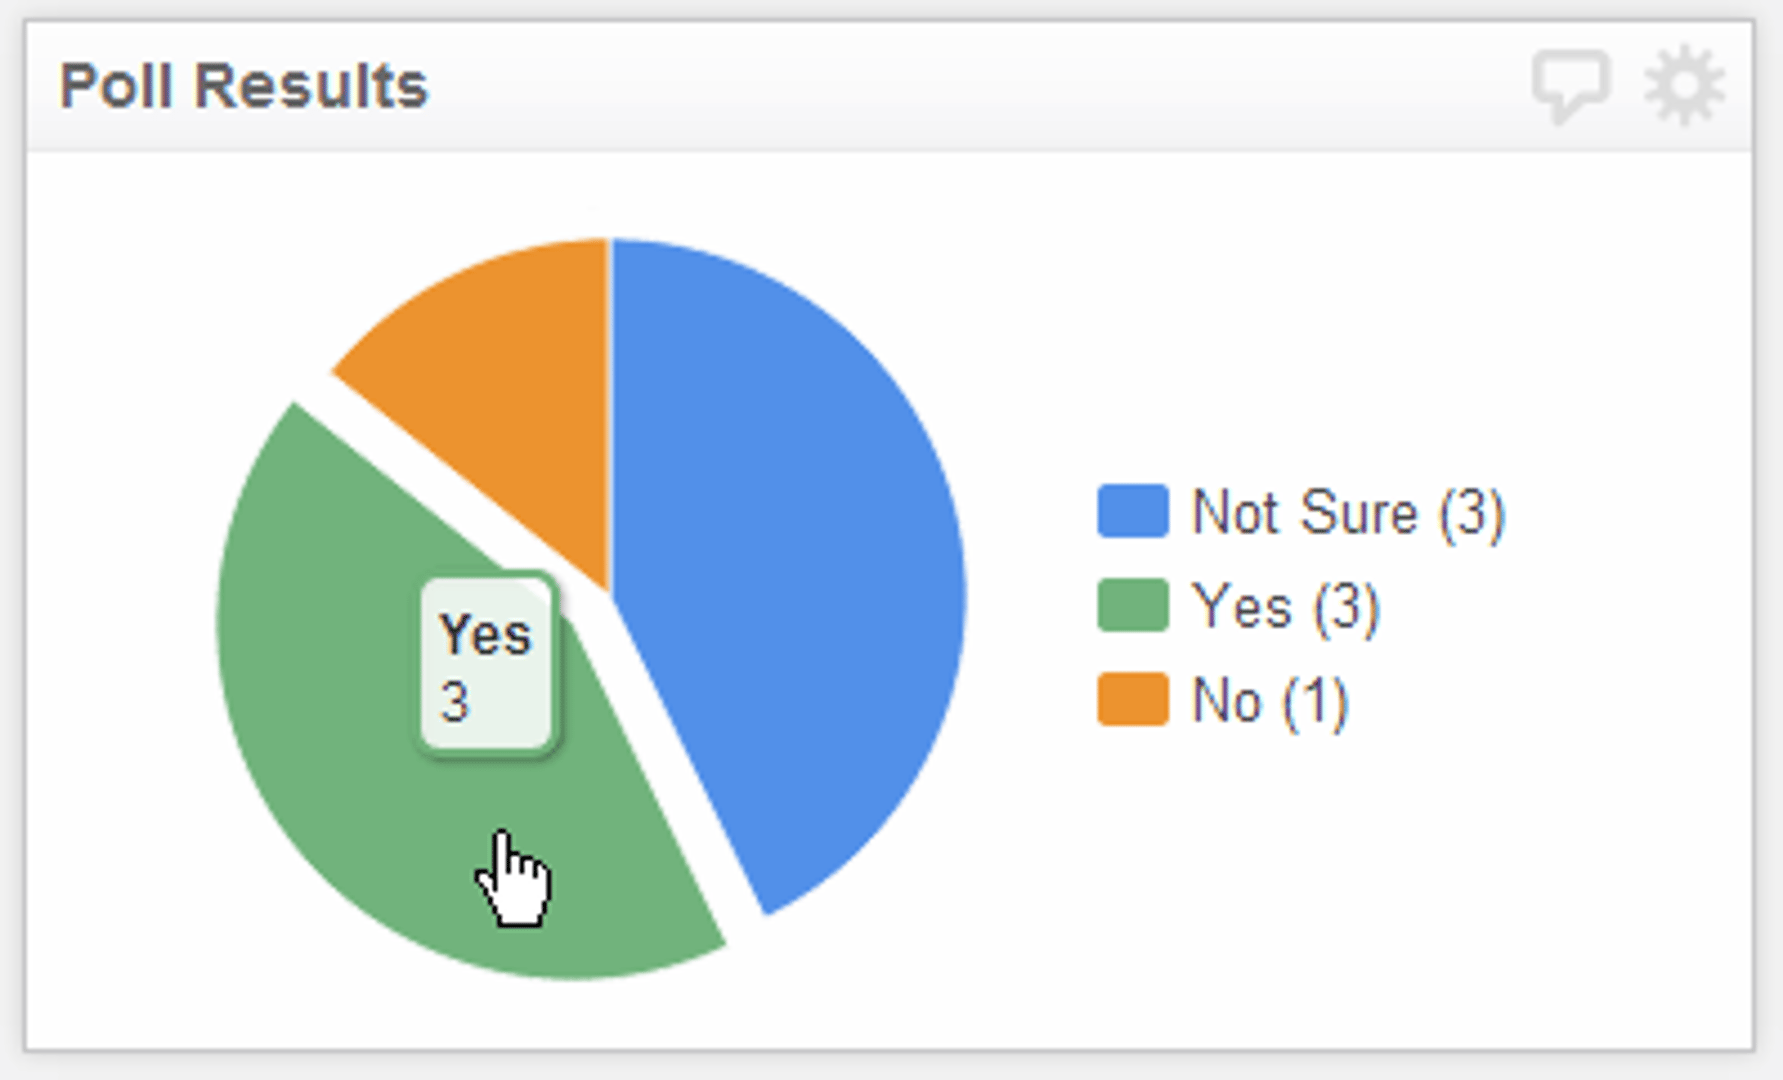
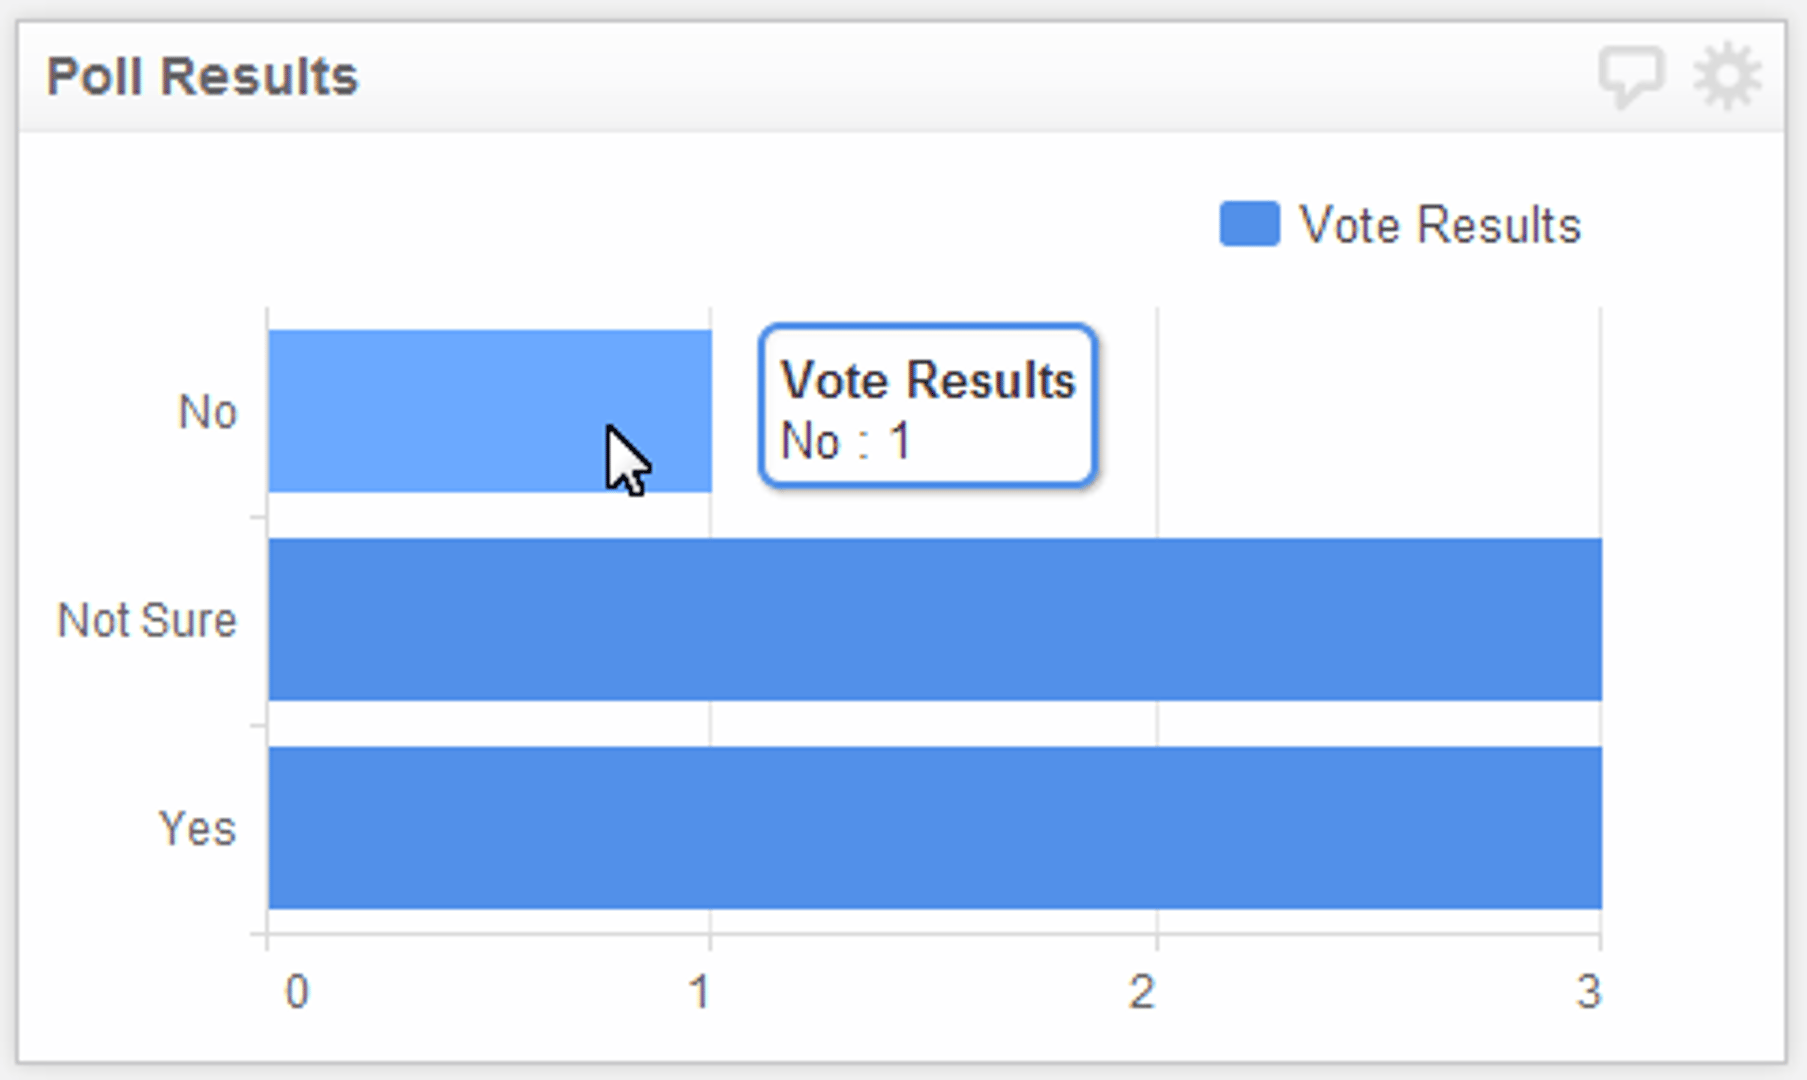
First, tally the values to get a total for each response. The CountDistinct function counts each unique value in a column or array. If you select column B:B, you'll see 3 Yes, 1 No, and 3 Not Sure votes. Notice that a Slice function is used within CountDistinct. By default, Slice removes the first value from your selection, meaning you don't have to worry about accidentally including the column header as a result in the pie chart.
Labelling the results
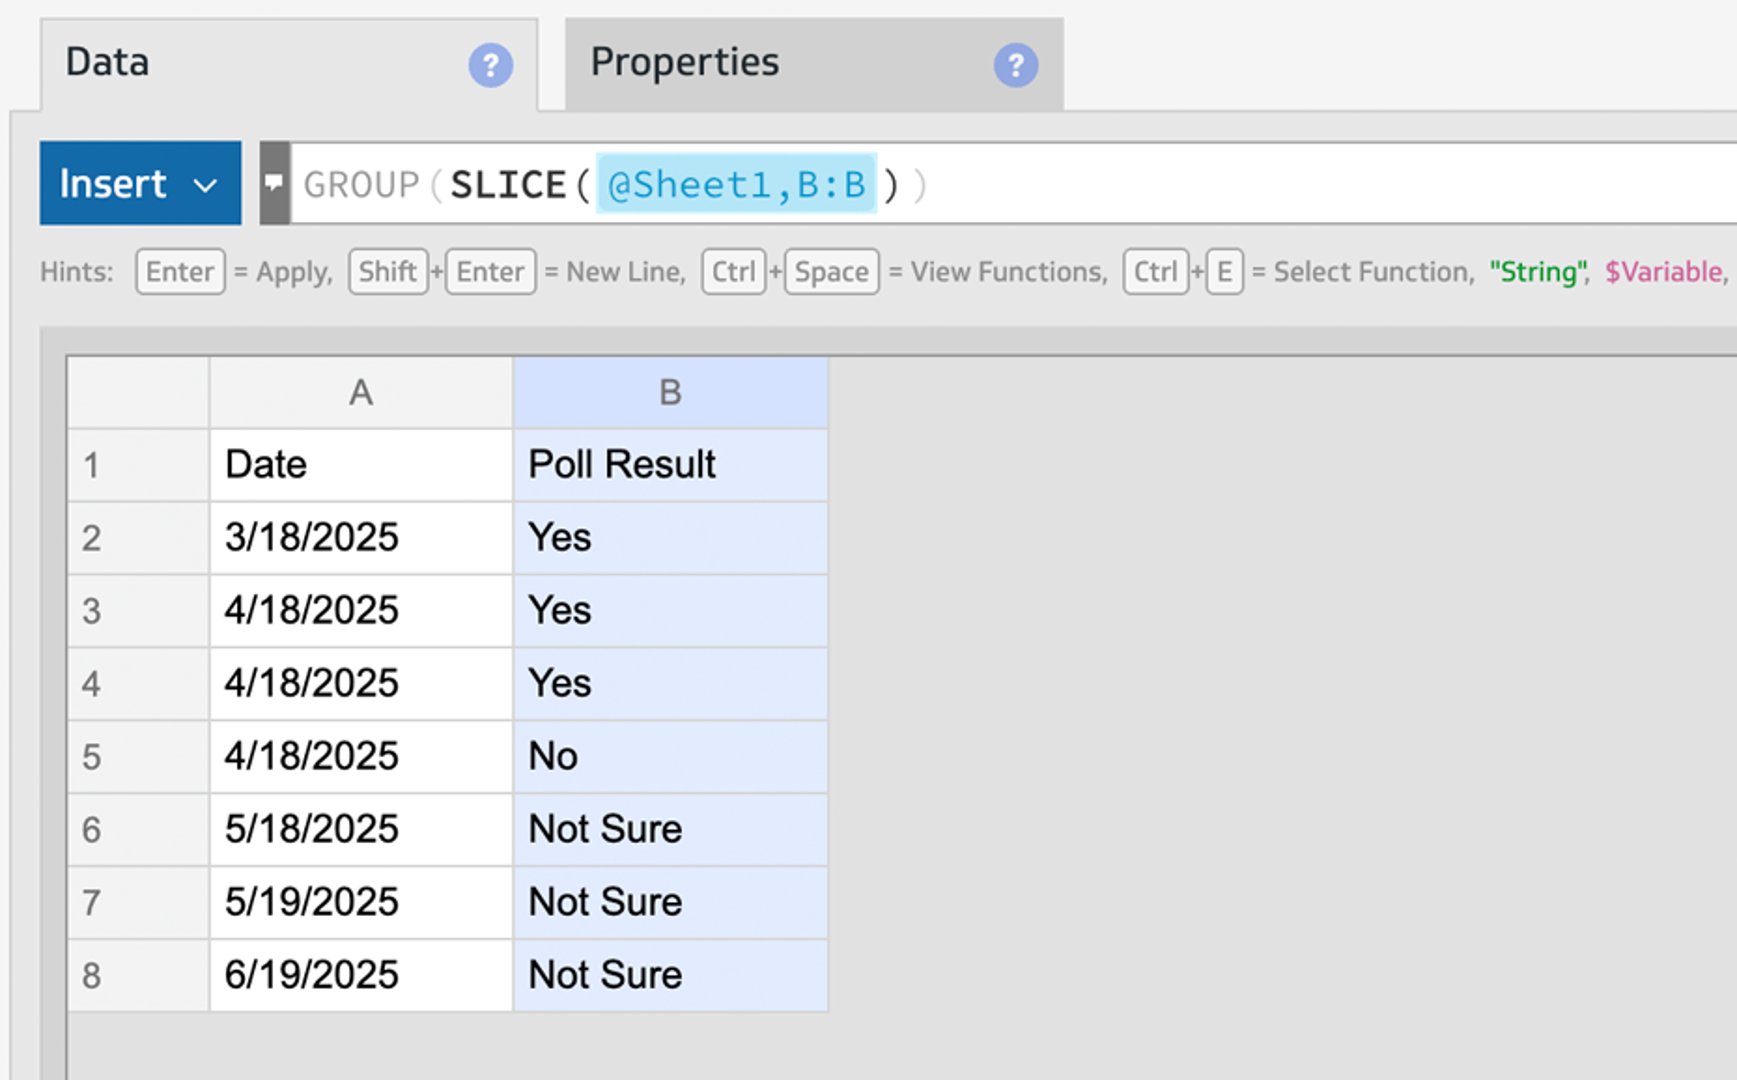
Next, label the results so the pie chart shows what each slice represents. The Group function eliminates duplicate values from a column and reduces a list of repeating elements to a single instance of each name. Since column B:B contains the response text, select that column. Again, use Slice to remove the column header from the chart.
The finished chart
The end result is a simple pie chart:
What if you don't want to use a Pie Chart?
This method works well with the bar/line chart component. To apply it in a bar or line chart, assign CountDistinct to the first series sub-component, then assign Group to the X Axis sub-component. Since this chart uses a single series, invert the X and Y axis in the Chart component's Properties tab.
Where will you encounter this type of data?
This pattern is common with survey tools such as Google Forms, SurveyMonkey, or Typeform, where each record is based on the unique identity of the person casting the vote rather than a pre-summarized total.
Need help with more functions available in Klipfolio Klips? Check out the Function Reference Guide here.
Published 2025-10-24





Most recent
- AUG 11Beyond simple sign-ups: how True Trials and Activation predict growth
- JUL 7Why business leaders miss important trends in their dashboards
- JUN 19The best chart for the job: Visualizing data for non-technical users
- JUN 95 tips to understand (and organize) your restaurant data
- MAY 26Think in Horizons, Not Seconds
- MAY 2010 Cloud BI Dashboard Tools for Small Businesses in 2026