

Can DevOps teams have a life in the age of cloud-based software?
Cloud-based software made 24/7 monitoring a permanent responsibility for DevOps teams. This post explains the three Vs of DevOps data, why manual monitoring fails, and how a connected dashboard gives teams the confidence to know what is happening, catch problems early, and get back to shipping.
Cloud-based software changed everything for development teams. When your product runs in a data centre instead of on a customer's machine, keeping it alive, fast, and improving around the clock becomes your team's permanent responsibility.
That shift gave rise to DevOps: a hybrid of development and operations working toward two goals at once.
What is DevOps?
DevOps is a combination of processes, infrastructure, automated scripts, configuration management, monitoring systems, and people working toward two primary goals:
- Keep the service operational and responsive 24/7
- Deliver features and fixes continuously to customers
The complexity involved is significant. Monitoring the data those systems produce is one of the main pillars of a successful DevOps team, and it's where most teams either find their footing or lose it.
The three Vs of DevOps monitoring
DevOps data fits the classic big data variety volume velocity framework. Each one adds pressure. Together, they make manual monitoring impossible.

Variety covers the full spectrum of what DevOps teams track. From hardware and system-level events to build readiness and production uptime, the range of data sources is wide and growing.
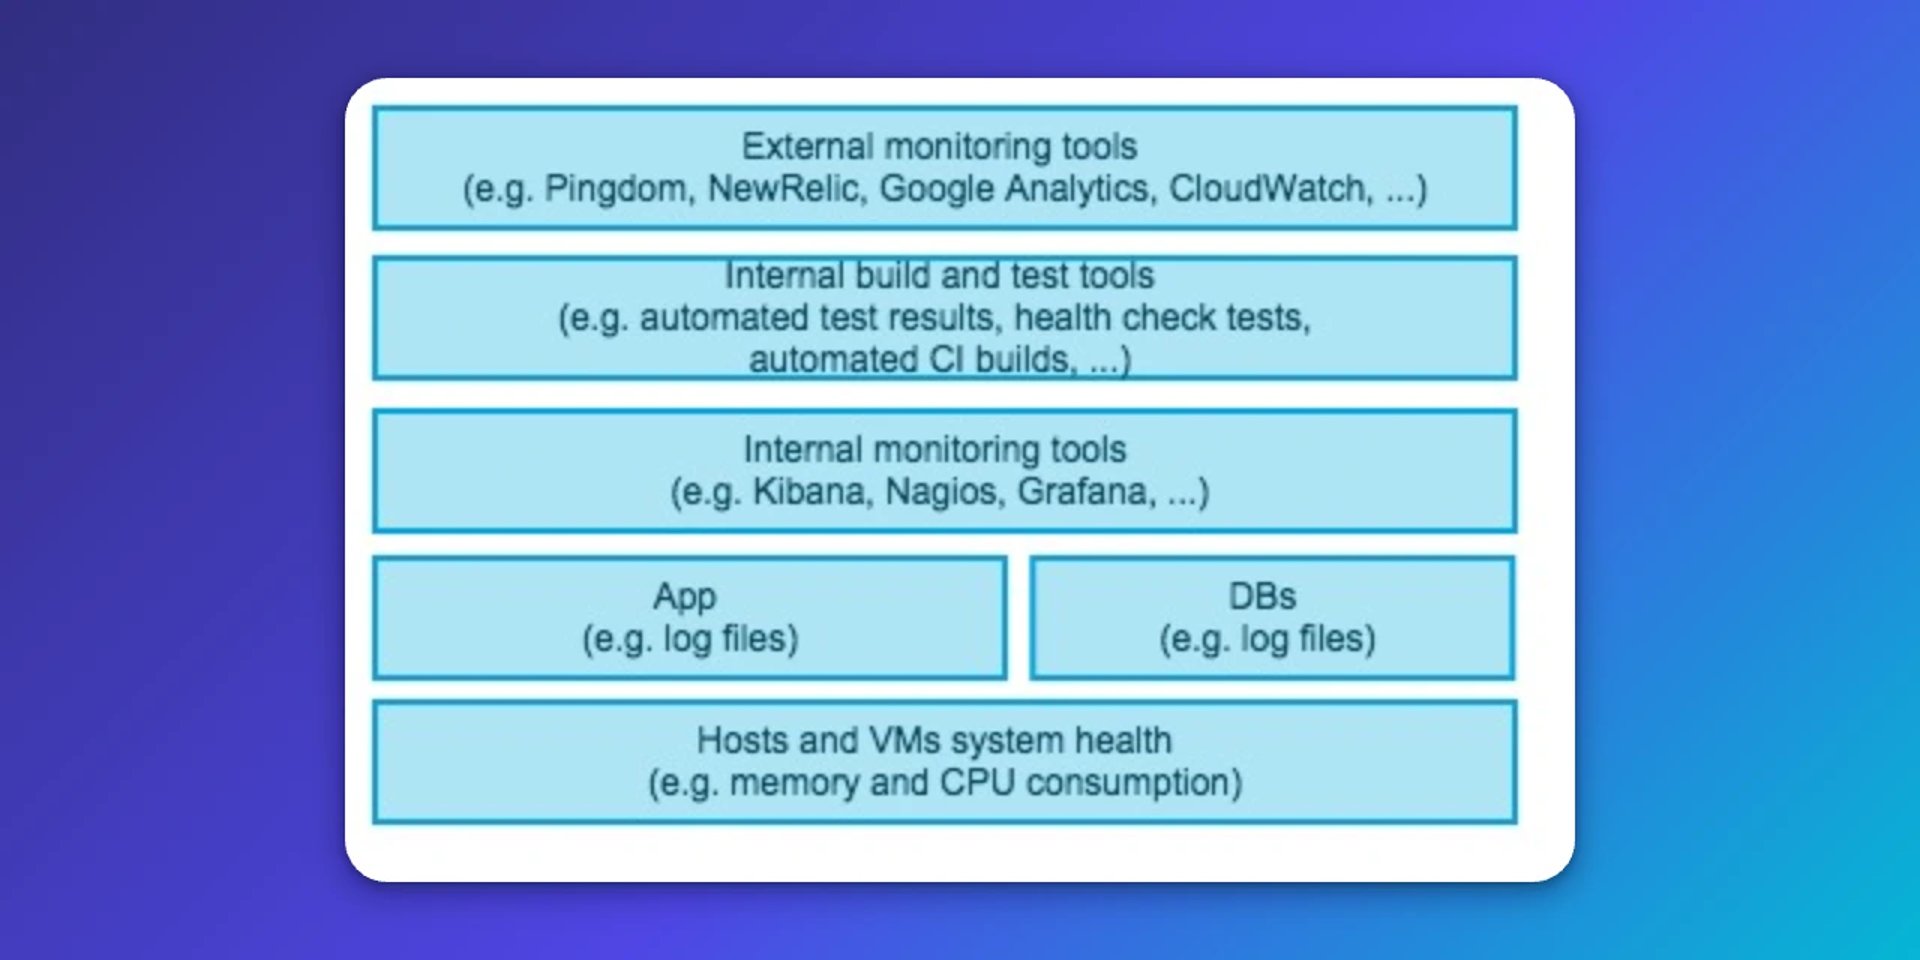
Volume compounds the variety problem fast. Add up every data point across multiple servers in multiple data centre locations, then multiply by thousands of active users, and you're looking at terabytes of data generated continuously.
Velocity means that data never stops. Cloud software running globally produces a constant stream, 24/7, with no natural pause.
As the business grows, all three Vs grow with it, often faster than the team does.
Why you can't watch it all yourself
No one can monitor that volume and variety of data manually. Waiting for someone to pull a number, pasting figures into a spreadsheet, or explaining your system's state from scratch every time something looks wrong doesn't scale.
The answer isn't more eyes on more screens. It's aggregation: pulling data from many sources, combining it into a coherent view, and surfacing what matters without requiring someone to go looking for it.
That's the shift from reactive monitoring to staying on top of things automatically.
How Klipfolio helps DevOps teams stay in control
Klipfolio is built around exactly this problem. It connects to a wide range of data sources, aggregates data from multiple sources, and presents it in a single dashboard your team can trust and act on without having to configure a new query every time.
The diagram below shows how Klipfolio fits into a typical DevOps environment.
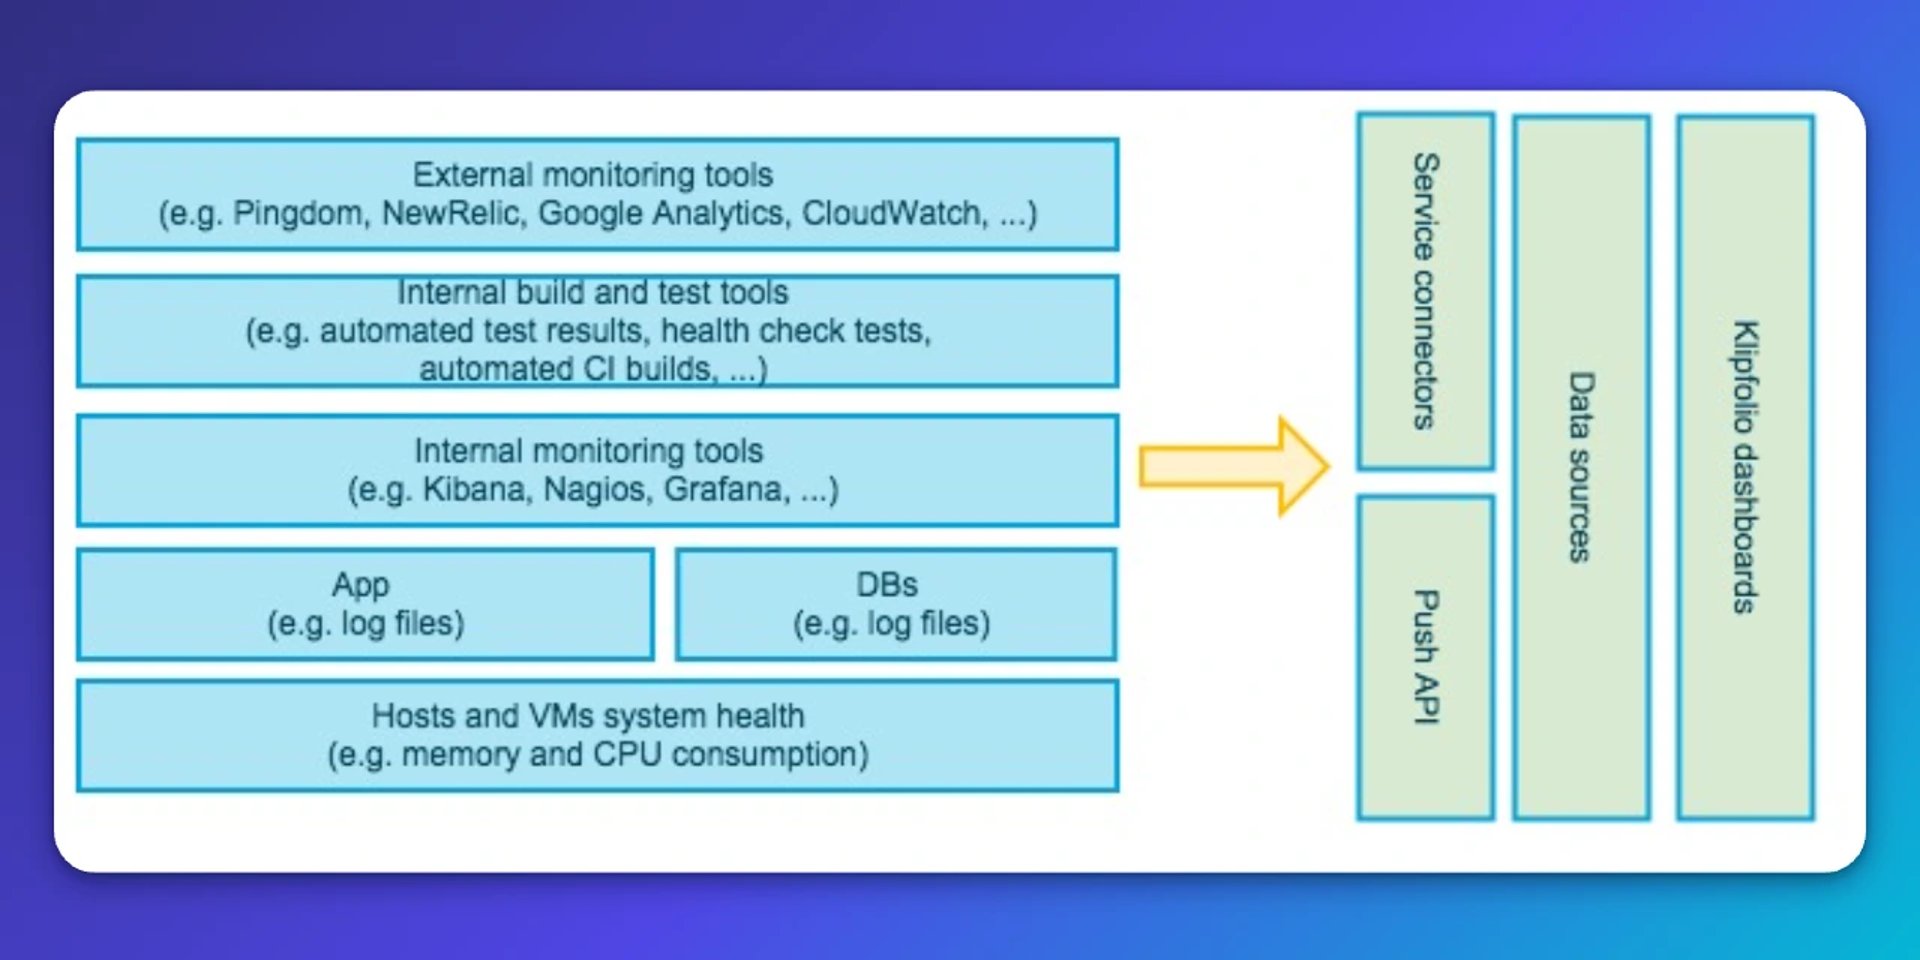
A few things worth knowing:
Ready-made connectors: Klipfolio includes connectors for services like Pingdom and New Relic, so you're not starting from scratch.
Web API connector: For any RESTful service without a dedicated connector, the generic Web API connector fills the gap.
Push API: If your systems produce custom data formats or sit behind a firewall, you can push data directly to Klipfolio without exposing internal infrastructure.
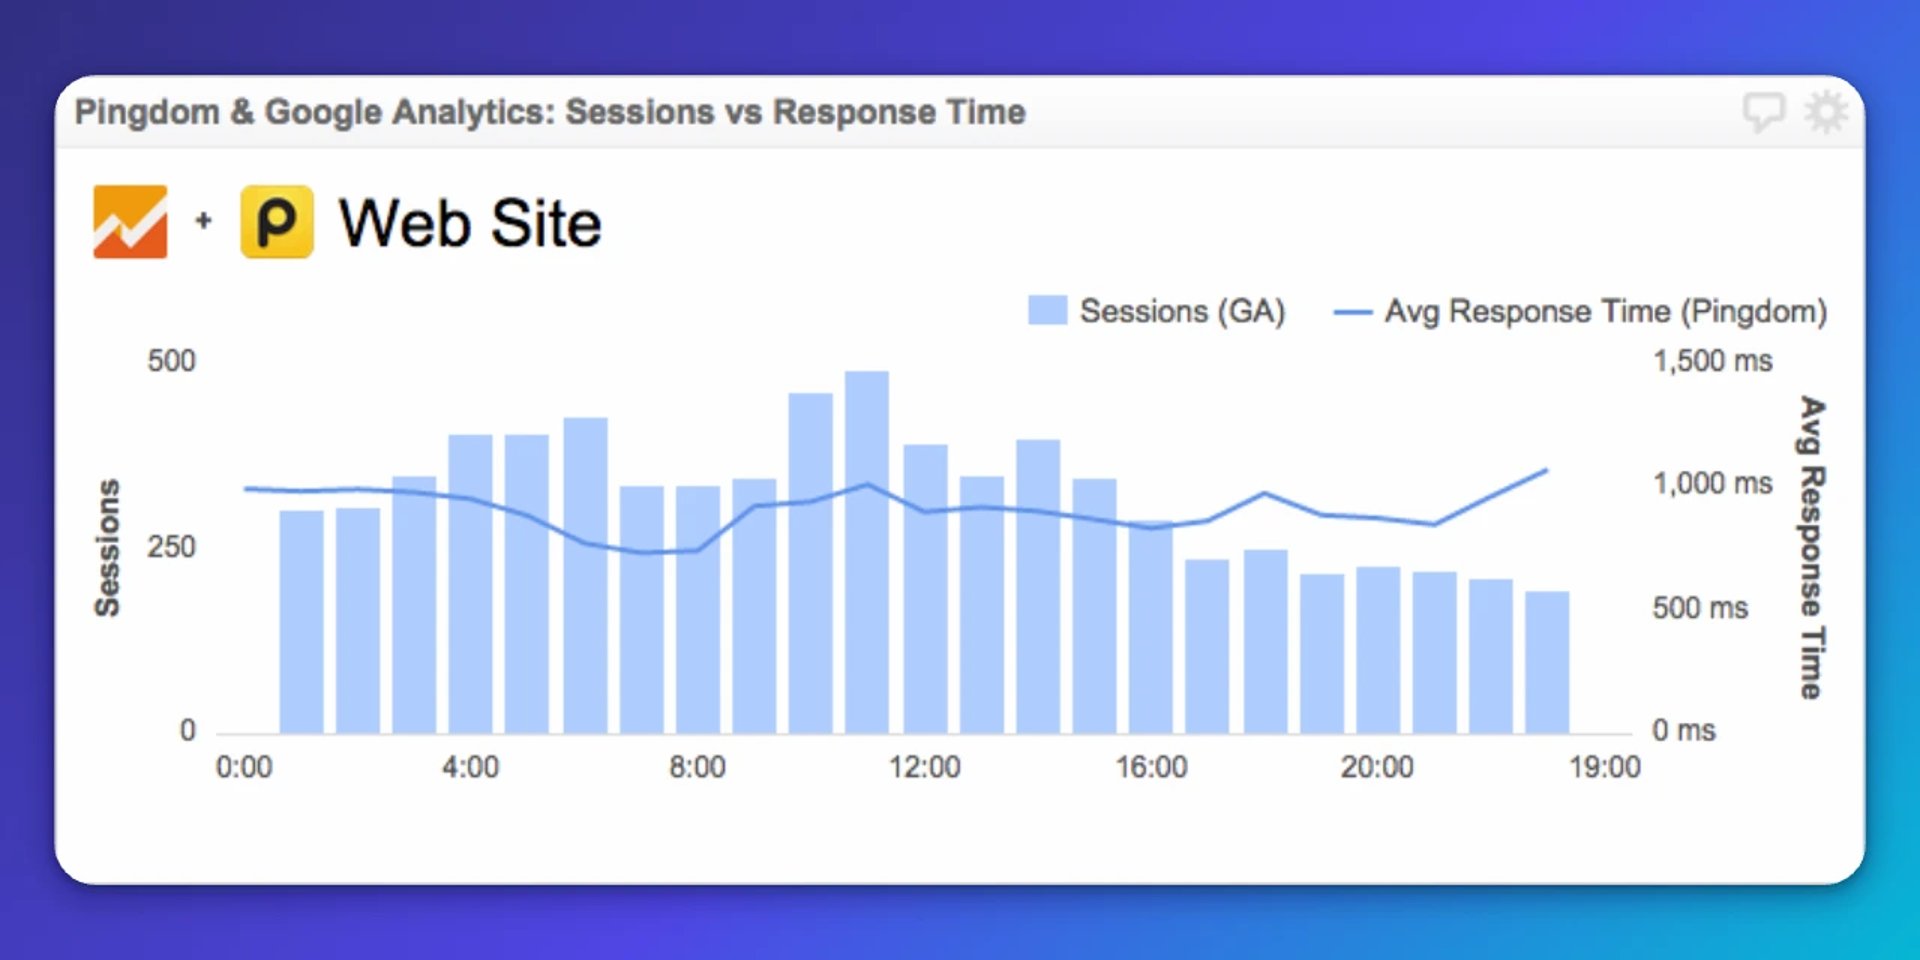
Data mashups: The visualization editor lets you combine data from multiple sources into a single Klip. You can, for example, overlay Pingdom response times with New Relic performance data and your own log files to see exactly how they correlate when something goes wrong.
The example below shows a Klip combining Google Analytics session data with Pingdom response times. When session volume spikes, you can see immediately whether response time is holding or degrading.
Check out our live Pingdom dashboard
Create custom dashboards for you and your team.
Get started with KlipsWhat this looks like in practice
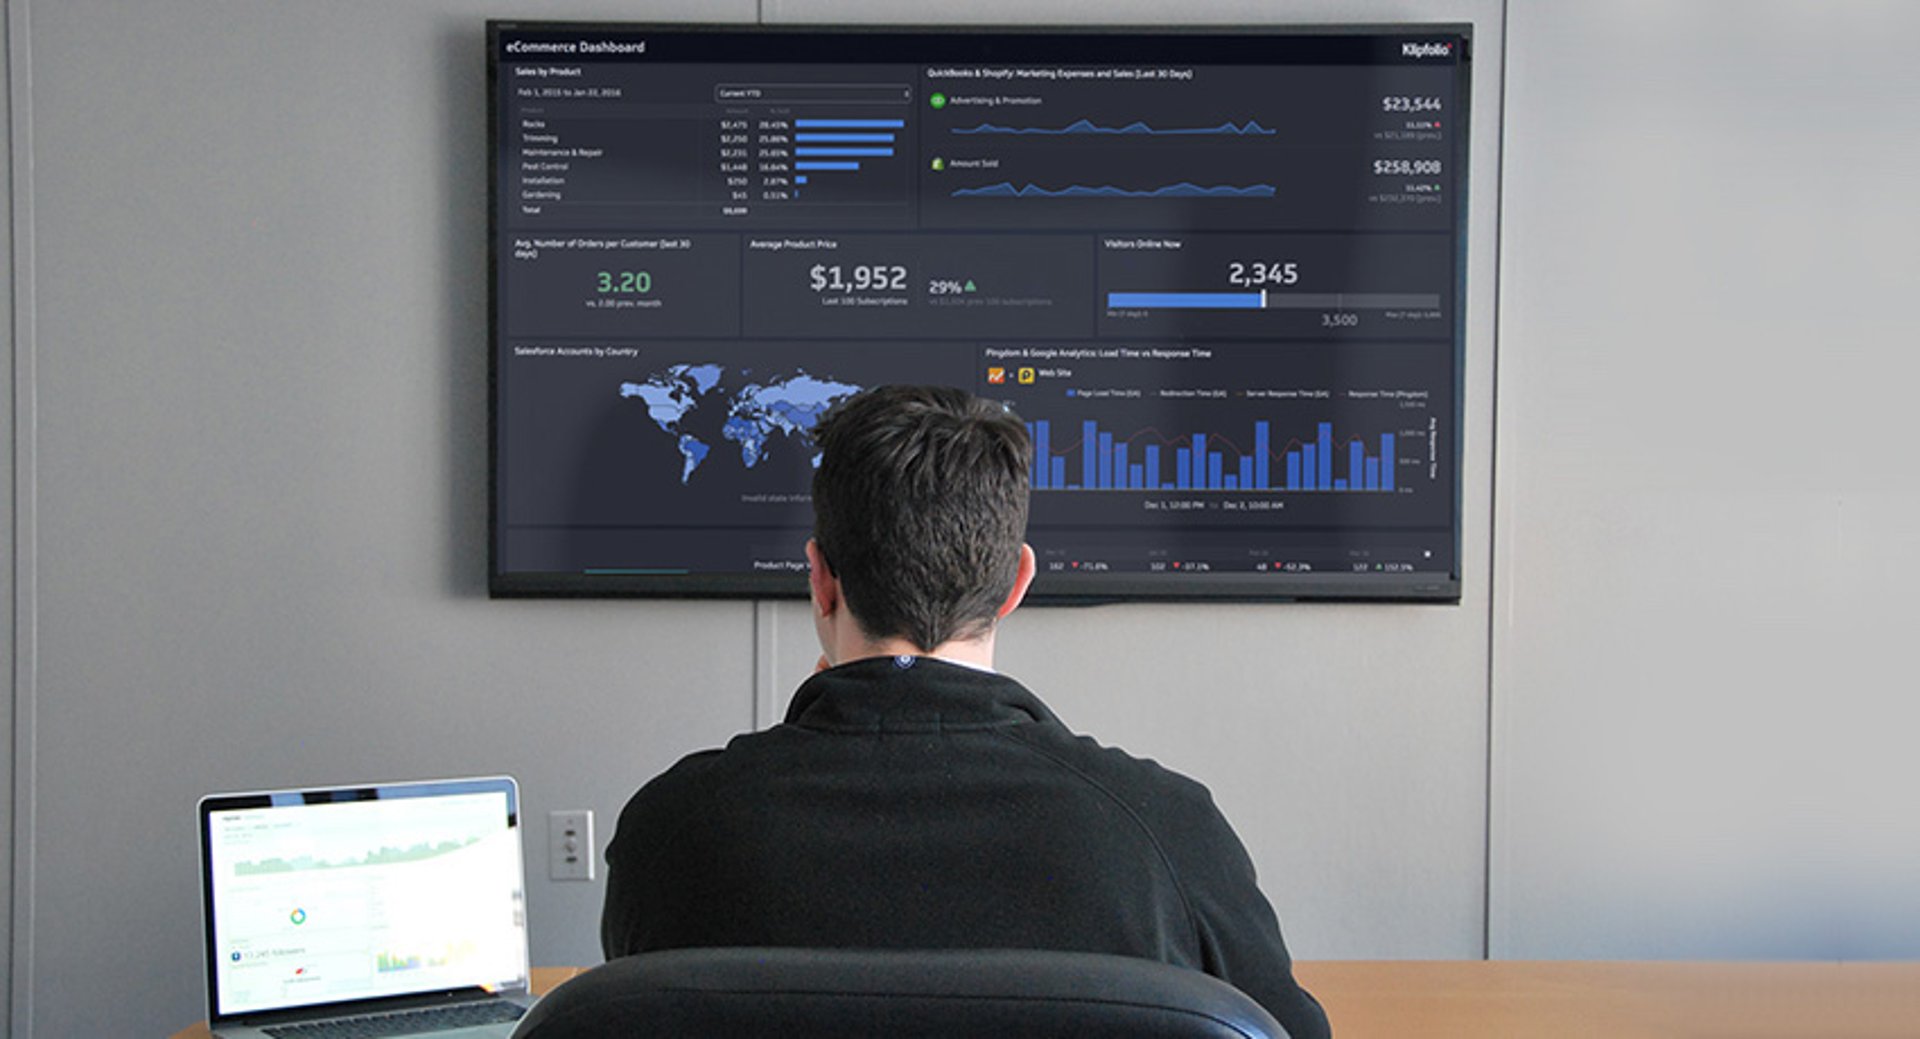
The Klipfolio dev team uses Klipfolio dashboards to monitor our own systems and processes, alongside services like Pingdom for SMS alerts and notifications. Our DevOps dashboard pulls the most important signals from external and internal services into one place.
That dashboard runs on a large TV as a wallboard in the office and is accessible on mobile for on-call situations. When something needs attention at 2 a.m., the team isn't piecing together a picture from five different tabs. The answer is already there.
That's what good monitoring actually delivers: not a more beautiful report, but the confidence to know what's happening, catch problems early, and get back to shipping.
Published 2026-08-21

Most recent
- AUG 11Beyond simple sign-ups: how True Trials and Activation predict growth
- JUL 7Why business leaders miss important trends in their dashboards
- JUN 19The best chart for the job: Visualizing data for non-technical users
- JUN 95 tips to understand (and organize) your restaurant data
- MAY 26Think in Horizons, Not Seconds
- MAY 2010 Cloud BI Dashboard Tools for Small Businesses in 2026