

How journalists use dashboards to research, visualise, and share data stories
Dashboard journalism uses dashboards to help reporters uncover trends, reveal patterns, and identify facts. Learn how to conduct research, present findings to readers, and track internal metrics using data visualizations.

Journalism is changing. Reporters once wore numerical illiteracy as a badge of honour. Now they're building pivot tables and mapping out spreadsheets. Data plays an increasingly central role in uncovering public interest stories that would otherwise stay hidden.
Dashboards are the natural next step. Dashboard journalism helps news outlets conduct research, present findings to readers, and track internal metrics. While dashboards aren't yet as iconic as the pencil and notepad, they give data-driven journalists something no spreadsheet or AI summary can: a live, reliable picture of what's actually happening, without having to ask someone to pull the numbers.
What is dashboard journalism?
Dashboard journalism is the practice of using dashboards to help reporters uncover trends, reveal patterns, and identify facts that might otherwise remain hidden. It borrows what makes business dashboards effective: real-time updates, at-a-glance key metrics, and combined datasets that surface what matters.
The key difference lies in purpose. Business dashboards help companies make decisions. Dashboard journalism helps reporters find and report the truth.
Dashboards let journalists build visualizations from their data that update in real time. They provide a single source of truth for the indicators that matter most, presented in a way that captures attention and builds confidence in the numbers.
The rise of data journalism
Numbers are foundational to quality journalism. Data journalism has grown into a discipline that powers some of the most important investigations of our time. Outlets worldwide now centre their reporting on rigorous analysis and visualization.
The Globe and Mail's Unfounded series is a powerful example. Reporters analysed data from 870 Canadian police forces and revealed that police dismiss one in five sexual assault cases without merit. The investigation exposed systemic flaws in how police investigate sexual assault. Without data, this story wouldn't have been possible.
Dashboards are a key tool for analysing and interpreting that kind of data. Their role in modern journalism follows naturally.
Why journalists should use dashboards
Assist with data-driven reporting
Some stories centre on numbers. Others use data to enrich readers' understanding of a subject. Nearly all newsrooms now use data strategically to identify reader preferences and develop new content formats. Dashboards make this process faster and more transparent, and they keep everyone working from the same set of verified numbers rather than pasting figures into a spreadsheet and hoping nothing drifted.
Show numbers visually
"Show, don't tell" is a mantra repeated in journalism schools worldwide, and for good reason. Showing readers is far more powerful than telling them.
Saying a politician is "eccentric" is one thing. Saying they own 50,000 hats, welcome criminals into their office, and believe doors should be illegal is another. The same principle applies to data.
A spreadsheet of numbers tells a weak story. Visualizations, including charts, graphs, and maps, tell a compelling one. Dashboards make creating these visualizations fast and intuitive.
Stand out from the crowd
Data dashboards are mainstream in business. Marketers, analysts, and executives rely on them for at-a-glance performance updates. In journalism, dashboards remain rare. That's an opportunity for news outlets to differentiate themselves, not just from other newsrooms, but from the wave of AI-generated summaries that flatten data into bullet points without context or accountability.
How journalists can use dashboards
Create custom dashboards for you and your team.
Get started with KlipsConduct research
Identifying trends and spotting outliers are core to quality investigations. A dashboard helps you focus on what matters most without waiting for someone else to pull the numbers.
Imagine investigating how local councillors spend taxpayer budgets. A well-designed dashboard could highlight which councillors spend the most. A horizontal bar chart tracking yearly spending per councillor makes patterns obvious at a glance.
Dashboards also help reporters stay on top of their beats. A political reporter might track government spending announcements in real time, seeing which programs receive the most funding. Even without a major scoop, this builds valuable context and background.
Team investigations benefit even more. A shared dashboard sends all data to one place, updates in real time, and keeps everyone aligned. No confusion about which numbers are current. Everyone works from the same source.
Present findings to readers
Visual storytelling is essential to good journalism. Dashboards excel here. They transform raw numbers into charts, graphs, and maps that help readers understand how data fits your narrative.
Many dashboard tools offer multiple presentation formats. You can publish standalone web links or embed dashboards directly on web pages. This flexibility lets you present data in the format your readers prefer, and it gives readers something to explore rather than just read.
Report on internal metrics
Modern newsrooms care about more than great stories. They also need to stand out in a crowded digital landscape, which means tracking what's working and what isn't.
A dashboard helps track key performance metrics. A digital editor might monitor which content gets the most read time and which posts drive the most traffic. This insight guides editorial strategy and helps newsrooms make confident decisions about what to publish next, without guessing or waiting for a weekly report.
Getting started in dashboard journalism
Many dashboards have a learning curve, but the right tool gets you up and running quickly.
Step one: Build your datasets
Datasets are the foundation of dashboard journalism. Fortunately, there are more ways than ever to find, sort, and segment data.
Access to information legislation at any government level is an excellent source. Many governments now publish datasets online regularly. But don't stop there.
The New York Times' Follower Factory investigation is a strong example. Reporters analysed data to show how celebrities, media figures, and athletes benefit from fake followers on social media. It demonstrates how ambitious journalists can source and build datasets from public information.
Step two: Choose a dashboard tool
Many dashboard providers exist, each with different strengths. Consider these factors when evaluating tools:
- Price: Dashboard tools range from free to hundreds of dollars monthly. Find one that fits your budget and delivers the features you need.
- Data connectivity: Pulling data into your dashboard is half the battle. If the tool doesn't connect easily to your data sources, you'll need expert help. Choose a tool with straightforward data connections.
- Multi-platform sharing: Presenting information to readers in accessible formats is essential. Make sure your tool supports sharing across websites, emails, and other platforms.
- Visualisation capabilities: You need to turn data into compelling visuals, including charts, maps, and infographics. This is the whole point of dashboard journalism.
- Learning curve: Some tools are intuitive; others require developer support. If this is your first dashboard project, find something easy to learn but powerful enough to customise when needed.
Step three: Start building
Many modern reporters are as skilled at sourcing and sorting data as they are at writing a strong opening. That puts you in a good position to start building dashboards.
Skills from data manipulation transfer directly to dashboarding. Klips, for example, lets you apply the same spreadsheet skills you've already built in Excel, including formulas, calculations, and data transformations, to build dynamic dashboards that update automatically.
Visualisation is the other half of the equation. Think about how you'll present information. Would a chart work here? A map? An infographic? Consider the layout too. What should readers see first? Which metrics deserve emphasis? These decisions shape how your dashboard tells the story.
Step four: Distribute your dashboard
Several options exist for sharing dashboards. Embedding dashboards on your website and publishing PDF snapshots are essential for reader distribution. A TV dashboard works well for displaying internal metrics to newsroom staff. Email is excellent for team sharing.
For investigative projects, dashboards keep you focused. Tracking key metrics over weeks or months helps maintain momentum on longer stories, and it means you're never starting from scratch when an editor asks where things stand.
Create custom dashboards for you and your team.
Get started with KlipsDashboard journalism is already here
From tracking government spending to visualising social trends, reporters worldwide are using dashboards to uncover stories and present data in ways that matter to readers. The tools exist. The techniques are learnable.
The question isn't whether dashboards belong in the newsroom. It's whether your newsroom will use them before your competitors do.
Published 2026-08-24
More in Dashboards

6 dashboards I use daily to run my SaaS company

Klipfolio Partner How-To #1: Duplicating dashboards across client accounts

Klipfolio Partner How-To #2: Company Properties can simplify client set-up

The ultimate guide to SaaS KPIs and metrics

The starter guide to dashboard design
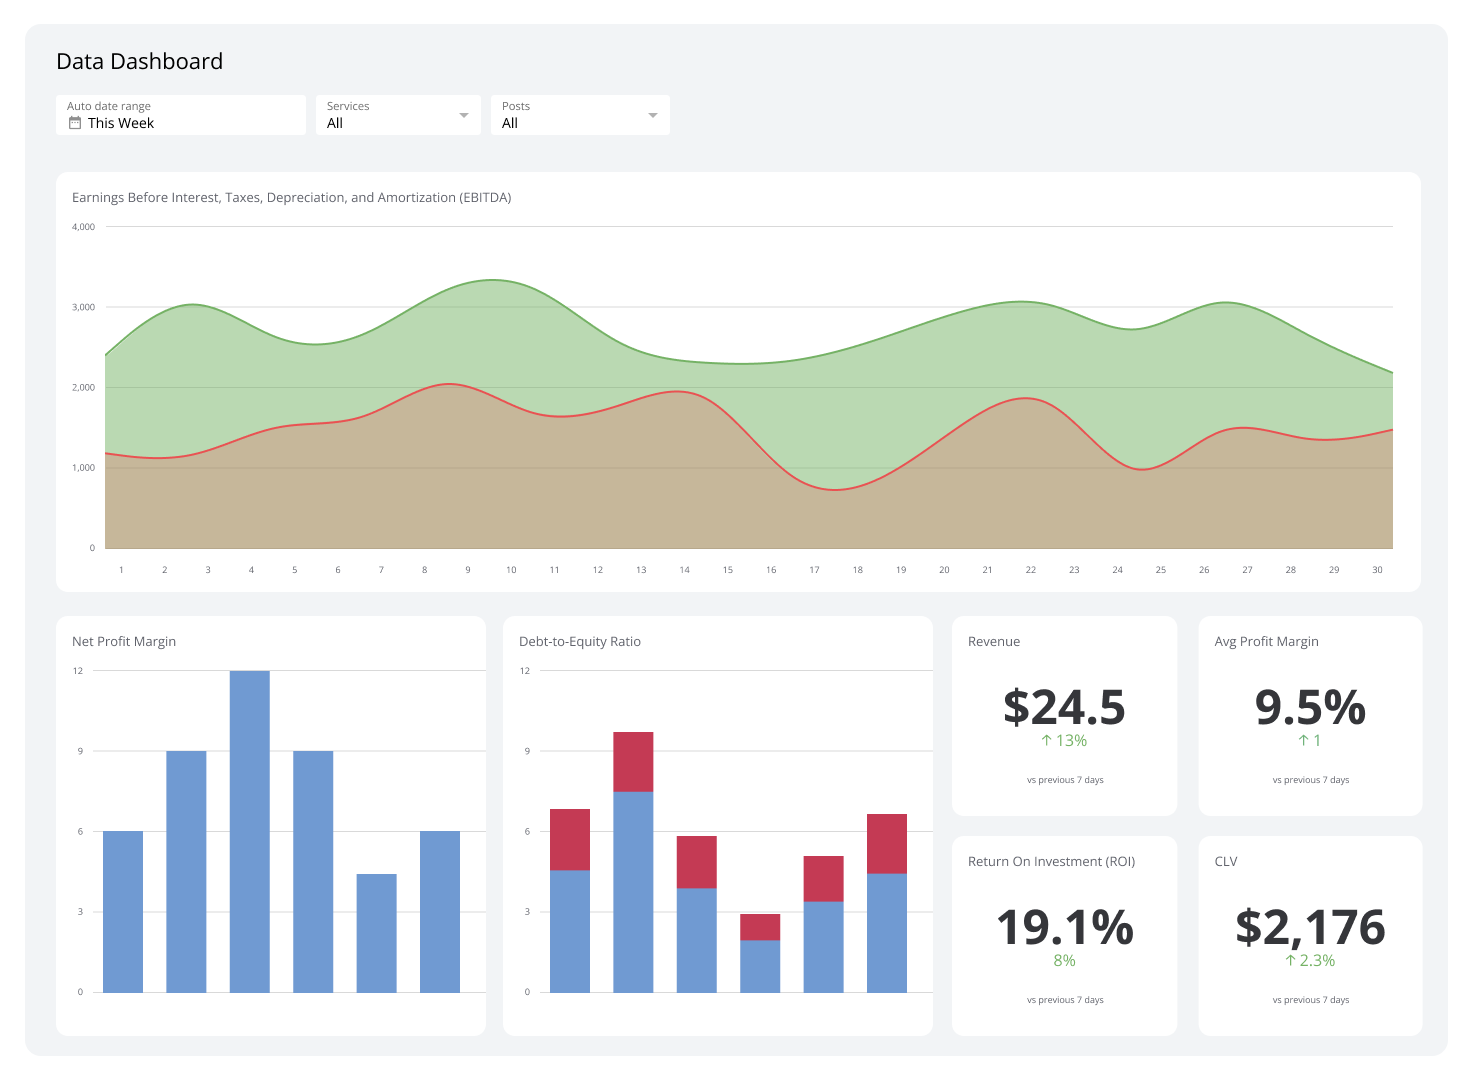
What is a data dashboard?
Most recent
- AUG 11Beyond simple sign-ups: how True Trials and Activation predict growth
- JUL 7Why business leaders miss important trends in their dashboards
- JUN 19The best chart for the job: Visualizing data for non-technical users
- JUN 95 tips to understand (and organize) your restaurant data
- MAY 26Think in Horizons, Not Seconds
- MAY 2010 Cloud BI Dashboard Tools for Small Businesses in 2026