

How we automated reporting for 50+ clients
Parcero is a leading marketing agency that turned to Klipfolio Klips to automate client reporting and save hours of manual work.

Case: Parcero Marketing Agency
Automation frees agency teams from repetitive work so they can focus on what actually moves client results: interpreting data and improving campaigns.
The three report types every agency manages
Not all reports are created equal, and not all of them can be automated the same way.
Ad-hoc analyses: Used to improve week-to-week ad campaigns. Data collection can be automated; interpretation cannot.
Summary reports: Monthly summaries of marketing efforts. Full automation is achievable here.
Insight reports: Information that supports strategic decisions, such as yearly marketing reviews and channel performance reports. Data collection can be automated; interpretation cannot.
Ad-hoc analyses are created on demand and tend to vary, which makes them harder to automate. Summary reports, such as campaign reports or monthly channel performance reports, are the clearest win for automation. Insight reports are also created on demand but serve longer planning cycles.
Real-time dashboards and static PDF reports serve different purposes. In digital marketing, clients increasingly expect both. Real-time dashboards let agencies and clients track campaign performance daily and catch issues before they compound.
Why Parcero selected Klipfolio Klips
Klipfolio Klips dashboard and reporting software is built for situations where data is spread across many sources, channels, and campaigns, each with different monitoring needs.
Parcero evaluated three tools: Tableau, Klipfolio Klips, and Looker Studio. The team scored each against 12 criteria.
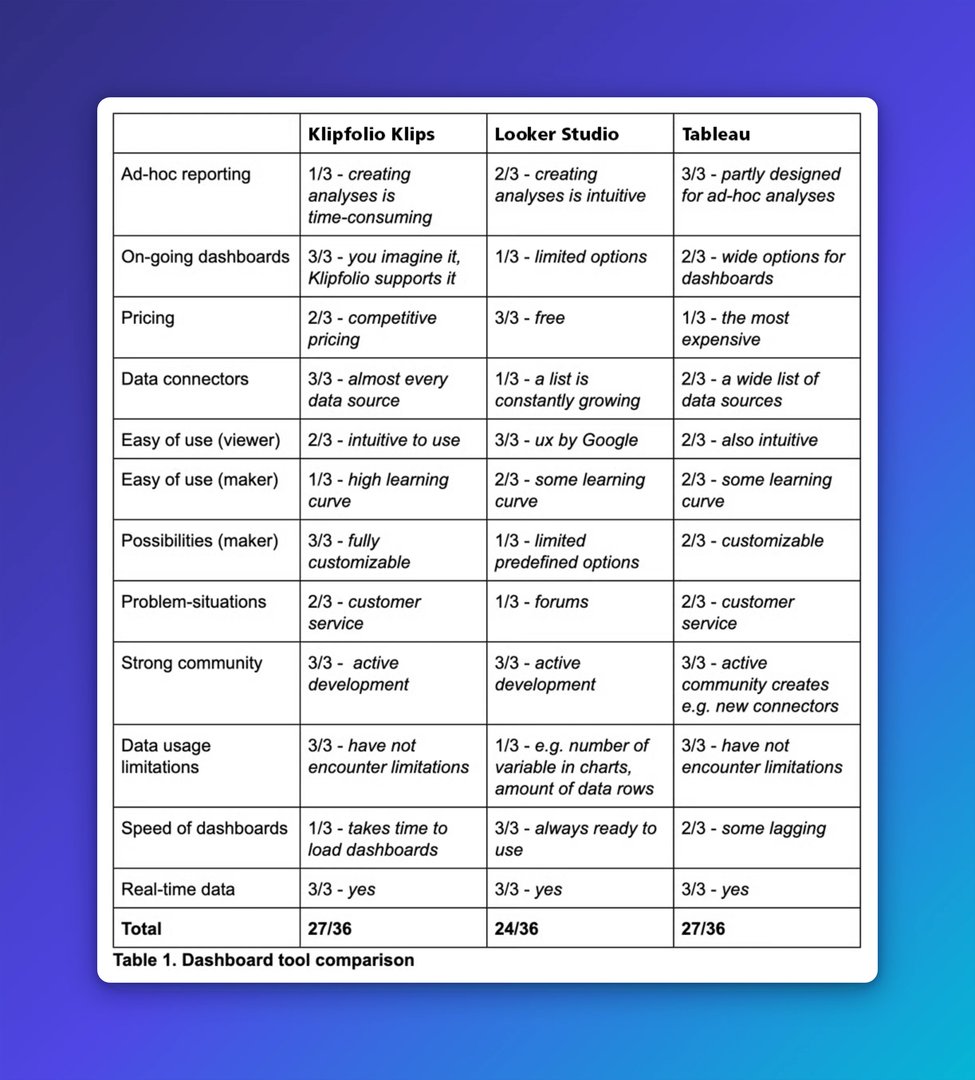
The results were close. The deciding factor was the ability to build ongoing reporting dashboards for multiple clients, fully customized when a client had specific requirements. Klipfolio Klips matched that need.
Why Google Analytics alone wasn't enough
Several Parcero clients focused on building a social media presence. Google Analytics alone wasn't designed for that. A few other gaps stood out:
Not every client has a website. Some clients prioritize social presence over web traffic entirely.
Attribution models differ. Google Analytics supports click attribution only. Built-in social media analytics also support view attribution, and sometimes viewing an ad matters as much as clicking it (read more about click vs. view attribution).
Data ownership is limited. Google Analytics samples data, which means you don't own the clickstream data that enables deeper analysis (read more about clickstream data).
Different clients need different views. Klipfolio Klips gave Parcero one platform to build fully customized dashboards based on each client's goals, rather than pasting numbers into a spreadsheet or explaining context from scratch every time a report was due.
Create custom dashboards for you and your team.
Get started with KlipsAdvantage #1: Client-specific metrics
A crucial first step in any reporting project is choosing the right metrics. A reliable rule of thumb for key performance indicators (KPIs): if a change in the metric doesn't trigger a specific action, it probably doesn't belong on the dashboard.
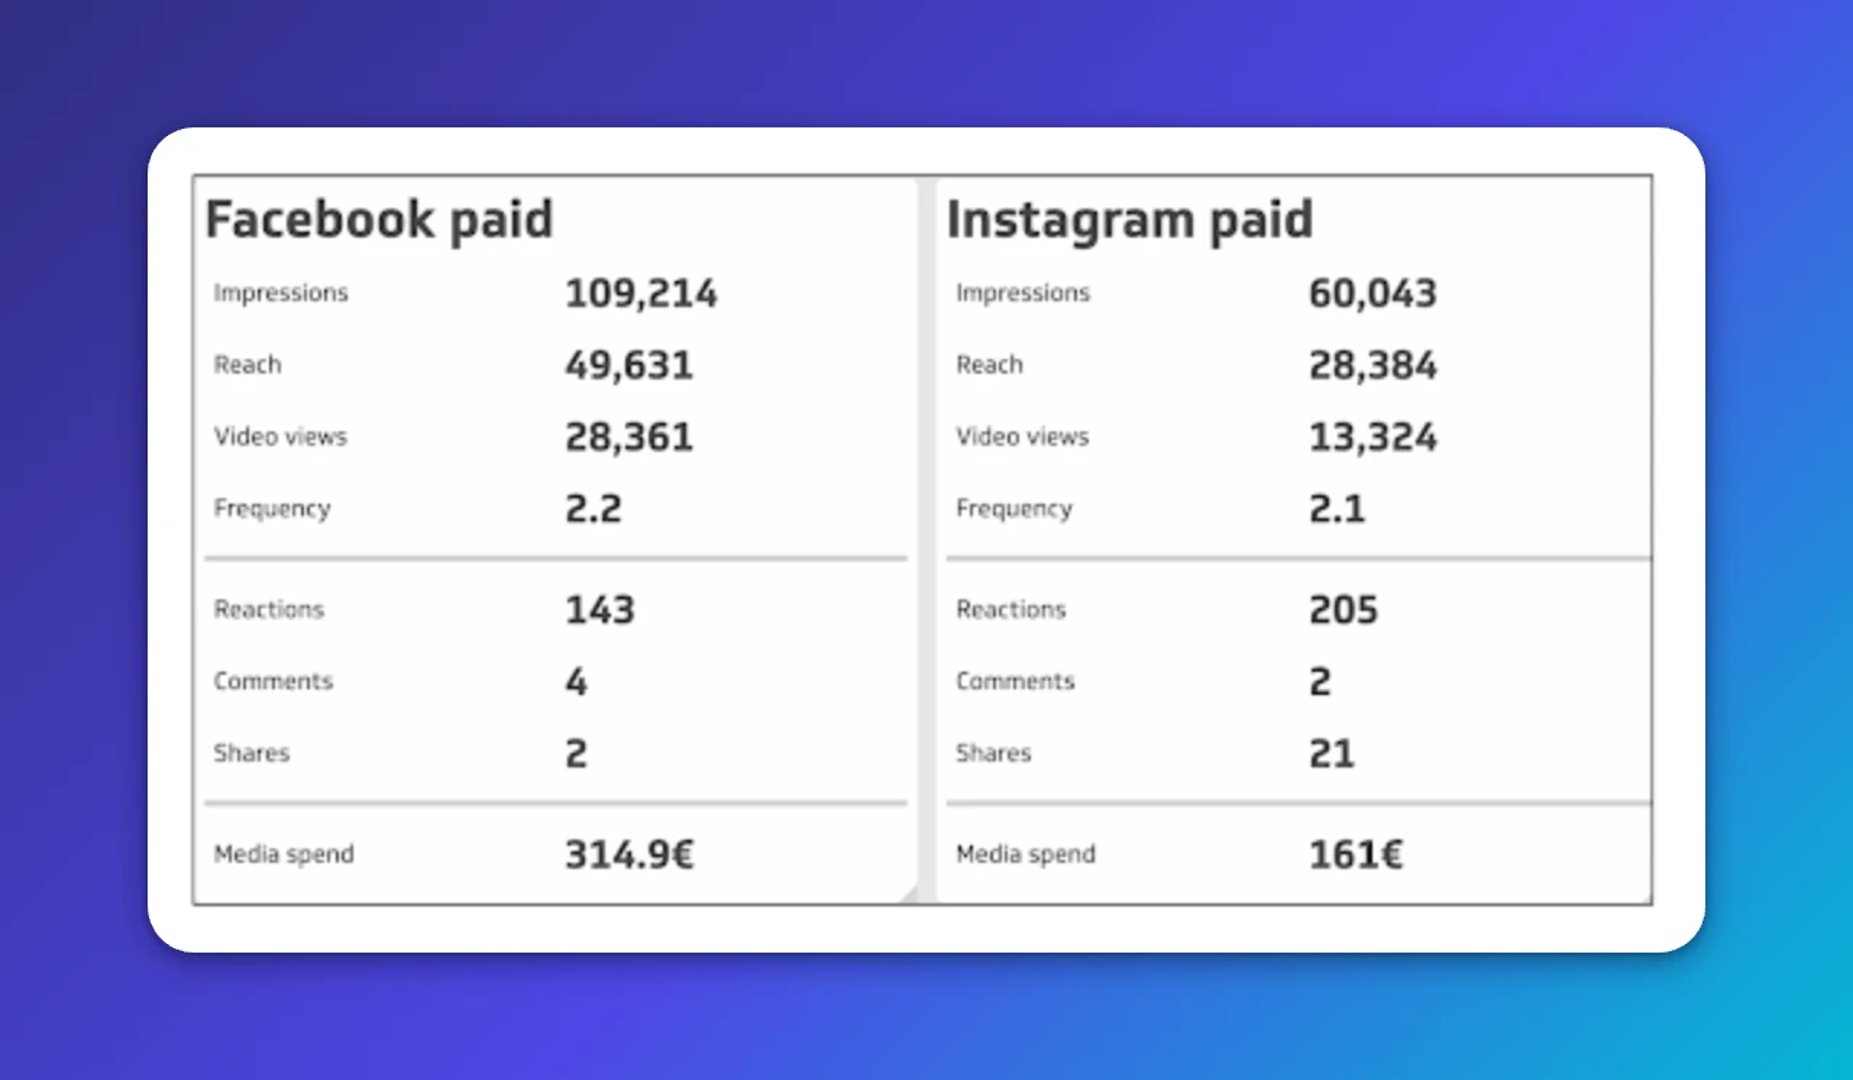
When reporting spans multiple marketing channels, cross-channel metrics, such as impressions, CPM, clicks, CPC, CTR, and spend, let you compare performance between channels in one view. That comparison is where the decisions happen.
Advantage #2: A clear situation overview
Most companies run several marketing channels and tools, from CMSs to Google Analytics to Meta reporting. When data lives in separate places, getting a clear picture of what's actually happening takes time that most teams don't have.
Klipfolio Klips dashboards brought everything into one place.
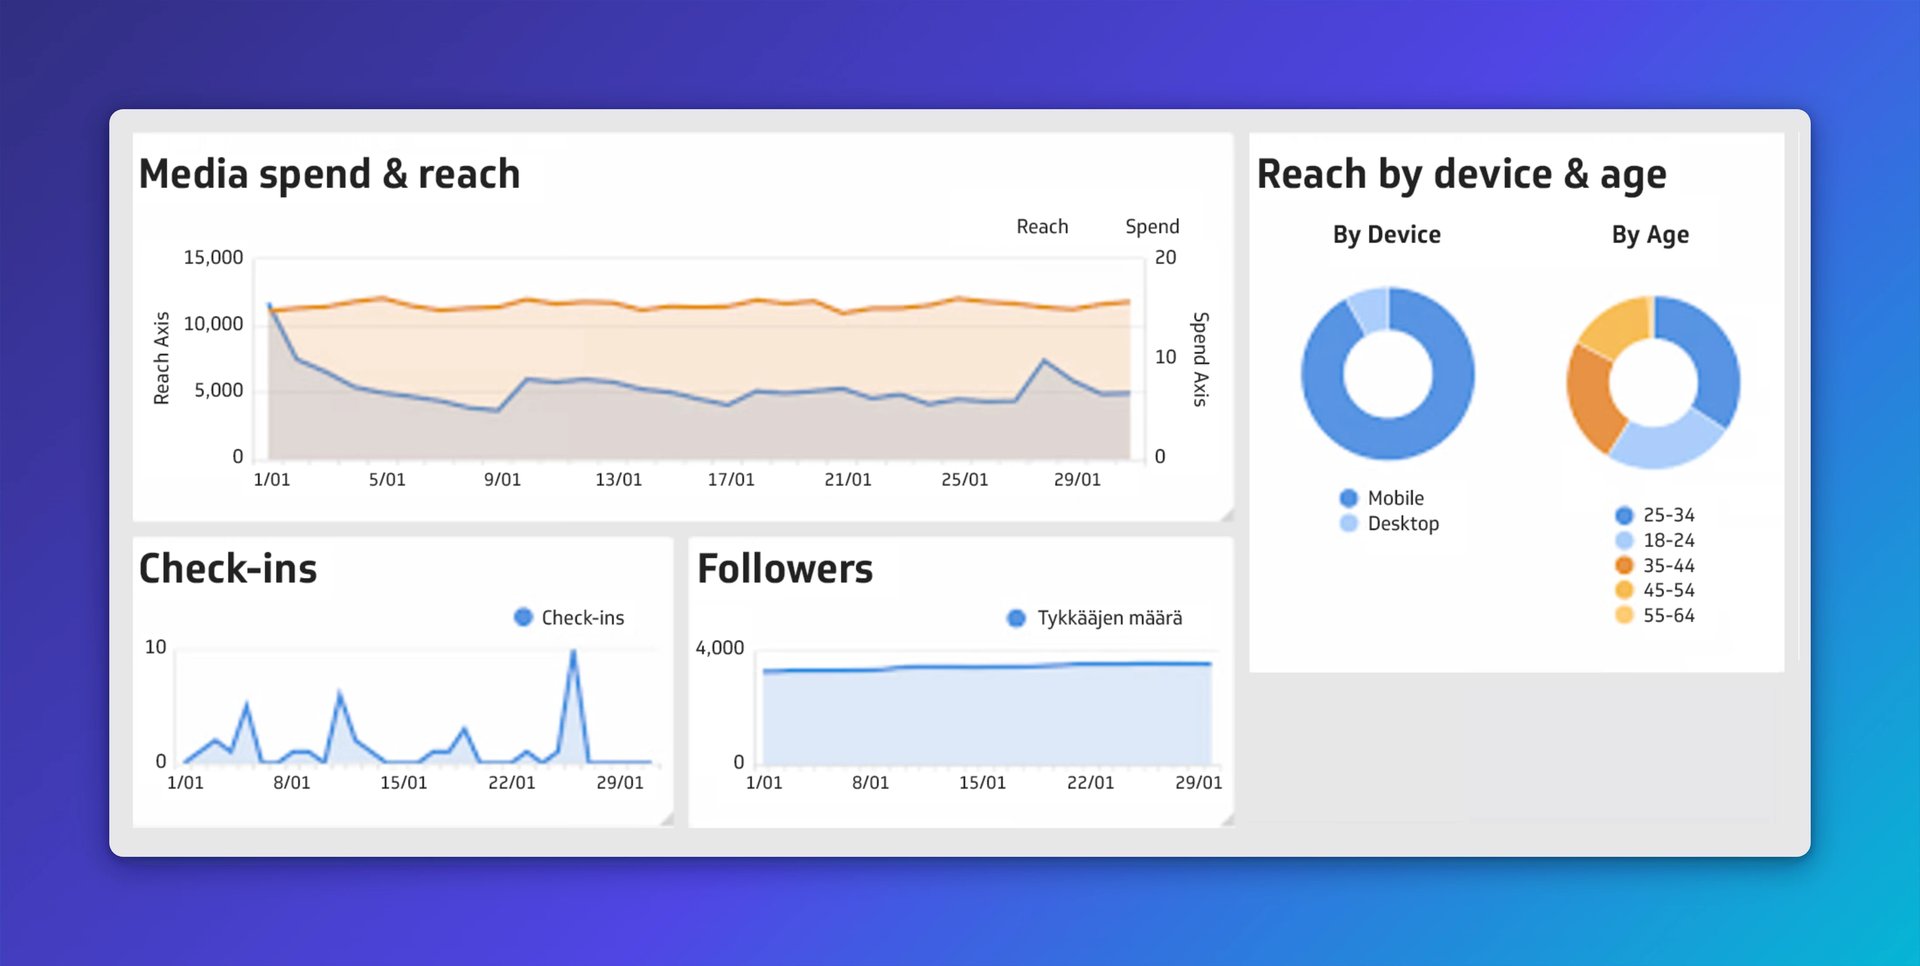
The dashboard above is from a restaurant industry client. The primary goal was tracking social media performance. Within that, the focus was on three questions:
How content reaches the target audience
Whether that audience is responding by visiting the restaurant
Whether long-term interest is growing, measured by follower count
For eCommerce clients, the questions shift. eCommerce metrics often centre on total conversions, conversions by channel, and cost-per-conversion. The dashboard changes; the principle stays the same: align the view to what the client actually needs to decide.
Advantage #3: Customized visualizations
Klipfolio Klips lets you combine multiple data sources into a single visualization. That matters when a client's story doesn't fit a standard chart type.
Below is an example of a Klip showing two conversion types as columns and spend as a trend line.
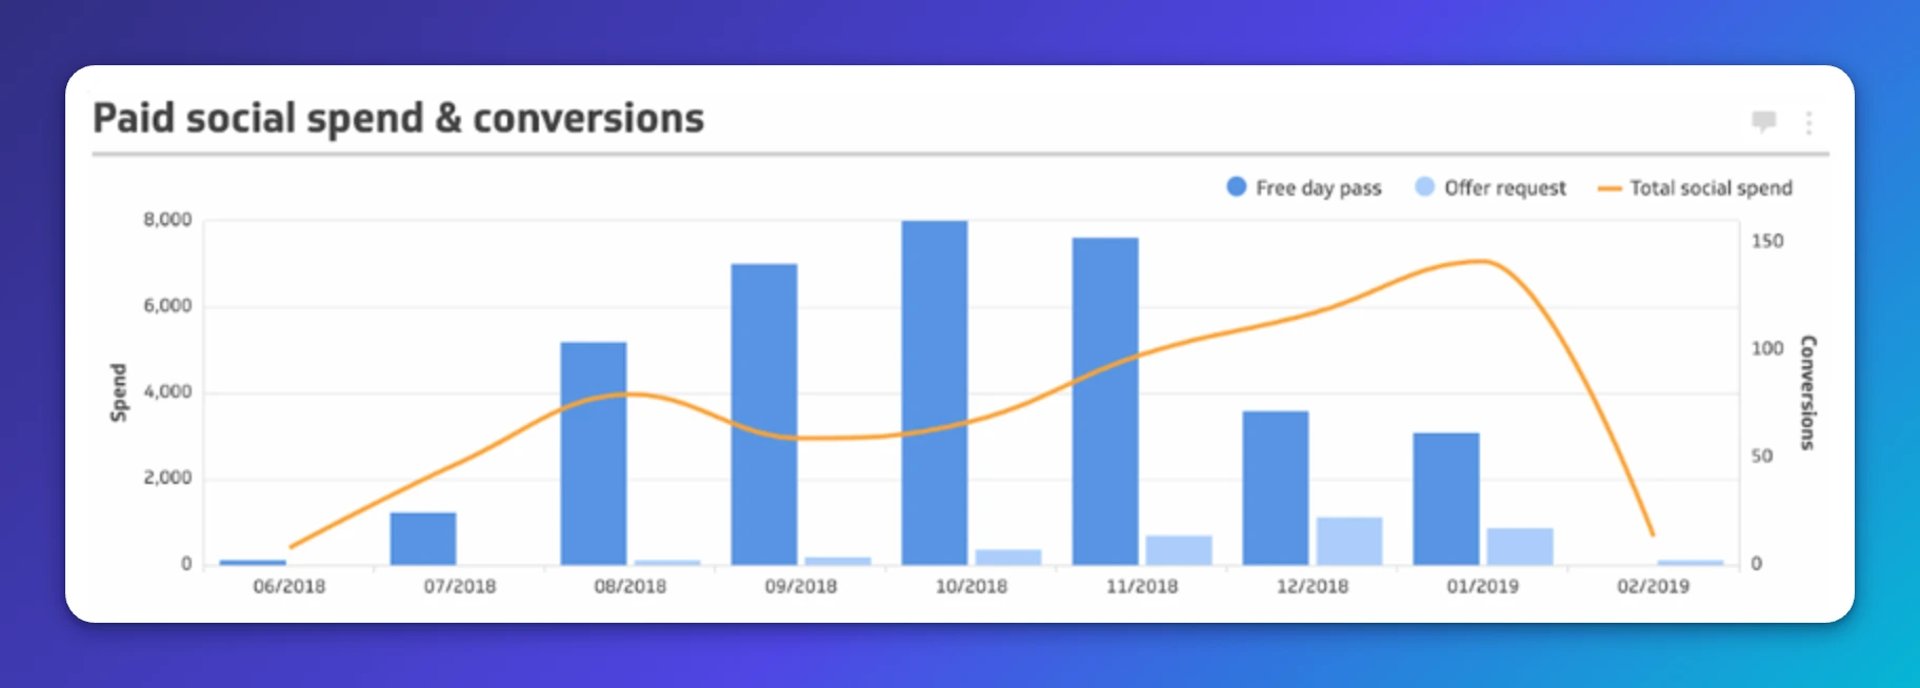
Custom visuals take time to build, but the payoff is clarity. A well-designed chart shows not just what happened, but how to respond.
Advantage #4: Real-time results
Checking a report once a week means decisions lag by days. Real-time data changes that.
Monitoring performance daily, rather than weekly or monthly, gives fast-moving eCommerce clients the ability to act on what's happening now, not what happened last week. Budget allocation across channels is one example: a real-time view makes those calls faster and more confident.
A data-driven mindset also improves the agency-client relationship. When everyone looks at the same numbers in the same place, communication gets cleaner and decisions get easier.
Key result: 40% time savings on repetitive tasks
In a study, 82% of respondents said that marketing automation could be done more efficiently. Parcero took that seriously. Strategist Heikki Kyllönen put it plainly:
"We need to take this automation talk and put it into practice. It is the only way to stay competitive in the field of digital marketing in the future."
Before automation, campaign decisions leaned heavily on briefings and marketer intuition. After, the team had reliable data shaping every call. The shift is visible in the numbers:
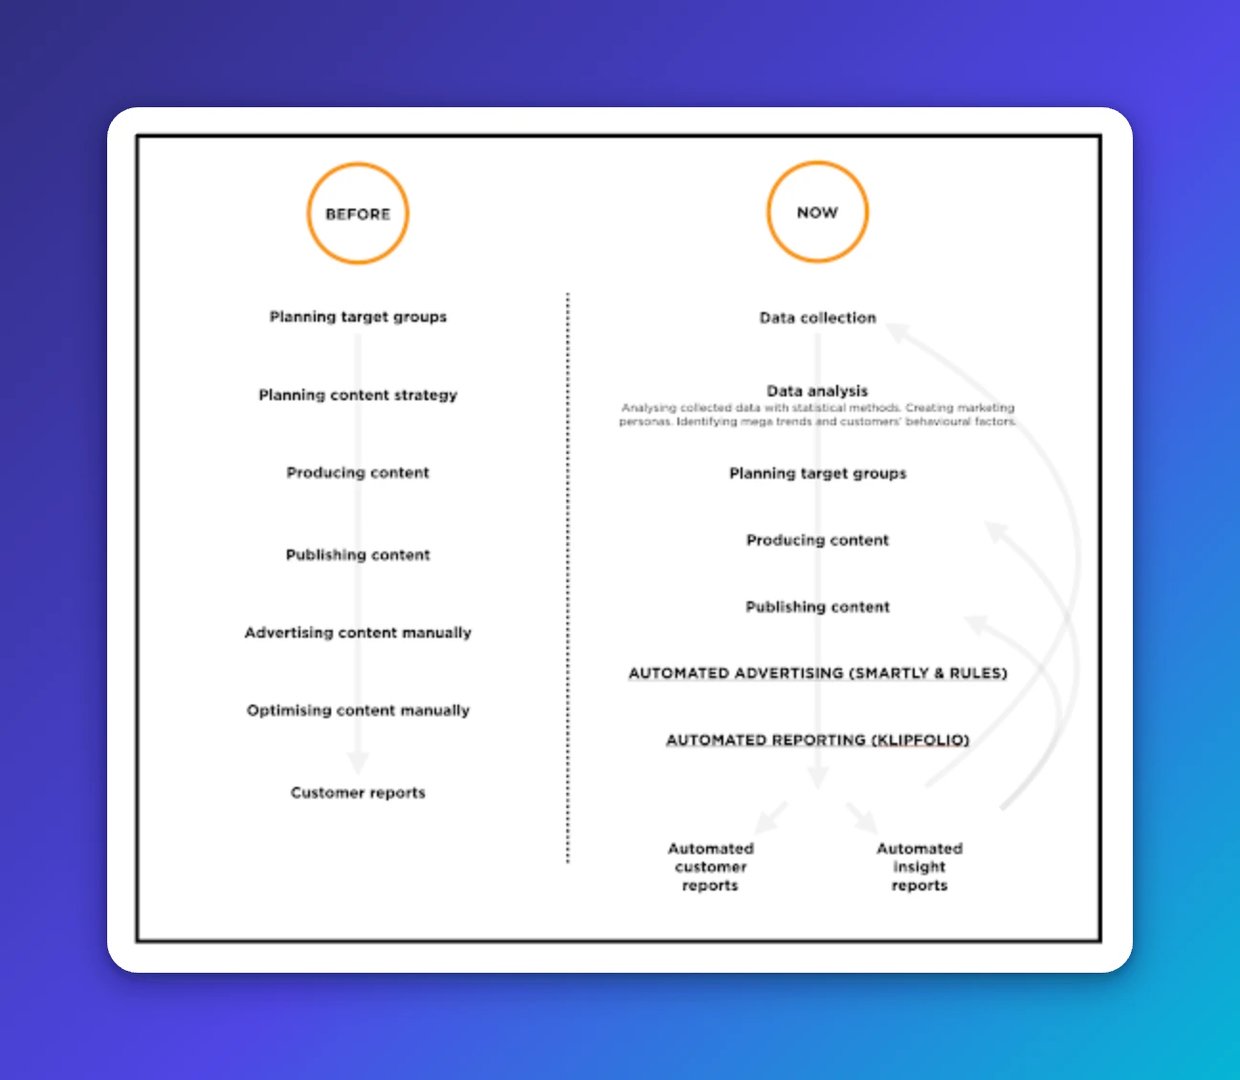
33% time saved on repetitive advertising tasks
73% time saved on repetitive reporting tasks
2x time spent on data analysis and planning
That additional time went into planning and communication, and it shows in client results. With 50+ clients on the roster, automating even small repetitive tasks across every account adds up quickly.
Create custom dashboards for you and your team.
Get started with Klips5 takeaways from Parcero's reporting automation
Automation frees time for higher-value work. Not everything can be automated, and human judgement still matters. But Parcero's experience shows what becomes possible when the repetitive work is handled:
Full transparency: Clients can check campaign performance any time, without waiting for a report.
Open communication: Tracking the same KPIs every month means poor results surface early, not at the end of a quarter.
Goal orientation: Business-critical metrics connect directly to campaign decisions, not just to a slide deck.
Complete picture: All data in one place means the full story is visible at a glance, without assembling it manually.
Data-driven culture: When everyone in the organization sees the same numbers, data becomes part of how decisions get made, not an afterthought.
Published 2022-04-14
More in Case Study

Klipfolio Partner How-To #1: Duplicating dashboards across client accounts

Klipfolio Partner How-To #2: Company Properties can simplify client set-up

PayTabs embraces a data-driven strategy with KPI dashboards

Klipfolio helps Ascentis manage team performance using hard facts

How Klipfolio Data Heroes helped Curotec automate real-time reporting
Personalizing a Dashboard for 200 Users
Most recent
- AUG 11Beyond simple sign-ups: how True Trials and Activation predict growth
- JUL 7Why business leaders miss important trends in their dashboards
- JUN 19The best chart for the job: Visualizing data for non-technical users
- JUN 95 tips to understand (and organize) your restaurant data
- MAY 26Think in Horizons, Not Seconds
- MAY 2010 Cloud BI Dashboard Tools for Small Businesses in 2026