

How Sarah's OKR dashboard made her impossible to overlook: A client success story
Sarah didn't set out to raise her profile. She set out to do better work. Her OKR dashboard made both happen. This client success story covers how a structured personal dashboard connected her contributions to organizational priorities, surfaced performance gaps, reduced unnecessary meetings by 35%, and made her results visible before any quarterly review could.

Sarah didn't set out to become the most visible person in her organization. She set out to do better work. Her OKR dashboard made both happen.
OKRs (Objectives and Key Results) are a goal-setting framework that connects individual work to organizational priorities. Sarah, a client who implemented OKRs with a structured personal dashboard, shared results that were hard to ignore: stronger performance, clearer priorities, and a reputation that opened doors she hadn't thought to knock on.
What she built wasn't complicated. But it gave her something most professionals don't have: a clear, daily picture of whether she was moving in the right direction, without having to ask anyone or wait for a quarterly review. No pasting numbers into a spreadsheet. No explaining context from scratch to a manager once a month. Just a reliable answer, every day, to the question that actually matters: am I on track?
Fitting into the big picture
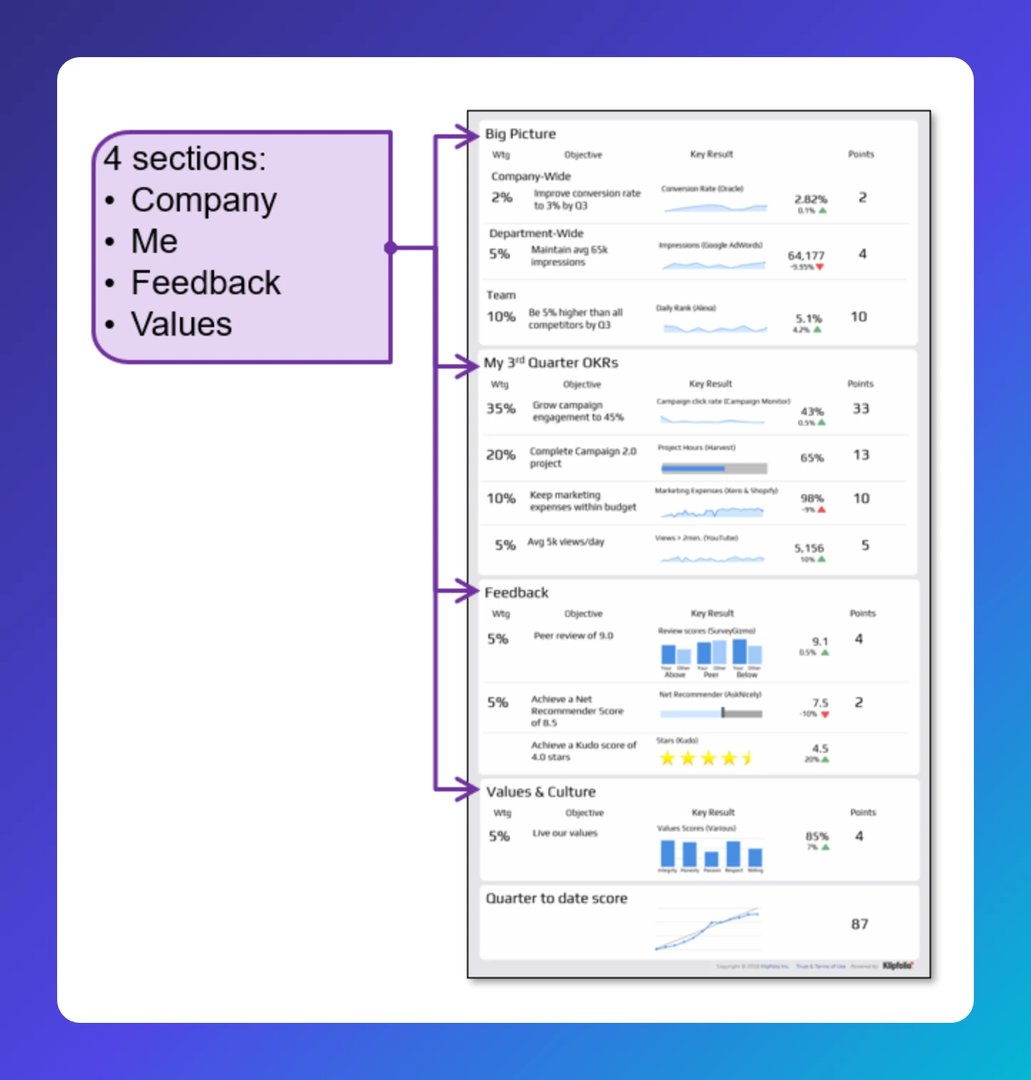
Sarah's dashboard was divided into four sections, with total performance displayed at the bottom.
Each section showed the OKRs she was connected to, making her contributions to the organization visible in a way that had never been clear to her before. Senior leaders could see exactly what she was working on and how it supported their goals.
The Feedback and Values sections went beyond task completion. They gave Sarah a view of how she was perceived and how she was showing up for the people around her. That visibility changed how she worked, not just what she worked on.
Getting priorities right
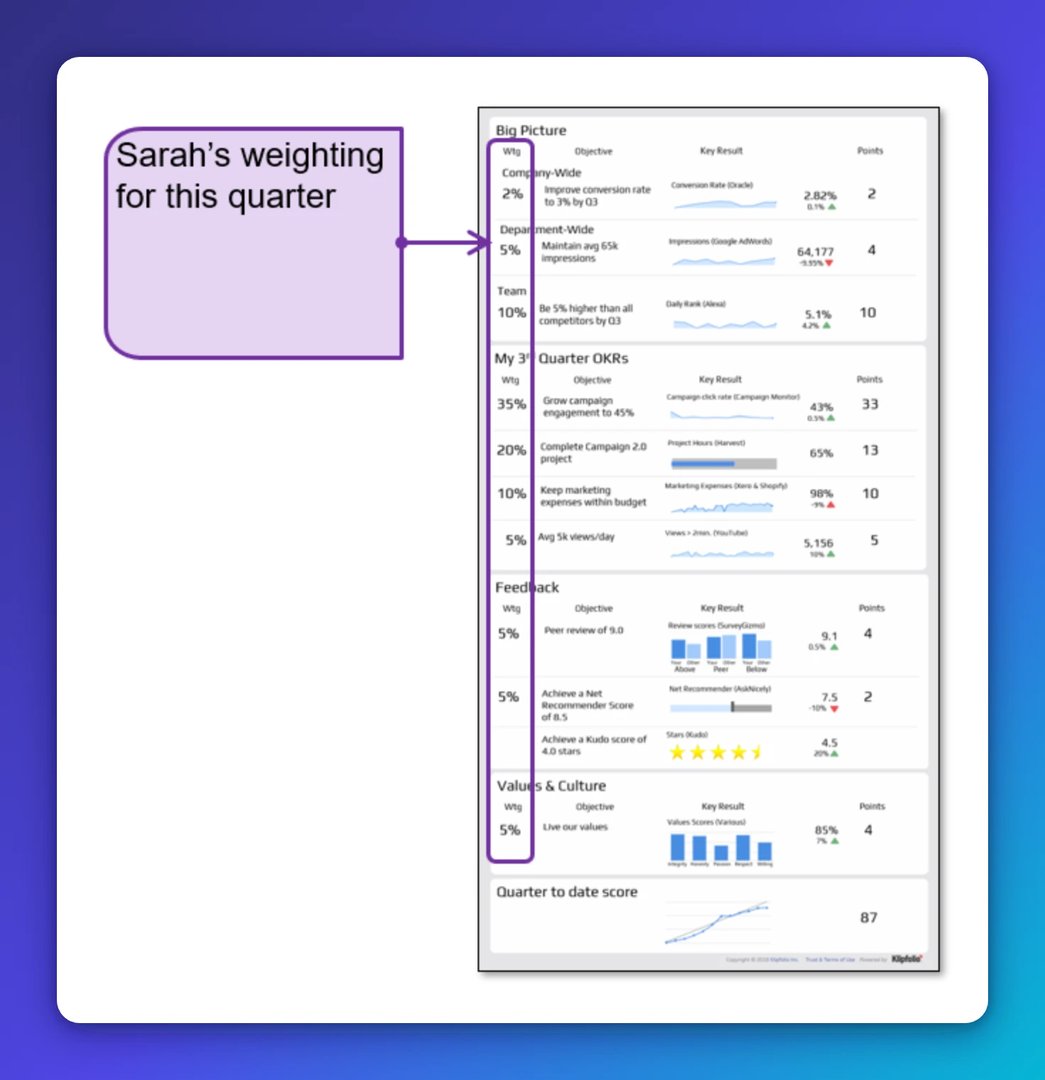
Each quarter, Sarah and her managers agreed on the relative weight of everything on her plate.
The weighting scheme in her My OKR section helped matrix managers and team leads align on her priorities across objectives. That clarity let her allocate time across cross-functional responsibilities without constantly negotiating.
One example stood out. A pair of training courses had been postponed twice. Once her manager could see, in the dashboard, how those courses connected to her Objectives, he approved them without hesitation. The ask hadn't changed. The visibility had.
Gamifying the job
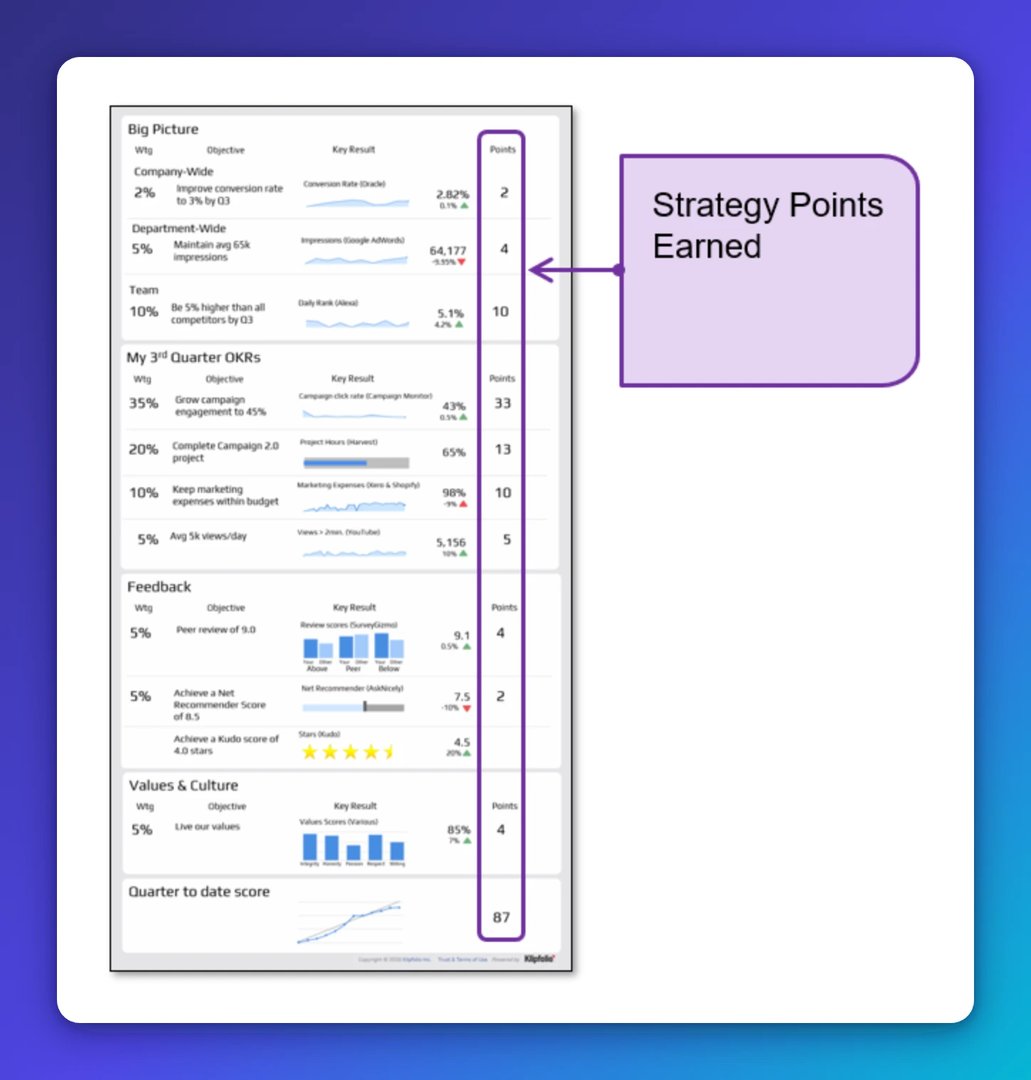
Sarah's dashboard tracked strategy points earned for each Objective, with daily, weekly, and monthly scores.
That scoring system became her biggest motivator. She started reviewing her own actions to see what would beat her previous high score. The game was real, and she was winning it.
She outperformed teammates month after month and was recognized at all-hands meetings. Once she started earning "Top Performer" badges, colleagues noticed. She got first pick of special projects. People said hello in the hallways. The dashboard didn't make her famous. The results did. The dashboard just made the results impossible to miss.
Measuring what matters
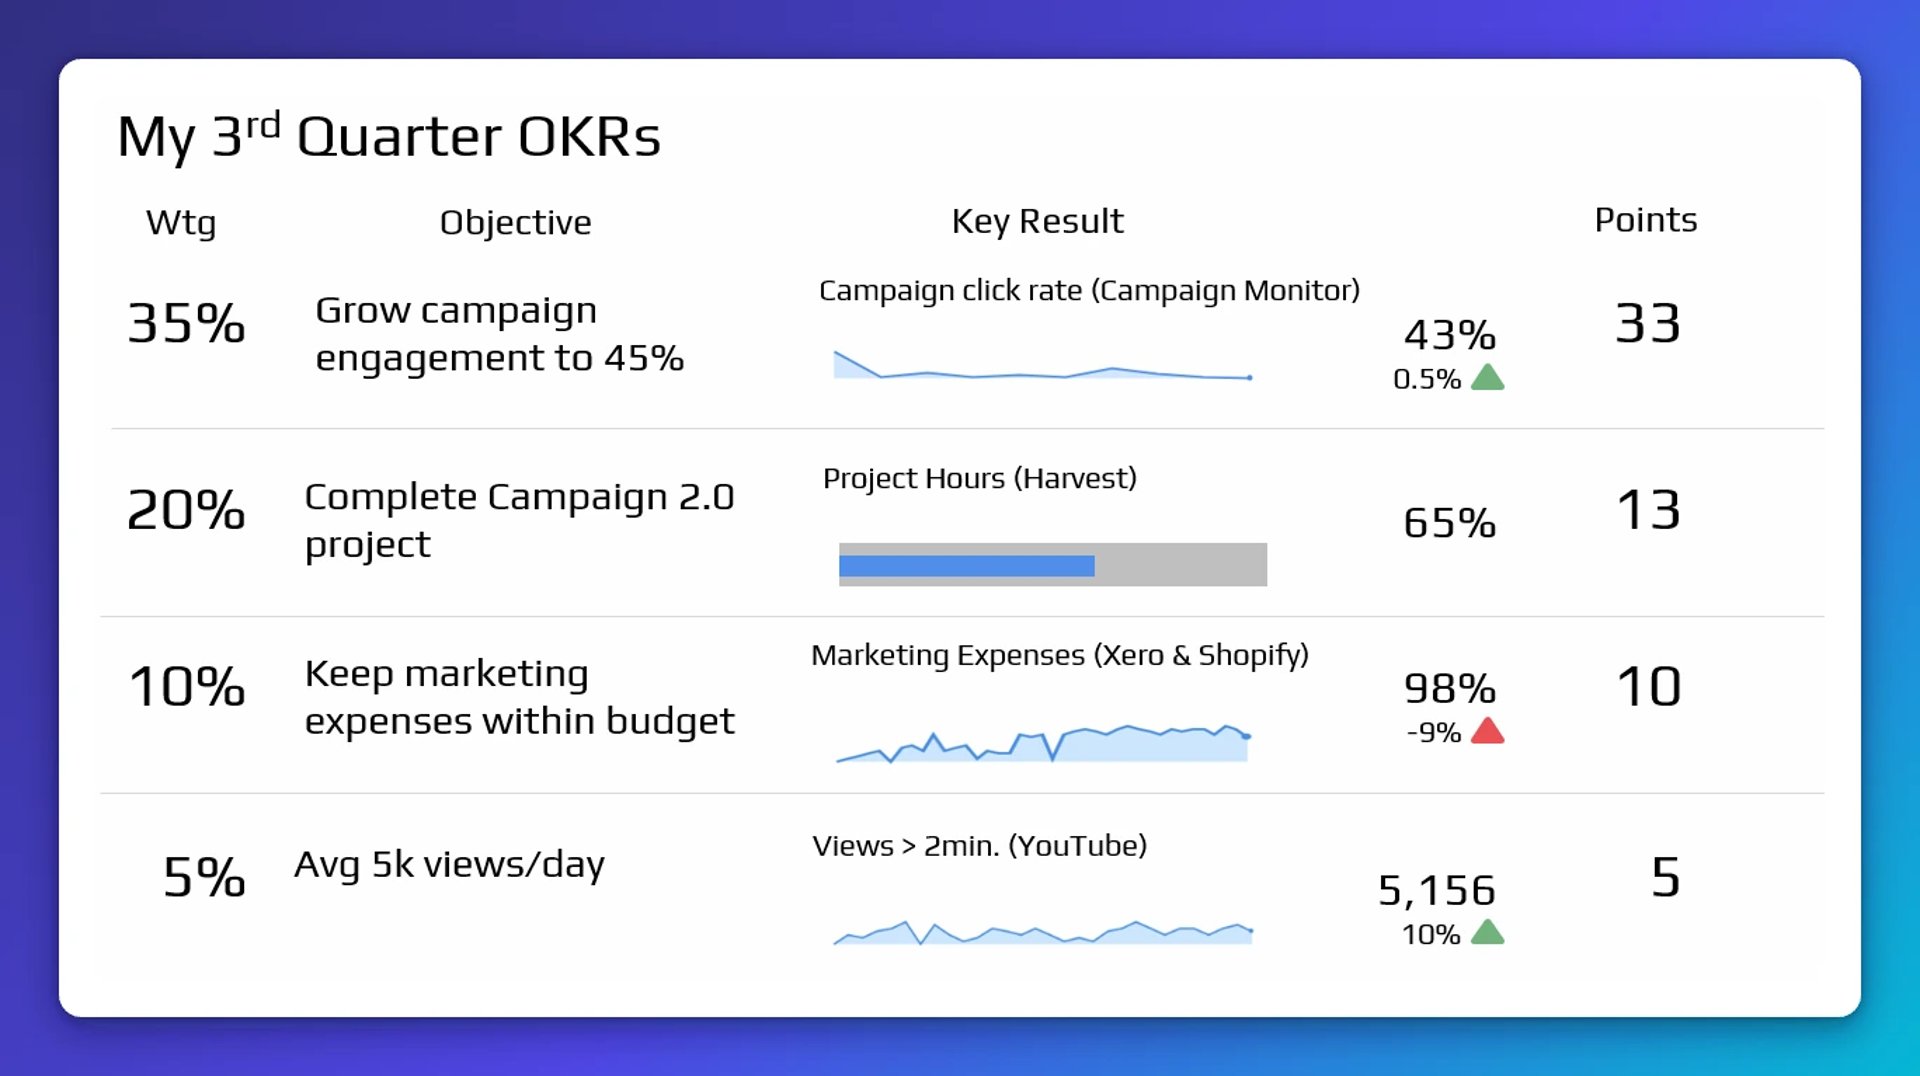
Sarah applied the S.M.A.R.T. framework when setting her OKRs: specific, measurable, achievable, relevant, and time-bound. That discipline made progress easy to track and kept her focused on work that actually moved the needle.
One side effect surprised her. She attended about 35% fewer meetings. Around 20% of the meetings she had been invited to had no connection to her Objectives, so she sent a brief email explaining she wouldn't attend. Another 15% fell outside her RACI responsibilities. She was the "R" or "I," meaning she only needed to be informed, not present.
Her daily dashboard also helped her respond to problems as they happened, not weeks later when month-end reports finally surfaced. She wasn't checking in on things; the dashboard surfaced what needed her attention before it became a problem.
Becoming a team player
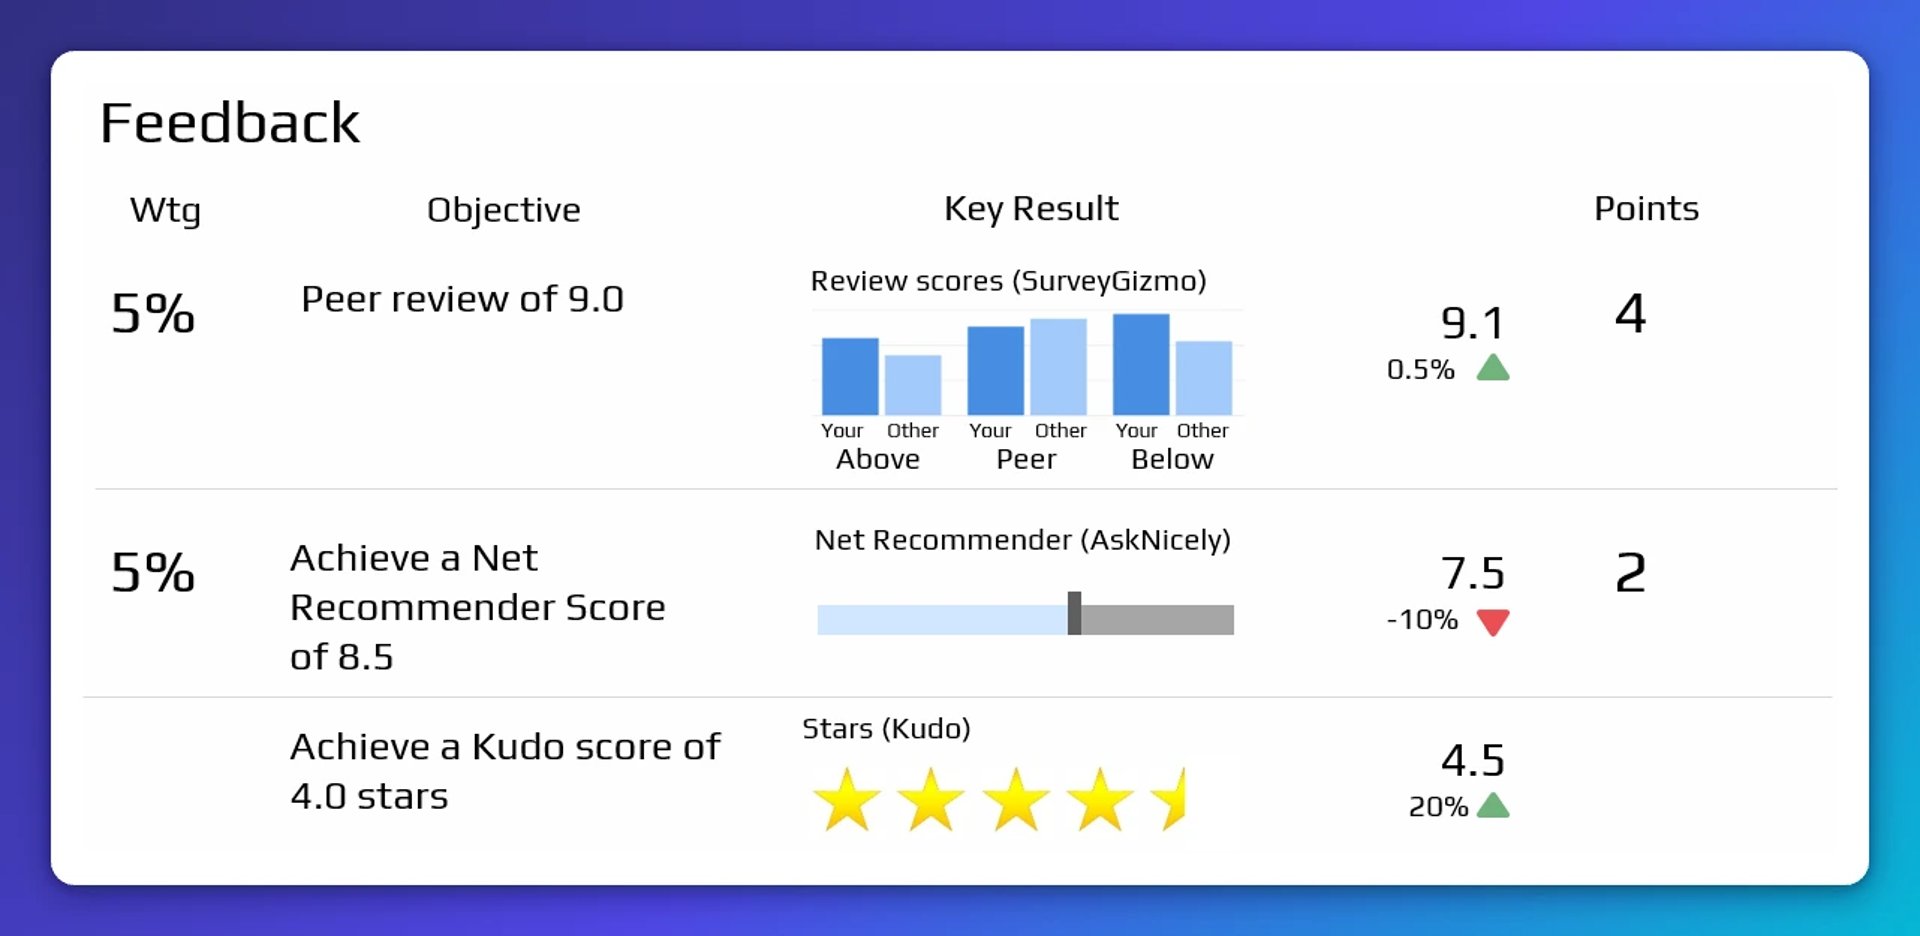
The Feedback section collected input from co-workers, suppliers, and customers. For the first time, Sarah could see how different groups perceived her. Her direct manager had a stronger impression of her than her matrix managers did. Once that gap was visible, the team adjusted her Objective weightings to address it.
Her NRS (Net Recommender Score, "Would you recommend Sarah for the next project?") climbed steadily. The more her performance was visible, the more she was recommended. Visibility and reputation reinforced each other.
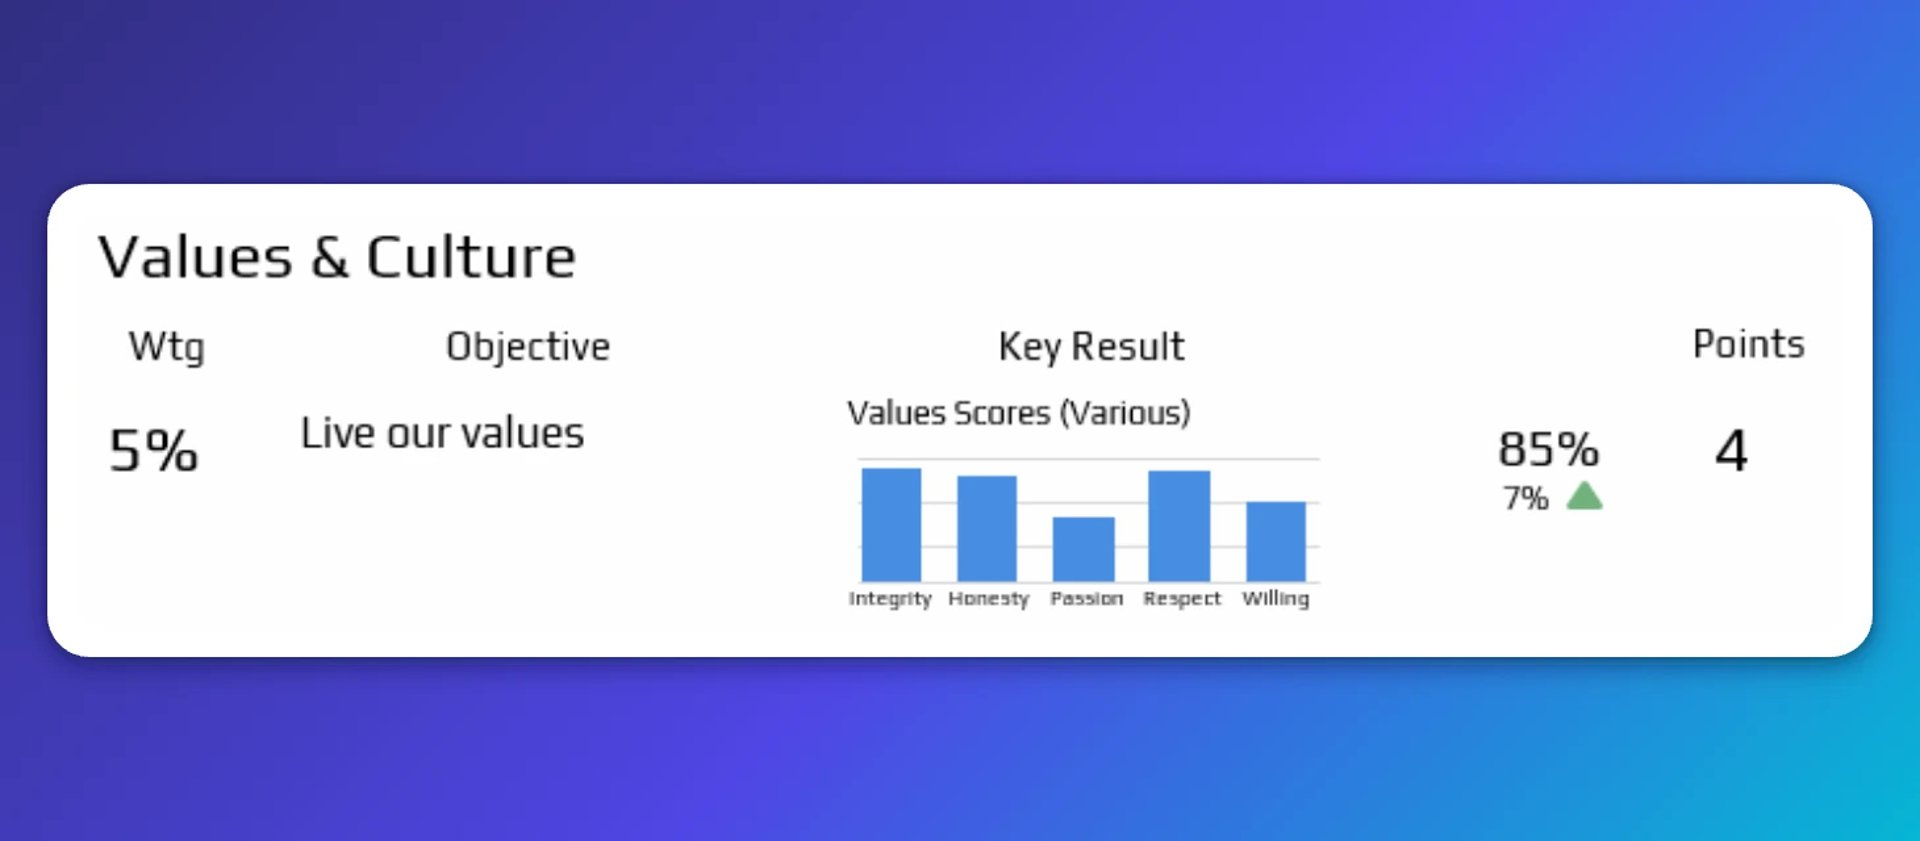
Her company had communicated its five values for years. Sarah had heard them. She just hadn't known what to do with them.
Her OKR dashboard gave each value a hard measure. "Integrity" was defined as "Say what we will do. Do what we said." Her measures tracked how often she changed promised delivery dates and how often she committed to one date but delivered late.
With that clarity, the values stopped being posters on a wall. Her Values score improved an average of 10% per quarter. Customers noticed. Her score reflected it.
Create custom dashboards for you and your team.
Get started with KlipsProgress, one day at a time
Sarah didn't make a dramatic leap. She improved slightly, every day, and the dashboard made that progress visible to her before anyone else saw it.
Then her teammates saw it. Then her managers. Then the whole organization.
Most people wait for a quarterly review to find out where they stand. Sarah knew every day. That's the real advantage: not a better chart or a cleaner report, but the confidence that comes from never having to guess. A dashboard that gives you that, consistently and reliably, is worth more than any review cycle ever will be.
Published 2026-08-25
More in Case Study

Klipfolio Partner How-To #1: Duplicating dashboards across client accounts

Klipfolio Partner How-To #2: Company Properties can simplify client set-up

PayTabs embraces a data-driven strategy with KPI dashboards

Klipfolio helps Ascentis manage team performance using hard facts

How Klipfolio Data Heroes helped Curotec automate real-time reporting

Connecting Klipfolio to HubSpot just got a whole lot easier
Most recent
- AUG 11Beyond simple sign-ups: how True Trials and Activation predict growth
- JUL 7Why business leaders miss important trends in their dashboards
- JUN 19The best chart for the job: Visualizing data for non-technical users
- JUN 95 tips to understand (and organize) your restaurant data
- MAY 26Think in Horizons, Not Seconds
- MAY 2010 Cloud BI Dashboard Tools for Small Businesses in 2026