

13 marketing metrics you need to track
Knowing which numbers to watch is the difference between a marketing budget that compounds and one that drains. This article covers 13 marketing metrics that connect directly to decisions you can make: from brand awareness and MQLs through to customer lifetime value, CAC, and ROMI. Each metric includes a plain-language explanation, the formula where relevant, and guidance on how to use it. The article also covers how to choose the right metrics for your goals, which analytics tools to use, and how to improve your marketing ROI over time.

Knowing which numbers to watch is the difference between a marketing budget that compounds and one that drains. These 13 marketing metrics tell you what's working, what to cut, and where to push harder.
Most marketing teams track too many things loosely instead of a focused set of metrics tightly. The result: reports that describe the past without pointing to what comes next. The metrics below are chosen because each one connects directly to a decision you can make.
What are marketing metrics?
Marketing metrics are measurable values that show how effective your campaigns are across channels and over time.
They include signals like:
- Email campaigns—delivered, opened, and sent
- Feed subscribers
- Followers
- Goal completions
- Lead conversion rates
- Leads
- Organic search
- Page impressions
Which metrics matter most depends on your goals. An email campaign, for example, lives or dies on how many of your emails were opened during a campaign. A brand awareness push calls for different signals entirely.
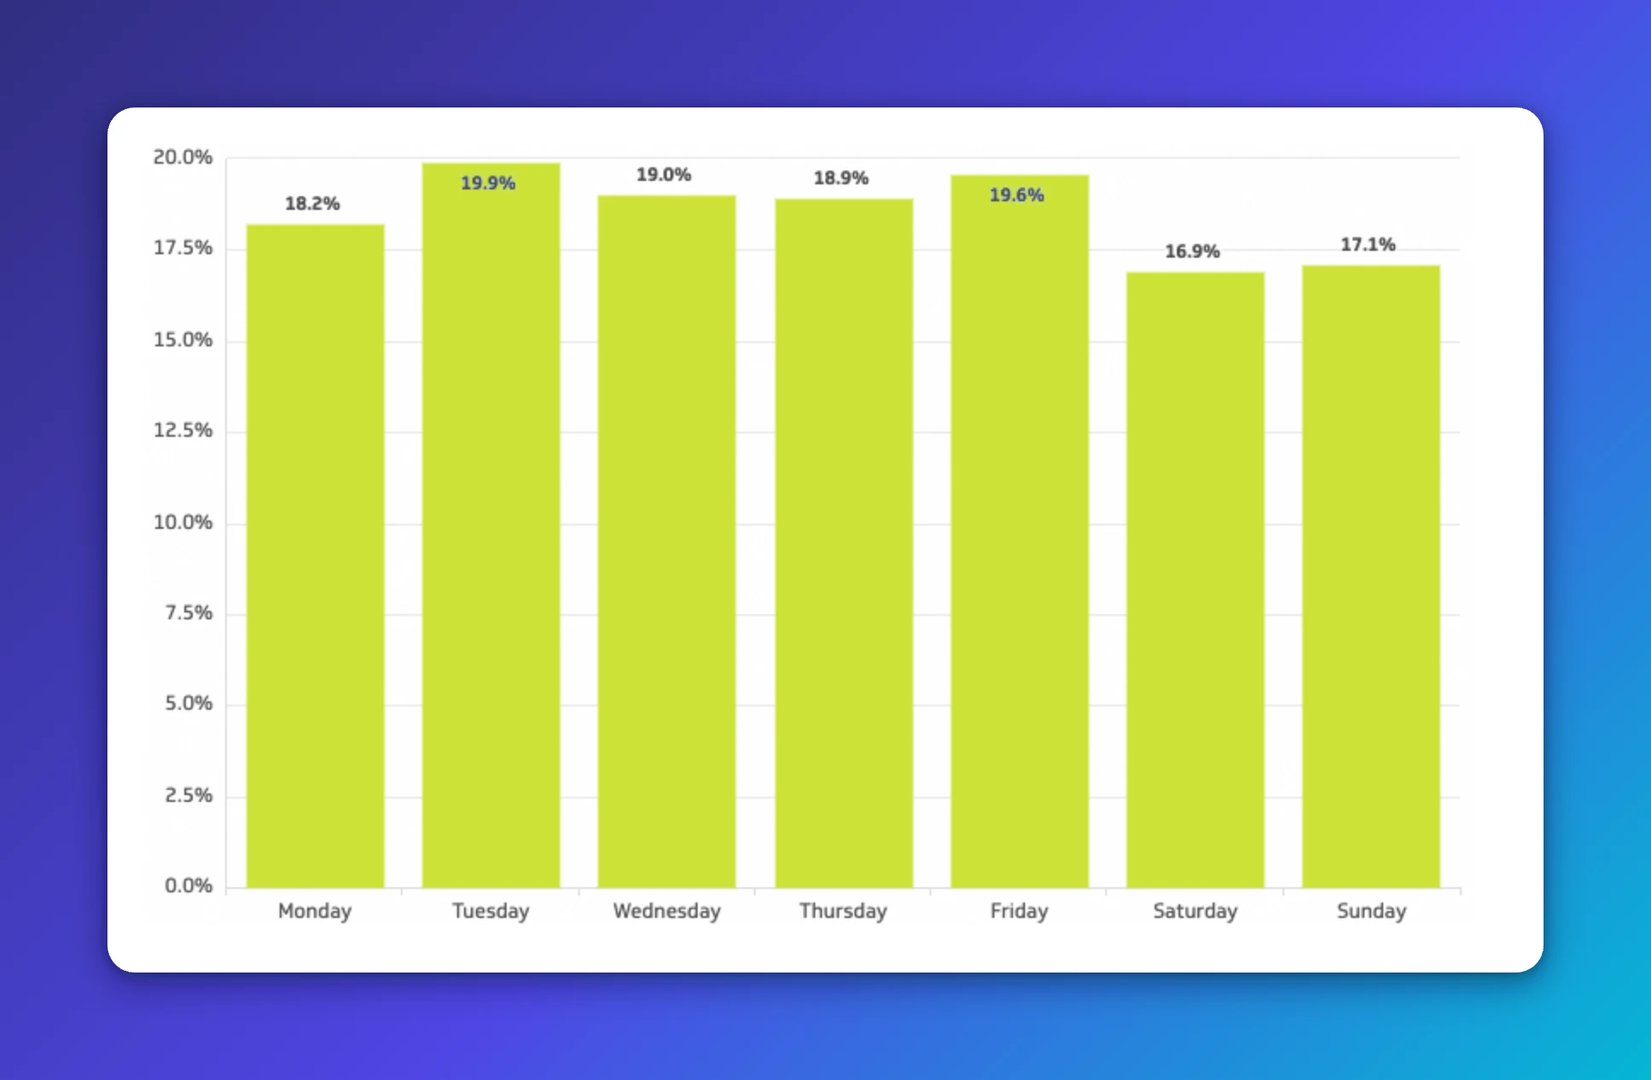
The right metrics don't just describe performance. They tell you what to do next.
How digital marketing has evolved
The end goal hasn't changed: generate leads and create conversions. What has changed is the precision available to marketers, and the expectations that come with it.
Budgets are tighter. Audiences are harder to reach. And generic AI tools have made it easier than ever to produce content at scale, which means standing out requires knowing your numbers, not just publishing more.
From its State of Inbound report in 2018, HubSpot reported common priorities for marketers.
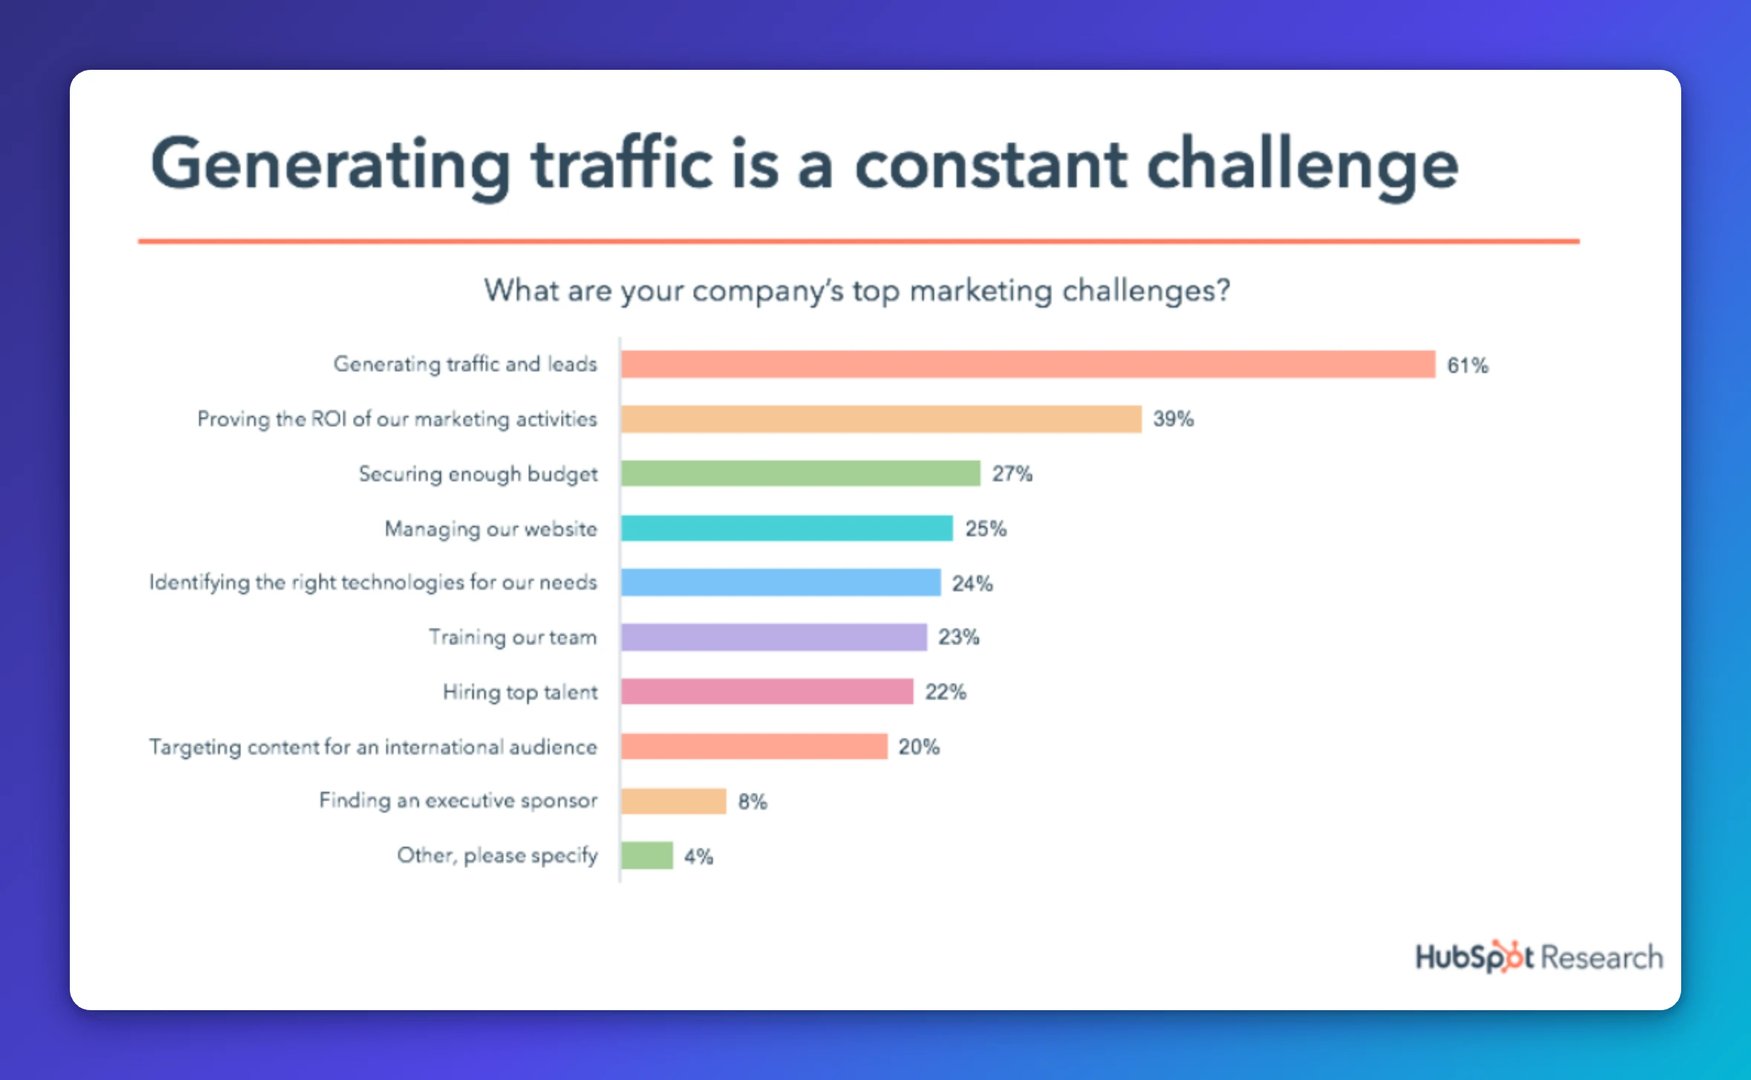
HubSpot's marketing statistics show what's driving inbound marketing today.
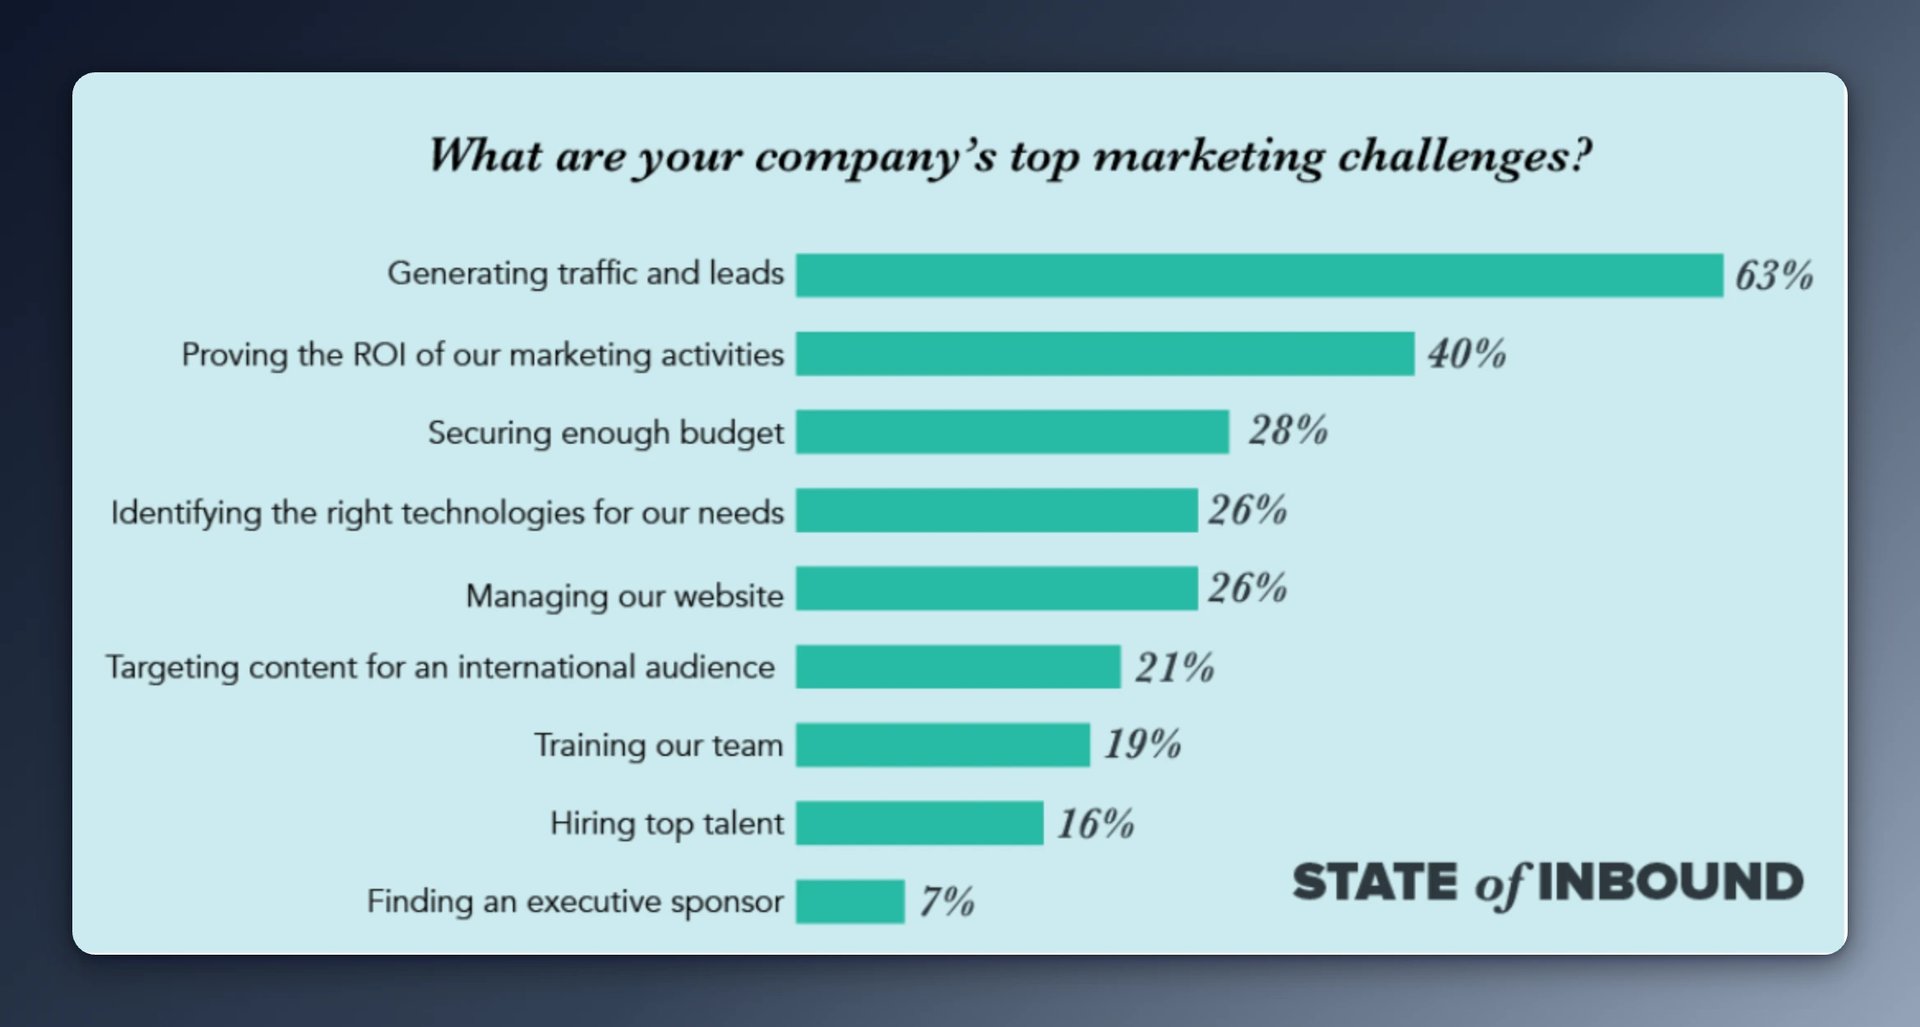
Generating traffic and leads remains the top priority. But the gap between that and other challenges has narrowed, which means marketers are now expected to perform across the full funnel, not just at the top.
13 important marketing metrics to monitor
The metrics below cover the full picture: awareness, lead quality, conversion, customer value, and return. Track all 13 and you'll have a clear, consistent view of whether your marketing is actually working.
- Brand awareness
- Marketing Qualified Leads (MQLs)
- Sales Qualified Leads (SQLs)
- Conversion rate
- Bounce rate
- SEO traffic
- Click-Through Rate (CTR)
- Net Promoter Score (NPS)
- Customer engagement
- Customer Lifetime Value (CLV)
- Customer retention
- Marketing spend per customer
- Return on Marketing Investment (ROMI)
Traffic, reach, and conversions are the three pillars. Achieving all three requires campaigns that attract the right people, qualify them through the marketing funnel, and convert them efficiently. The more precisely you track each stage, the fewer dollars you waste.
1. Brand awareness
Brand awareness tells you how familiar your target audience is with your brand before they're ready to buy. It's the foundation everything else builds on.
Key brand awareness metrics to track include social media mentions, shares, and follower growth. These show how widely your brand is recognized online.
Website traffic is equally useful here. Specifically, the ratio of new visitors to returning visitors. A rising share of new visitors means your brand is reaching people who didn't know you before. That's brand awareness working.
2. Marketing Qualified Leads (MQLs)
An MQL is a prospect who has shown genuine interest in your brand through your marketing. They've downloaded a white paper, signed up for a webinar, or engaged with content in a way that signals more than casual browsing.
MQLs matter because they separate the curious from the interested. Tracking them tells you whether your content is attracting people who could actually become customers, or just generating traffic that goes nowhere.
Review your MQL criteria regularly. Audience behaviour shifts, and criteria that worked six months ago may be letting the wrong leads through now.
3. Sales qualified leads (SQLs)
SQLs are leads that have moved beyond interest into active consideration. They've requested a demo, filled out a detailed inquiry form, or engaged directly with your sales team.
The distinction between MQL and SQL matters because it tells you where leads are dropping off. If you have strong MQL numbers but weak SQLs, the gap is likely in your nurture sequence or the quality of your targeting.
Use your CRM to track the journey from first contact to SQL. Patterns in that data show you which campaigns produce leads that actually close.
Level up data-driven decision-making. Make metric analysis easy for everyone. Get PowerMetrics Free
4. Conversion rate
Conversion rate is the percentage of visitors who take a desired action: a purchase, a sign-up, a form submission. It's the clearest signal of whether your campaigns are doing their job.
Conversion rate formula:
Conversion rate = (number of conversions / total number of visitors) × 100
Four reliable ways to improve your conversion rate:
- Run A/B tests on headlines, CTAs, and page layouts
- Improve page load speed and mobile experience
- Write CTAs that name the benefit, not just the action
- Personalize messaging based on traffic source or audience segment
Conversion metrics apply across every channel: your website, email campaigns, social ads, and landing pages. Track them by channel so you know where your budget is earning its keep.
5. Bounce rate
A high bounce rate means people are arriving and leaving without engaging. That's a signal worth investigating, not ignoring.
A bounce happens when a visitor lands on a page and leaves without clicking anything else. The bounce rate is the share of all visits that end that way.
Bounce rate formula:
Bounce rate = (number of single-page visits / total number of visits) × 100
A high bounce rate often points to a mismatch between what your ad or search result promised and what the page delivered. It can also indicate slow load times or a poor mobile experience.
Also track your email bounce rate, which measures emails that never reached their destination. The benchmark sits around 0.41%. Anything higher suggests your list needs cleaning or your deliverability needs attention.
6. SEO traffic
SEO traffic is visitors who found you through a search engine without clicking a paid ad. These people were already looking for what you offer. That makes them some of your highest-intent prospects.
Google Analytics surfaces the key data you need here:
- Volume of organic visits over time
- Keywords driving traffic to your pages
- On-page behaviour once visitors arrive
Pay attention to which pages drive the most organic traffic. Those pages tell you which topics resonate with your audience and where your content strategy is earning results. Pasting your analytics into a generic AI tool won't give you that pattern recognition. Consistent tracking does.
7. Click-Through Rate (CTR)
CTR measures the percentage of people who click after seeing your ad, email, or link. It tells you whether your message is compelling enough to earn action.
CTR formula:
CTR = (number of clicks / number of impressions) × 100
A high CTR means your message connects. A low CTR means something is off: the headline, the offer, the audience, or all three. In email, CTR tracks clicks within the campaign relative to total recipients, making it one of the clearest signals of content relevance.
8. Net Promoter Score (NPS)
NPS measures how likely your customers are to recommend you. It's a direct read on satisfaction and loyalty.
Ask customers one question: "On a scale of 0 to 10, how likely are you to recommend us to a friend?" Their answers place them into three groups:
- Promoters (score 9 to 10)
- Passives (score 7 to 8)
- Detractors (score 0 to 6)
Subtract the percentage of Detractors from the percentage of Promoters. For example:
- Detractors: 6 (4.8%)
- Neutrals: 64 (51.2%)
- Promoters: 55 (44%)
- Total: 125 (100%)
Net Promoter Score = 44% - 4.8% = 39.2
A strong NPS means customers are doing some of your marketing for you. Referrals cost less to acquire and tend to retain longer. Tracking NPS over time shows whether your marketing is building loyalty or eroding it.
9. Customer engagement
Customer engagement measures how actively your audience interacts with your brand beyond the transaction. It's a leading indicator of retention and lifetime value.
Track a mix of signals across channels:
- Time spent on site
- Social media interactions (likes, shares, comments)
- Email open rates
- Survey and feedback participation
Engaged customers buy again, refer others, and tolerate the occasional mistake. Low engagement, on the other hand, often precedes churn. Watching these numbers lets you act before customers go quiet.
10. Customer Lifetime Value (CLV)
Customer Lifetime Value (CLV) is the total revenue you can expect from a single customer over the full course of their relationship with your business.
CLV formula:
CLV = (average transaction value) × (number of purchases per year) × (average customer lifespan in years)
A high CLV tells you that your marketing isn't just attracting customers. It's attracting the right customers who stay and spend. Use CLV to decide how much you can afford to spend acquiring a new customer, and which segments are worth investing more in.
11. Customer retention
Customer retention measures the percentage of customers who stay with you over a given period, excluding new customers acquired during that time.
If you start the year with 100 customers and end with 80, your retention rate is 80%.
Retaining customers costs three to six times less than acquiring new ones. That makes retention one of the highest-leverage numbers in your business. A drop in retention is a signal that something in your product, service, or customer experience needs attention, and catching it early saves significant budget.
Create custom dashboards for you and your team.
Get started with Klips12. Marketing spend per customer
Often called Customer Acquisition Cost (CAC), this metric shows what it actually costs to win a new customer.
CAC formula:
CAC = total marketing spend / number of new customers acquired
If you spend $1,000 on marketing and acquire 100 customers, your CAC is $10. If those customers spend $100 each, you're in good shape. If they spend $8, you're not.
CAC only becomes meaningful when you put it next to CLV. Together, they tell you whether your marketing economics are sustainable.
13. Return on Marketing Investment (ROMI)
ROMI is the bottom line: for every dollar you put into marketing, how many dollars came back?
ROMI formula:
ROMI = (revenue generated from marketing campaigns - cost of marketing campaigns) / cost of marketing campaigns
If a campaign cost $1,000 and generated $5,000 in revenue, your ROMI is 4. You earned $4 for every $1 spent.
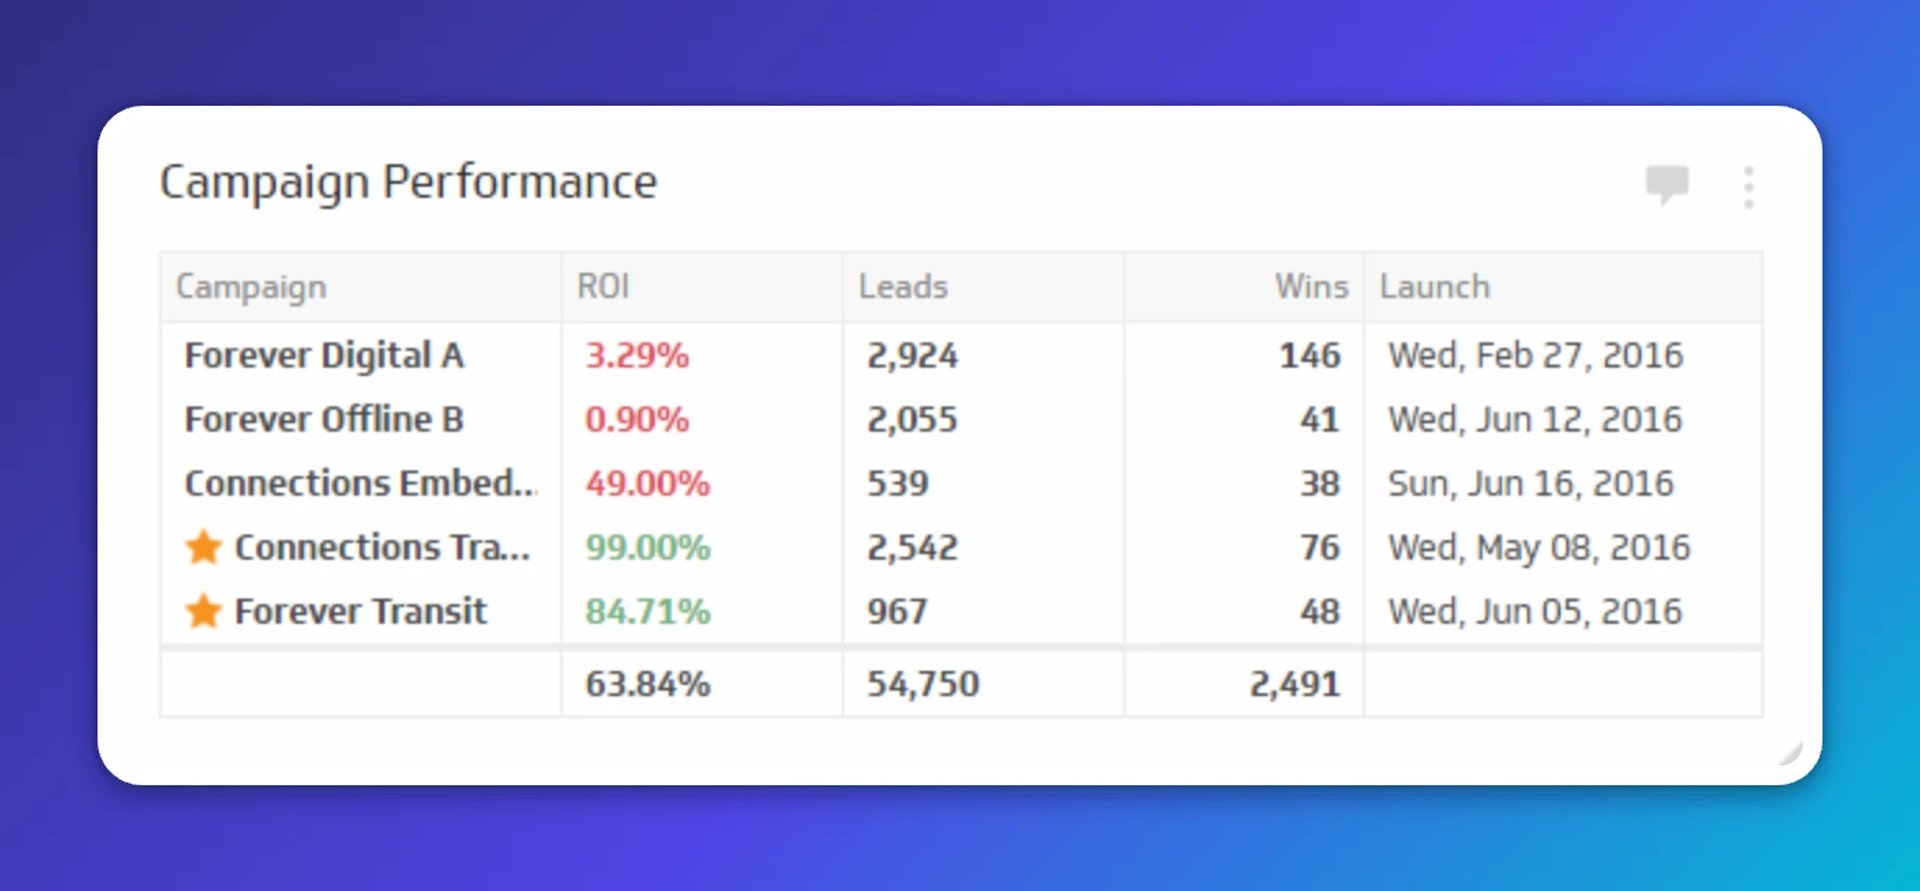
ROMI lets you compare campaigns that look very different on the surface. A small, targeted campaign with a ROMI of 6 beats a large, splashy one with a ROMI of 1.5 every time. Refer to Return on Marketing Investment (ROI) for detailed insights.
How to choose the right marketing metrics
Not every metric belongs on every dashboard. The right ones depend on your goals, your stage, and what decisions you actually need to make.
Identify your business goals
Start with what your business is trying to achieve. Growth, retention, brand awareness, and profitability each call for different metrics. If your goal is to grow revenue, focus on conversion rate and ROMI. If it's to reduce churn, watch retention rate and CLV closely.
Clear goals turn a long list of possible metrics into a short list of useful ones.
Define your marketing objectives
Each campaign should have a specific, measurable target that connects to a broader business goal. A brand awareness campaign might target new visitor growth and social reach. A product launch might target lead volume and SQL rate within a defined window.
Specific objectives make it easier to choose the metrics that will tell you whether you're succeeding.
Choose metrics that answer real questions
Pick metrics that point to decisions, not just descriptions. The best metrics answer questions like: Is this campaign worth continuing? Which channel is producing the best leads? Are we retaining the customers we're acquiring?
Start with the 13 above, including customer retention rate, CAC, and ROMI, and narrow from there based on what your business actually needs to know.
Use the right analytics tools
The right tools surface the right numbers without requiring you to dig for them. Here's a practical breakdown:
Web analytics tools: Google Analytics tracks website traffic, user behaviour, bounce rates, and conversions. It's the baseline for most teams.
Social media analytics tools: Hootsuite, Sprout Social, and Buffer measure engagement, follower growth, and campaign performance across platforms including Instagram, TikTok, YouTube, and Pinterest.
CRM tools: Salesforce and HubSpot track customer interactions, preferences, and retention over time. They're essential for connecting marketing activity to sales outcomes.
SEO and content analytics tools: Ahrefs, Semrush, and Moz surface keyword performance, backlink health, and content engagement. Use them to understand what's driving organic traffic.
Email marketing analytics tools: Mailchimp and Campaign Monitor track open rates, CTR, conversions, and bounce rates for email campaigns.
Customer feedback tools: SurveyMonkey and Zendesk collect satisfaction data and NPS, helping you understand how customers feel about your brand.
Advertising and PPC analytics tools: Google Ads and Meta Ads Manager track impressions, clicks, conversion rates, and ROI for paid campaigns. Most ad platforms have native analytics built in.
Heatmapping and UX tools: Hotjar and Crazy Egg show where users click, scroll, and drop off. Use them to improve page design and reduce bounce rate.
Dashboard and data visualization tools: You need one place where your metrics come together in a view that's easy to read and share. PowerMetrics connects your data sources and builds dashboards that give your whole team a consistent, reliable picture, without anyone having to pull numbers manually or paste figures into a spreadsheet.
Review and adjust regularly
Set a regular cadence for reviewing your metrics, quarterly at minimum, monthly if your campaigns move quickly. Look for trends, not just snapshots.
If a campaign is underperforming, adjust before the budget runs out. Continuous review is what separates teams that improve from teams that repeat the same mistakes.
Benchmark against industry standards
Compare your numbers against industry benchmarks to understand where you stand. Benchmarking reveals which metrics are genuinely strong and which look fine only because you haven't compared them to anything.
It also keeps you current on what good looks like in your category.
How to improve your marketing ROI
Tracking ROMI is the start. Improving it requires deliberate action across your campaigns and customer relationships.
Run A/B tests
A/B testing compares two versions of a marketing asset to see which performs better. Change one element at a time: a subject line, a CTA, a headline, an image. The results tell you what your audience actually responds to, not what you assume they will.
Even small improvements in CTR or conversion rate compound into meaningful ROMI gains over time.
Use marketing automation
Tools like HubSpot and Marketo handle repetitive tasks: email sequences, social scheduling, lead nurturing. That frees your team to focus on strategy and creative work that actually requires human judgment.
Automation also ensures consistent follow-up, which is where many small teams lose leads they've already paid to acquire.
Personalize your messaging
Generic campaigns produce generic results. Use your customer data to segment your audience and tailor your messages to what each group actually cares about.
Personalization improves conversion rates, increases CLV, and builds the kind of loyalty that shows up in your NPS. It's one of the highest-return investments a lean marketing team can make.
Prioritize customer lifetime value
Chasing new customers while neglecting existing ones is expensive. Shifting focus toward CLV, through loyalty programmes, exclusive offers, and proactive service, means more revenue from customers you've already won.
A team that knows its CLV by segment can make confident decisions about where to spend acquisition budget and where to double down on retention.
Track your metrics in one place
Jumping between platforms to piece together a picture of your marketing performance costs time and introduces errors. When your numbers live in different tools, it's easy to work from stale data or miss the connection between a campaign and its downstream impact.
A shared dashboard gives your team one reliable source of truth. Everyone sees the same numbers, updated on a consistent schedule, without anyone having to compile a report manually or explain their business from scratch to a generic AI tool every time they need an answer.
Create custom dashboards for you and your team.
Get started with KlipsWhat to track and why it matters
Marketing metrics aren't about reporting on the past. They're about knowing what to do next. The 13 metrics above cover every stage of the funnel: from the first time someone hears your name to the moment they become a long-term customer.
Start with the metrics that match your current goals. Build a dashboard that keeps them visible. Review them on a regular cadence. The teams that win aren't the ones with the most data. They're the ones who know which numbers matter and act on them consistently.
For deeper guidance on specific KPIs, explore the industry expert resources at Klipfolio.
Published 2026-08-21
More in How To

5 tips to understand (and organize) your restaurant data

6 dashboards I use daily to run my SaaS company
Business Metrics vs. KPIs: What’s the Difference?
What is a KPI, metric, or measure?

The Hidden Value of SaaS Sign Up Rate Benchmarks

Klipfolio Partner How-To #1: Duplicating dashboards across client accounts
Most recent
- AUG 11Beyond simple sign-ups: how True Trials and Activation predict growth
- JUL 7Why business leaders miss important trends in their dashboards
- JUN 19The best chart for the job: Visualizing data for non-technical users
- JUN 95 tips to understand (and organize) your restaurant data
- MAY 26Think in Horizons, Not Seconds
- MAY 2010 Cloud BI Dashboard Tools for Small Businesses in 2026