

How to use Marketo data to build a dashboard your team can monitor
This tutorial walks through a real example of connecting Marketo campaign data to a Klipfolio dashboard. It covers how to structure static lists for reporting, connect Marketo to Klipfolio in four steps, and build a table that shows subscriber counts, trial start rates, win rates, and MRR contribution, all updating automatically without anyone having to dig through Marketo.

If you run Marketo campaigns, you already know the data is there. Getting it out cleanly, and into something your whole team can actually read, is the harder part.
This tutorial walks through a real example: a lead nurture email course, tracked end-to-end in Marketo, connected to Klipfolio, and displayed on a dashboard that answers the questions a leader actually cares about. How many people signed up? How many started a trial? How many became customers? What did it contribute to MRR?
You won't need to dig through Marketo every time someone asks. Once this is set up, the numbers surface on their own.
Here's what this guide covers:
- The campaign setup: how the email course was structured in Marketo
- Static lists for reporting: the cleanest way to track key milestones
- Connecting Marketo to Klipfolio: four steps, no guesswork
- Building the dashboard: formulas, tables, and formatting
1. The email course campaign in Marketo
The campaign was simple: sign up with your email, receive ten days of bite-sized lessons on KPIs for digital marketers. No sales pressure, no trial push. Just content worth paying for, delivered free.
The goal was to see how many subscribers would organically start a trial after getting real value first.
How the campaign was set up in Marketo
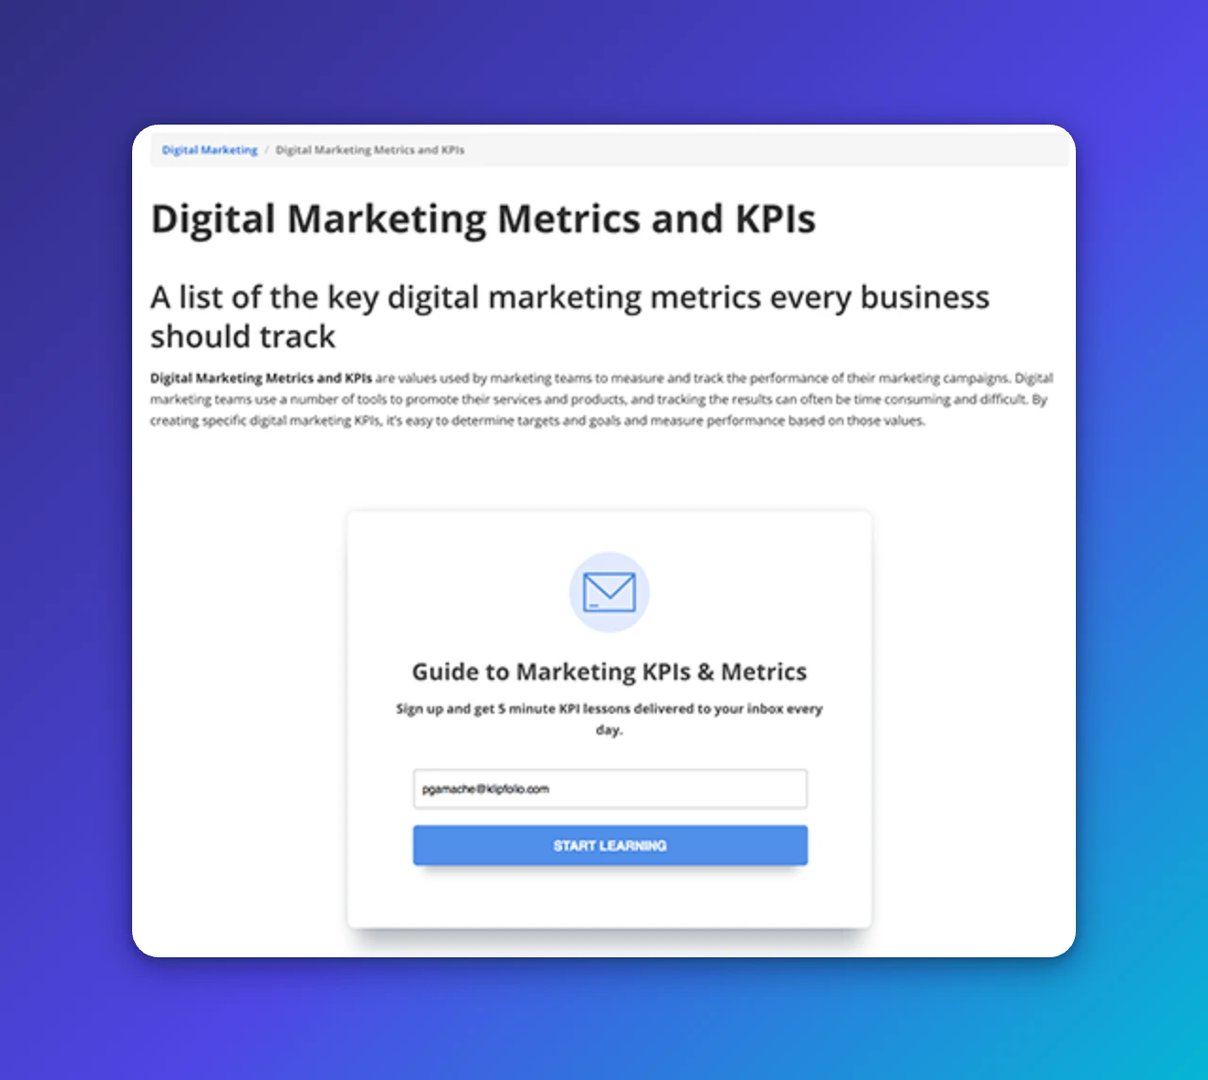
The site runs on Drupal. Landing pages are customized there, with Marketo handling the form logic. A simple iFrame in Drupal connects to the Marketo form URL.
2. Marketo logic: static lists for reporting key metrics
A smart campaign listens for leads who fill out the form (labelled as newsletter-subscription). After CASL double opt-in logic runs, leads are added to a static list called subscribers. The five-day email sequence triggers when someone lands on that list.
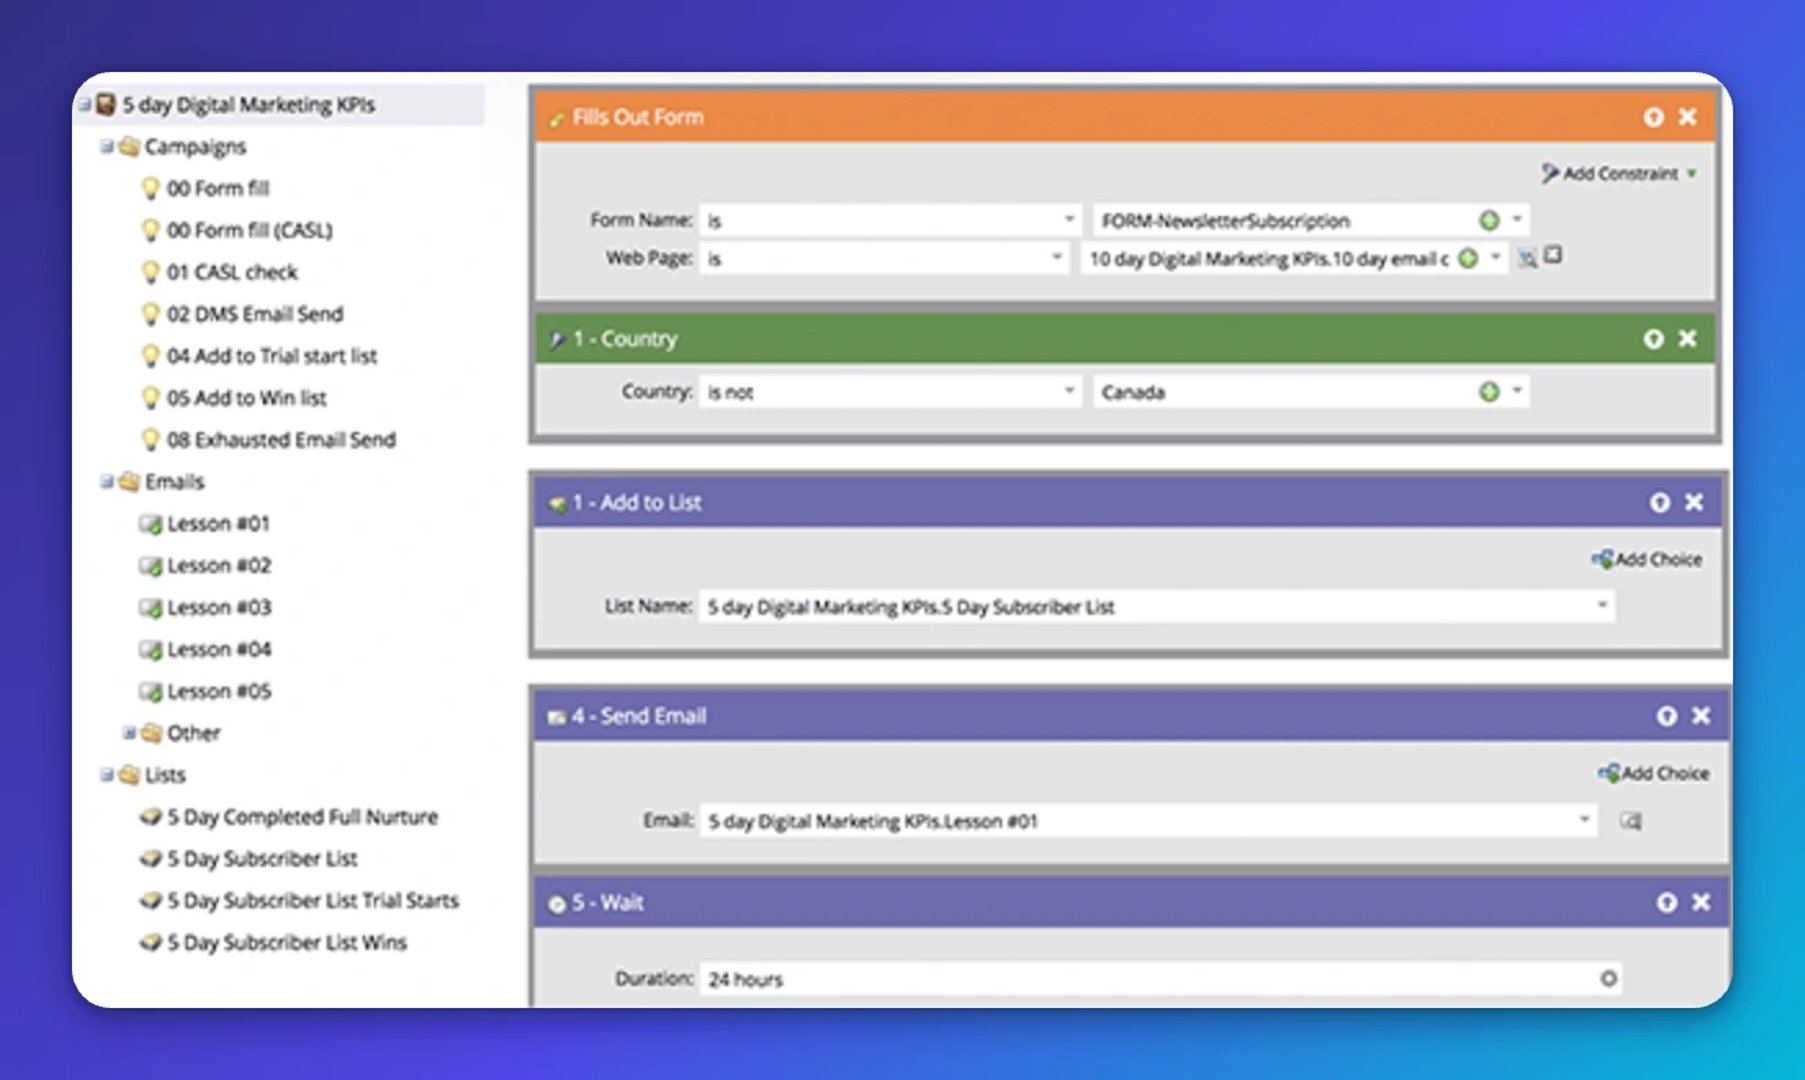
For reporting, three milestones matter: completing the nurture, starting a free trial from within the course, and converting to a paying customer. A smart campaign listens for each behavioural signal and moves leads to a dedicated static list. One list per milestone, easy to query.
Static lists load faster than smart lists and are much easier to pull via API. That matters when you're connecting to an external dashboard.
Create custom dashboards for you and your team.
Get started with Klips3. How to connect your Marketo data to a Klipfolio dashboard
Marketo has solid built-in analytics. But asking your CEO to log in and find the right report is not a workflow. Neither is pulling numbers manually every time someone asks.
The goal here is to get that data out of Marketo and onto a shared dashboard that updates automatically, so the answer is always there without anyone having to go looking for it.
Klipfolio has already done the work of mapping Marketo's static list API. It requires editing the request URL, but that's the extent of it. Marketo provides a rich list of fields you can query. For more detail, view this support article.
4 steps to connect Marketo to Klipfolio
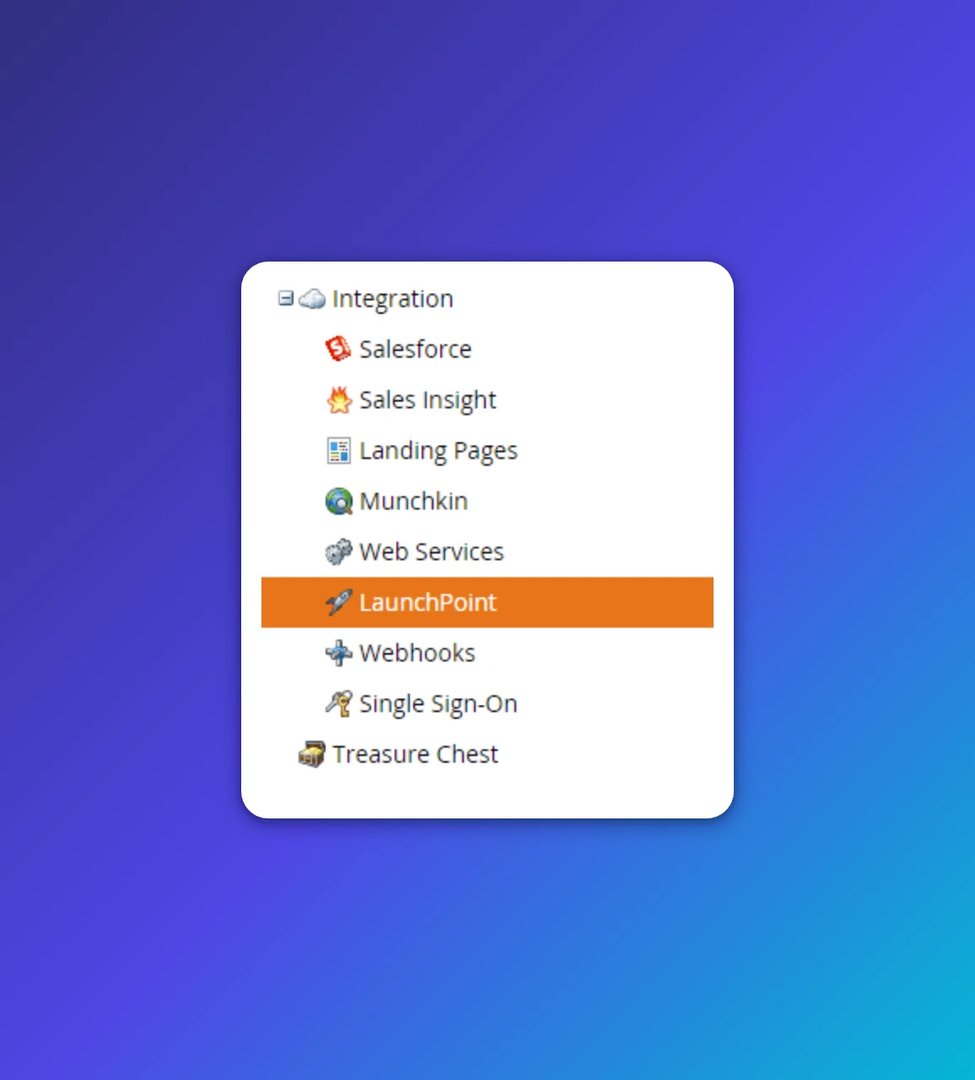
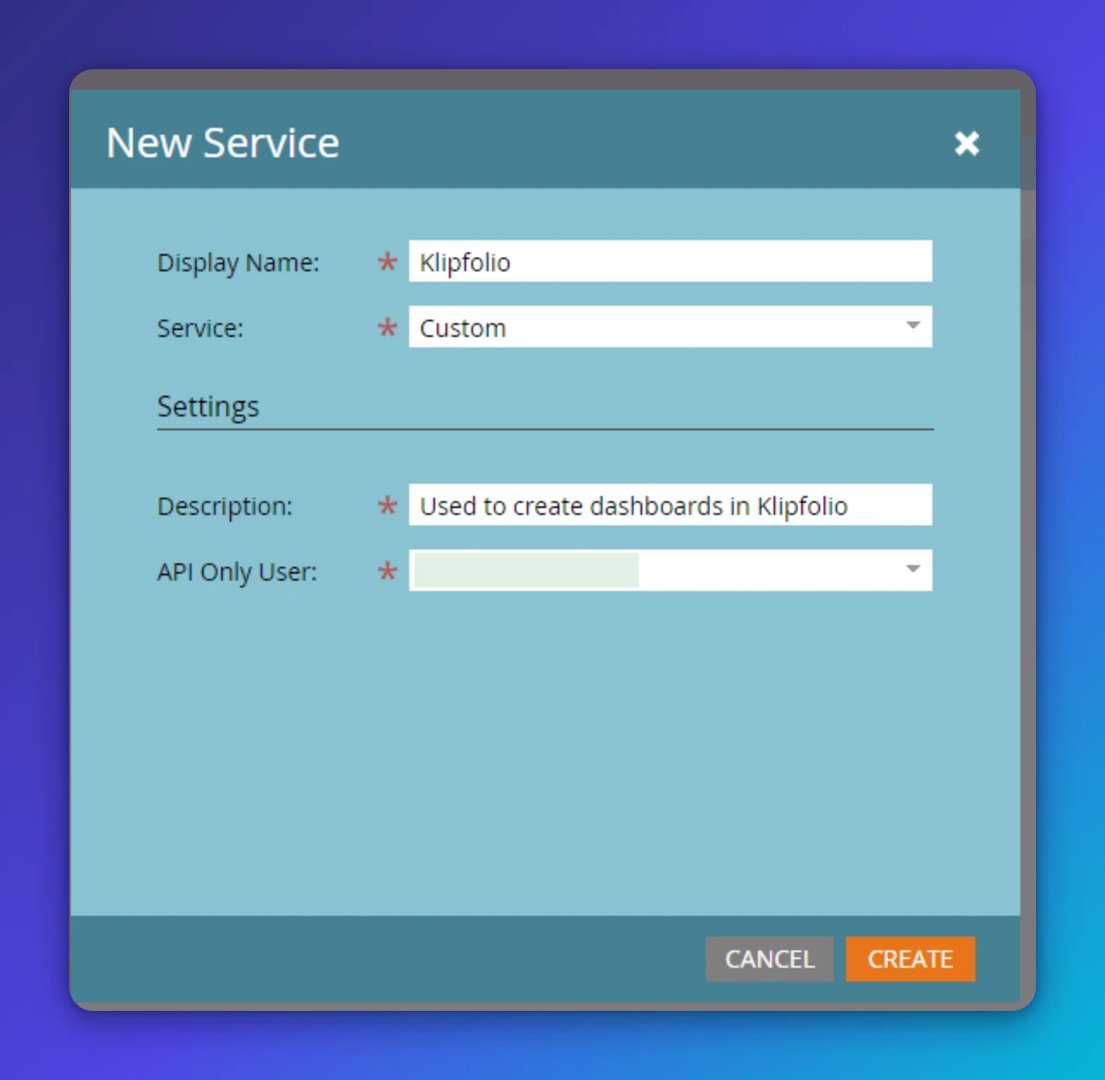
- Set up Klipfolio as a LaunchPoint service in Marketo. Go to Admin > LaunchPoint icon > New Service. Copy the client ID and client secret to a notepad.
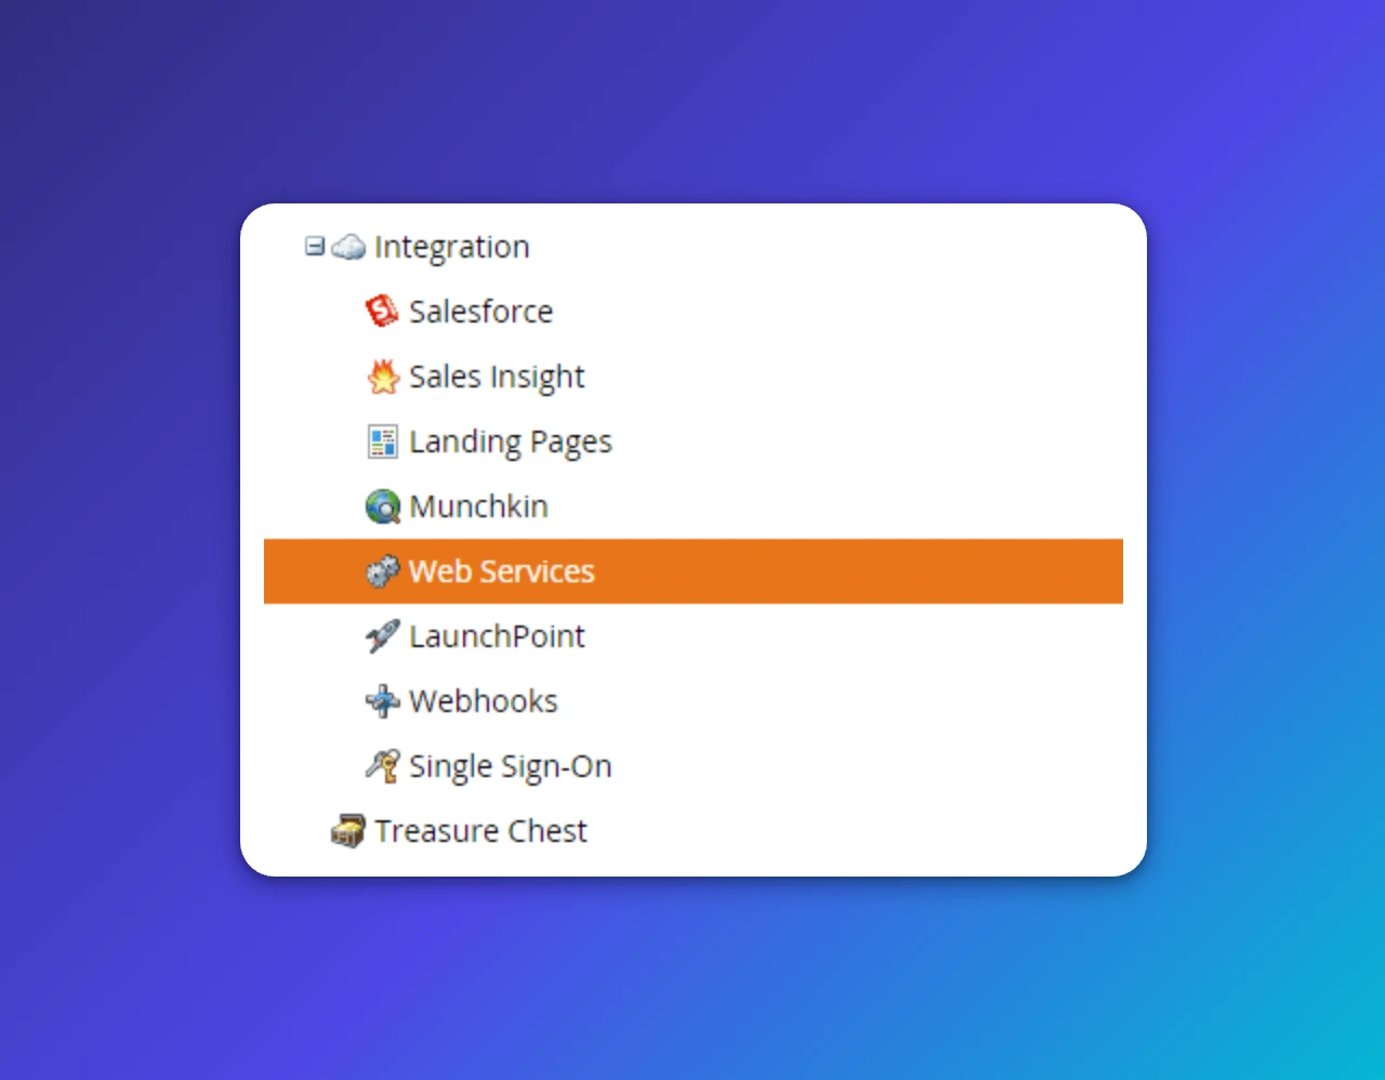
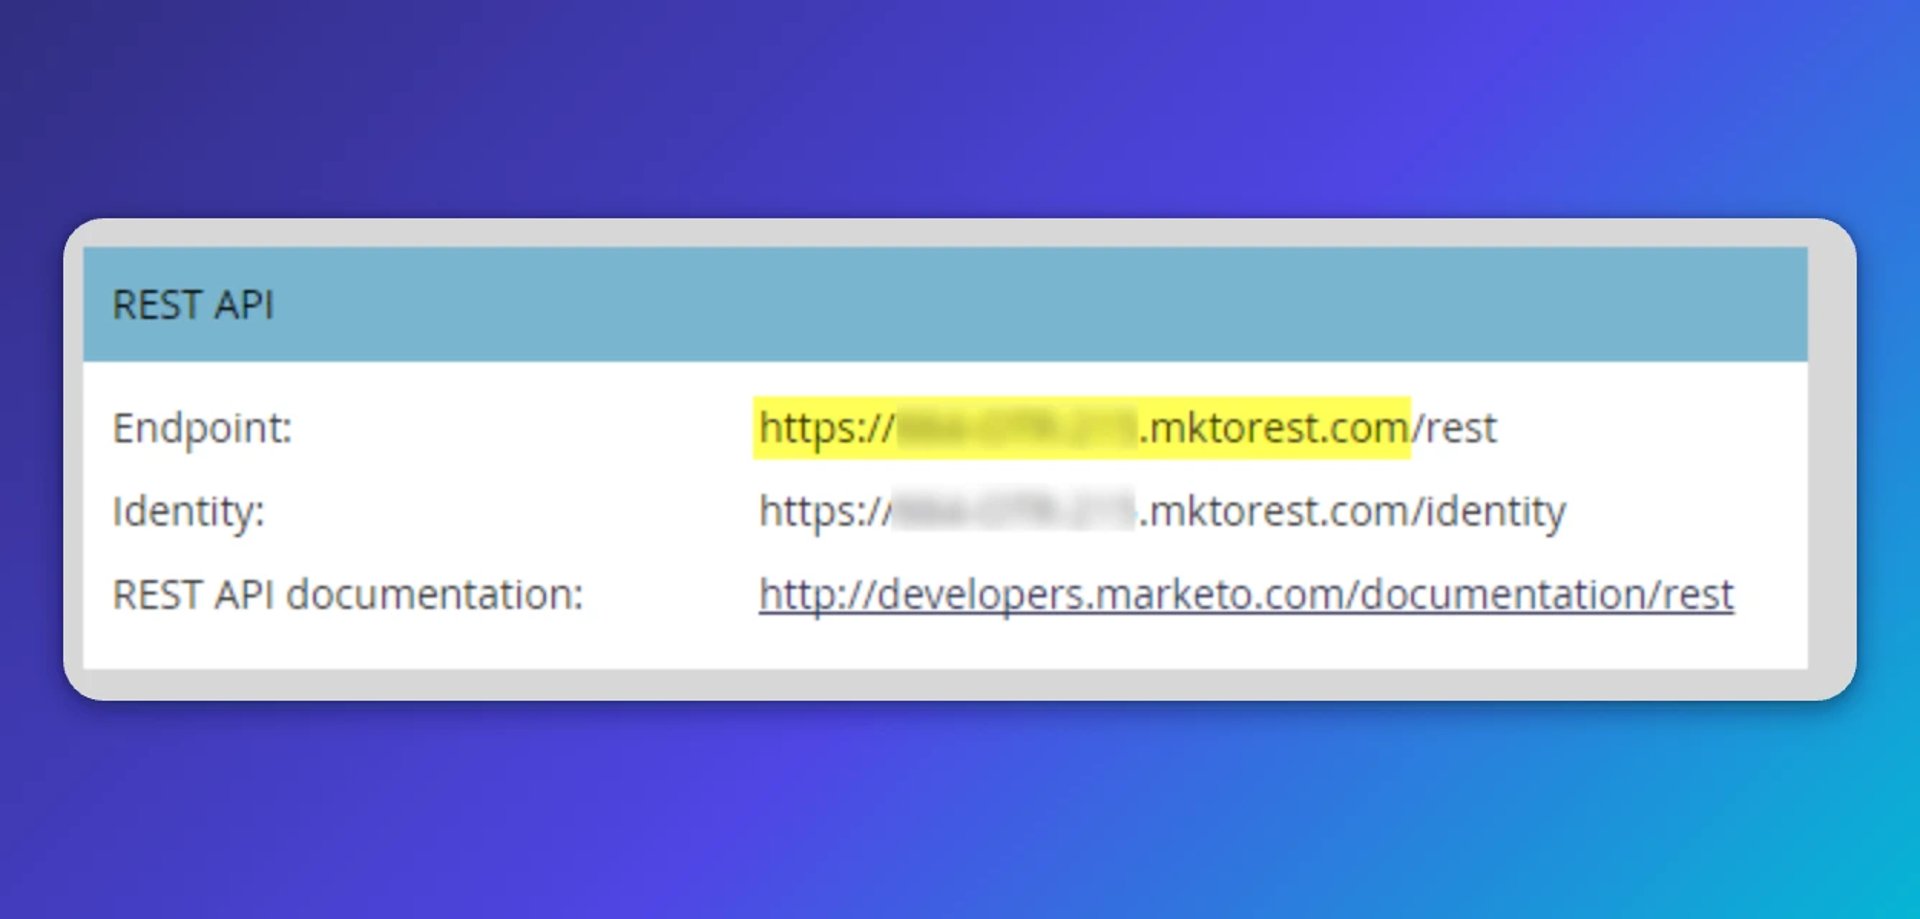
- Find your URLs. Your REST API Identity URL and REST API Endpoint URL are in Marketo under Admin > Web Services.
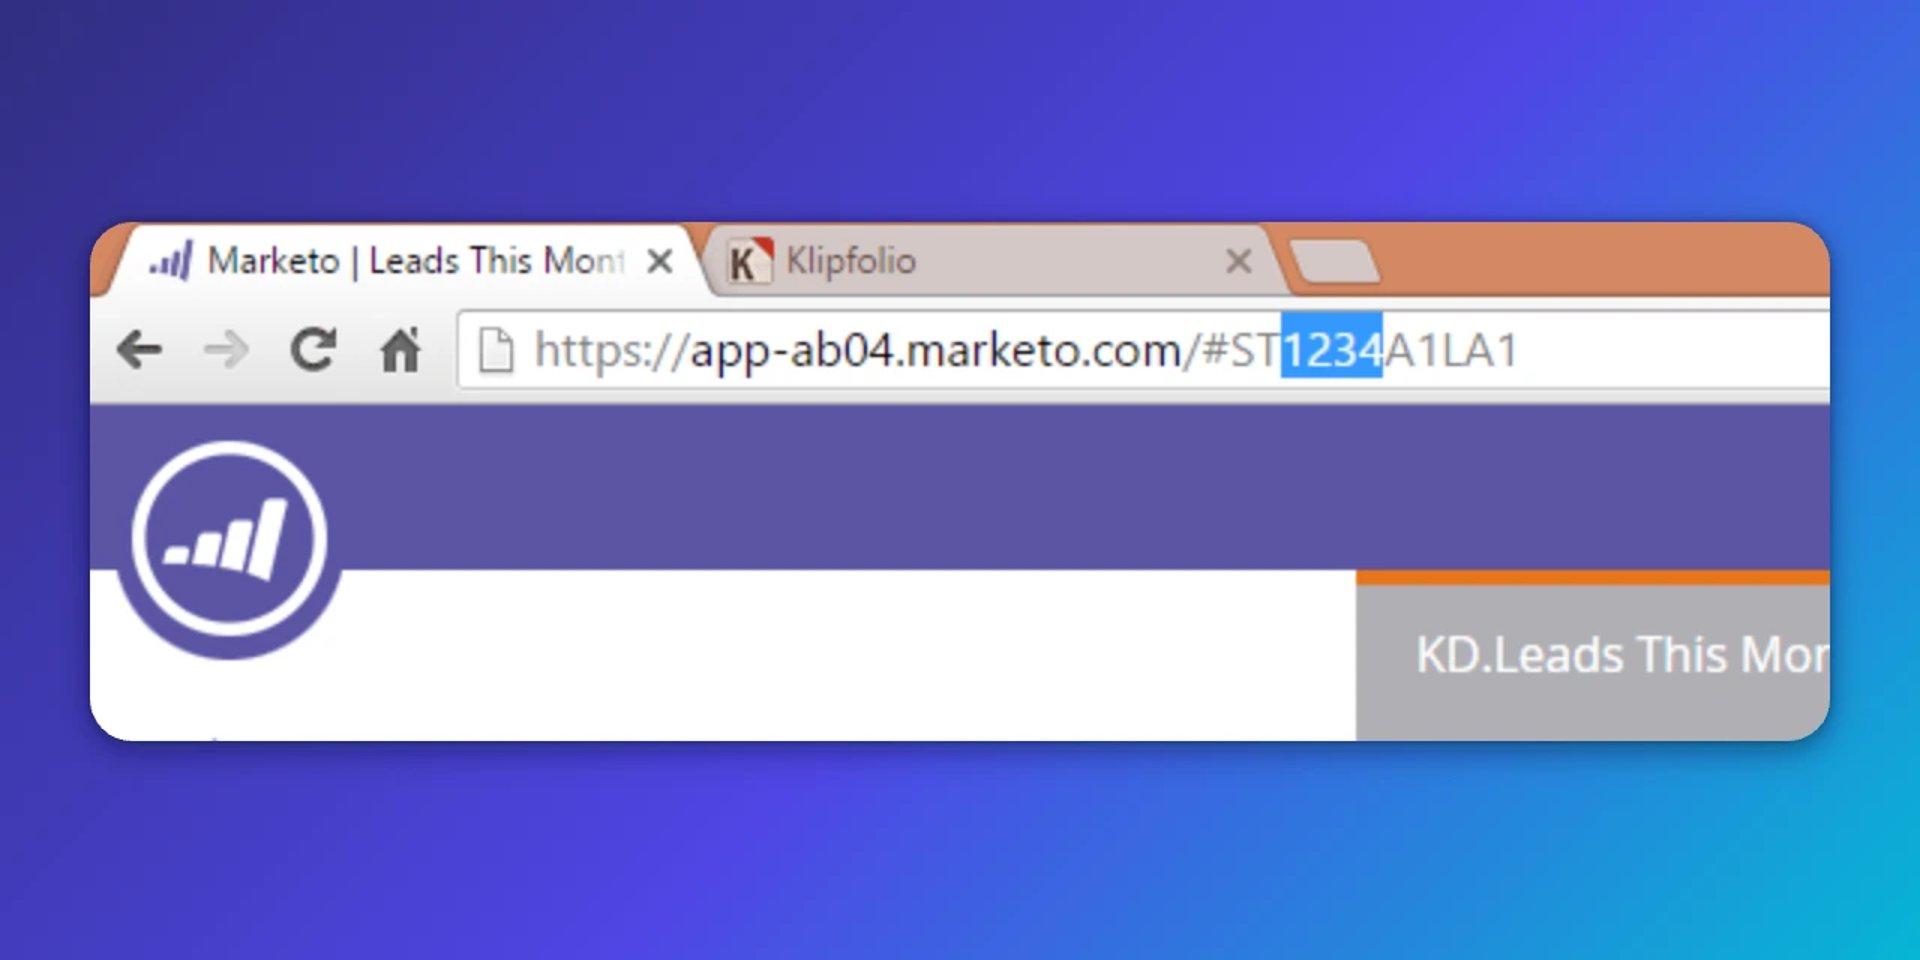
The unique ID for your static list is the four-digit number after "ST" in the URL shown in your browser's address bar. Save that to your notepad too.
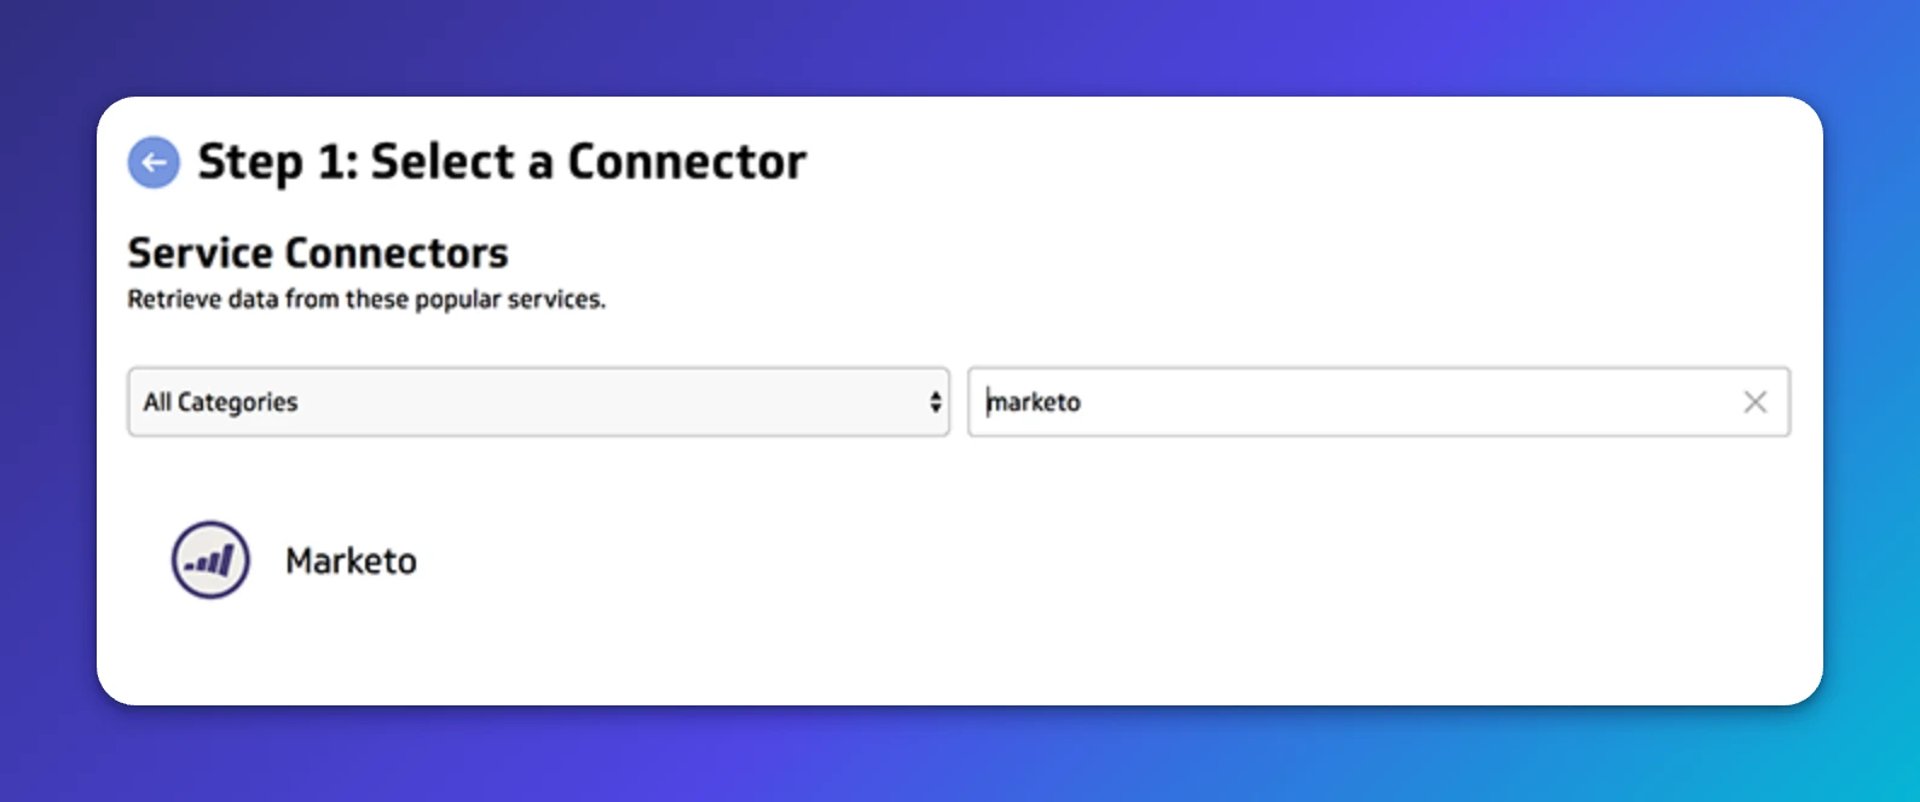
- Create a data source in Klipfolio. In your Klipfolio account, go to Library > Data Sources and create a new one. Select Marketo from the connector list and enter the values you saved.
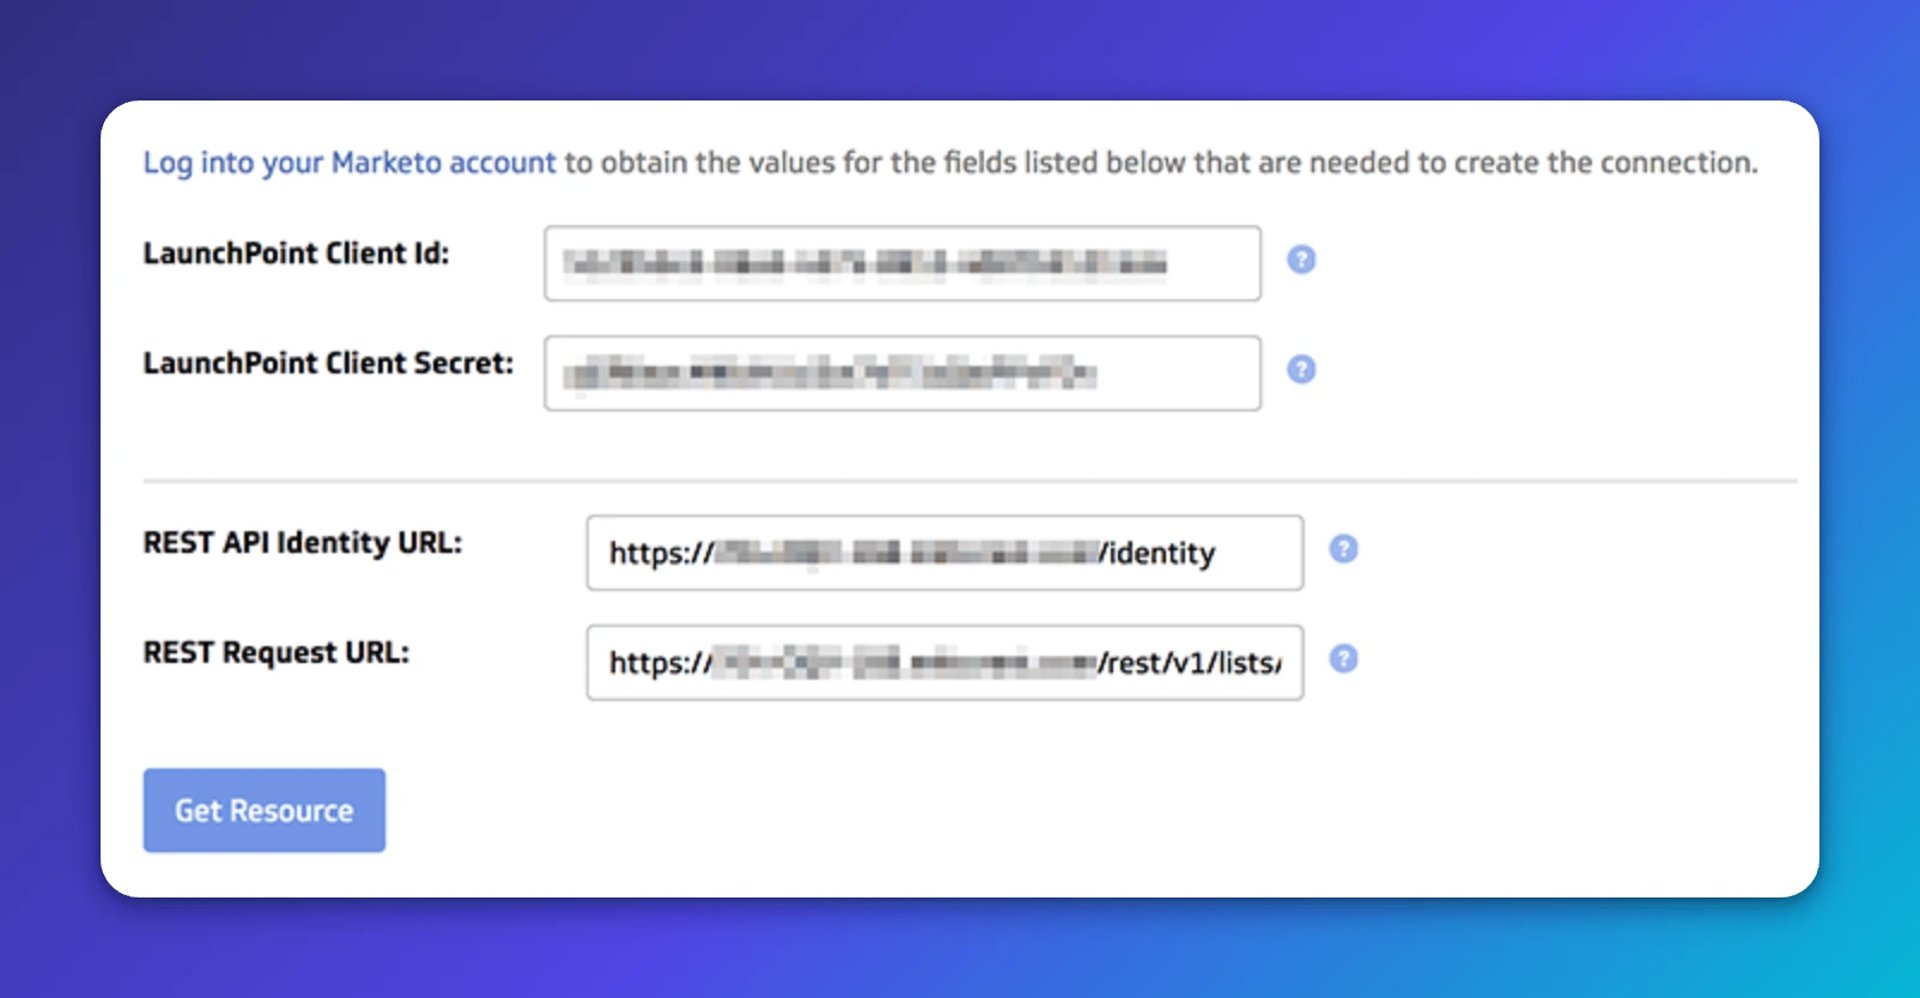
For the REST request URL, format it like this:
https://614-OQV-361.mktorest.com/rest/v1/list/{uniqueID}/leads.json
- Modify the request to pull the fields you need. Add additional fields to the URL, for example:
https://614-OQV-361.mktorest.com/rest/v1/list/2269/leads.json?fields=firstname,lastname,email,leadScore
Select Get Resource.
Your static list is now connected to Klipfolio. To connect your other lists, duplicate the data source and swap out the list number in the URL.
4. How to build your Marketo dashboard
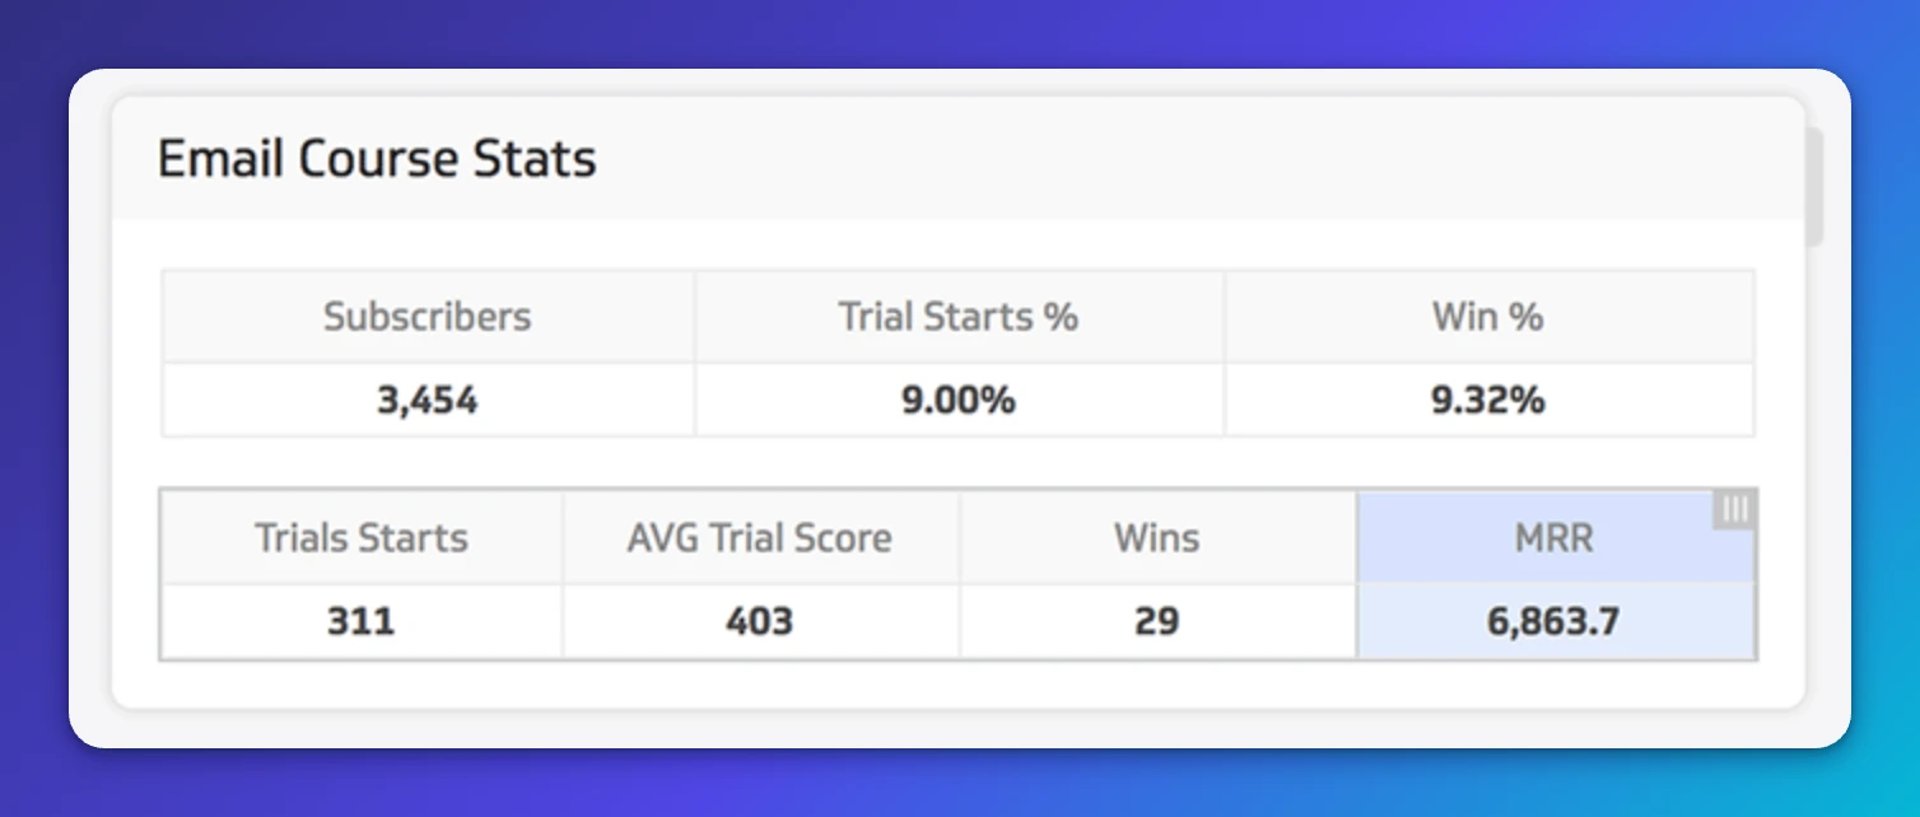
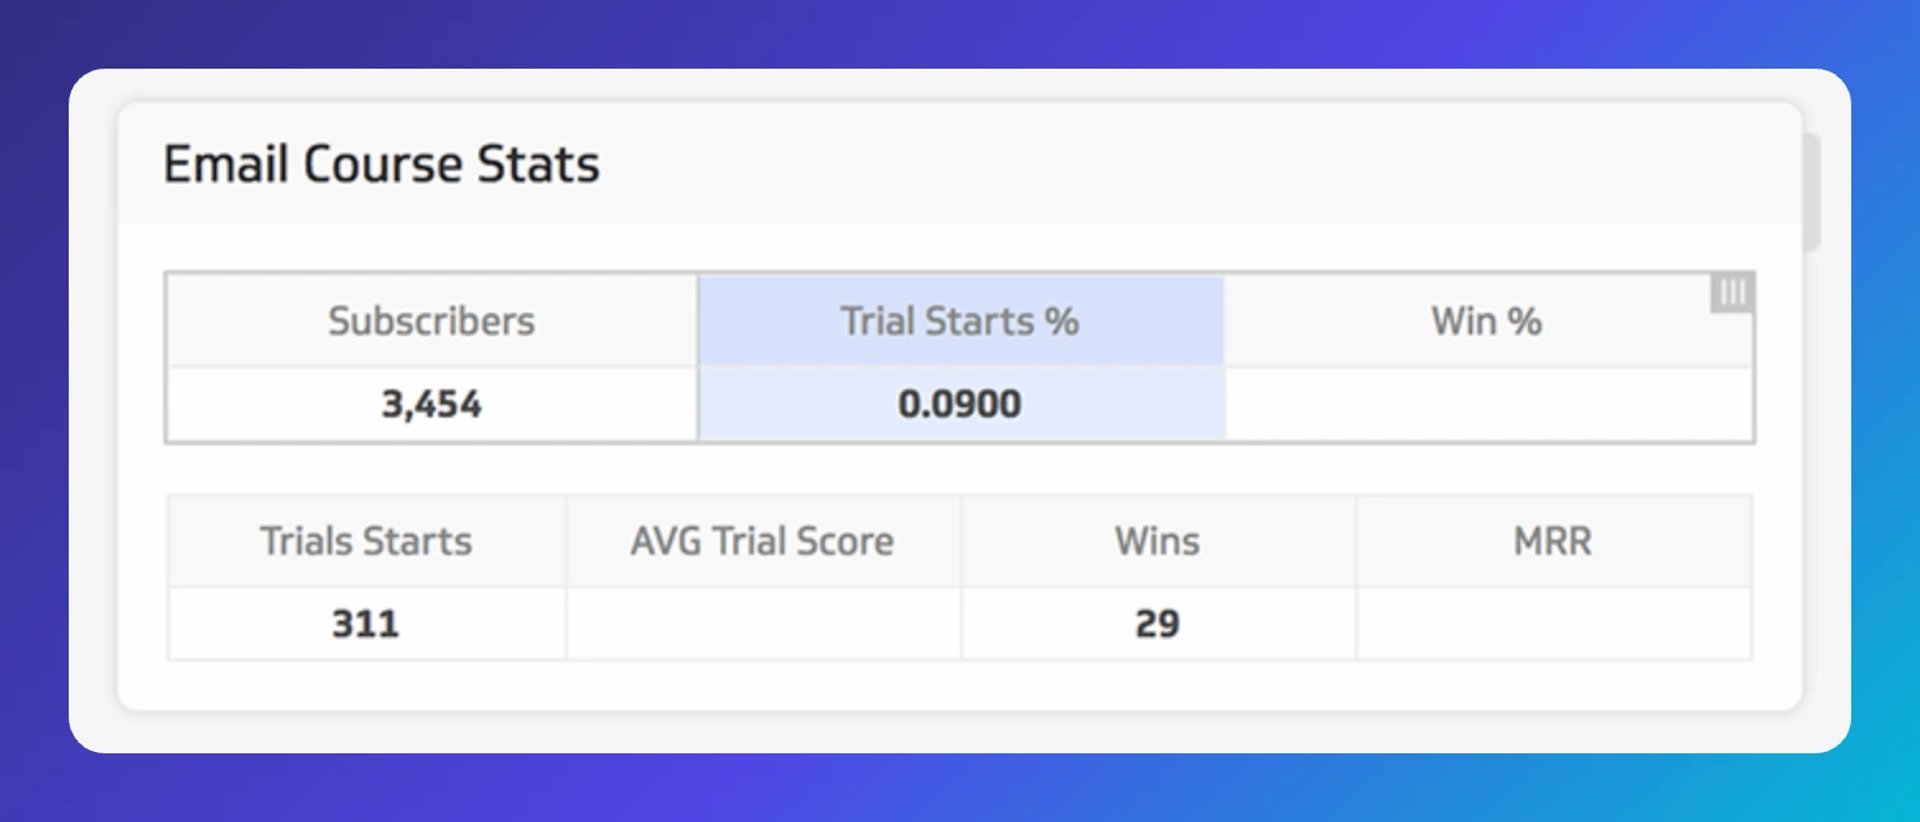
This is where the payoff becomes visible. With Marketo connected, you can build a table that shows, at a glance, how the email course campaign performed end-to-end: subscribers, trial start rate, average trial score, win rate, and MRR contribution.
No one has to log into Marketo. No one has to ask you to pull the numbers. The answer is already there.
In your Klipfolio dashboard, click "Add a Klip" and then "Build a Custom Klip."


From the chart options on the right, select the Table component and drag it into your Klip.
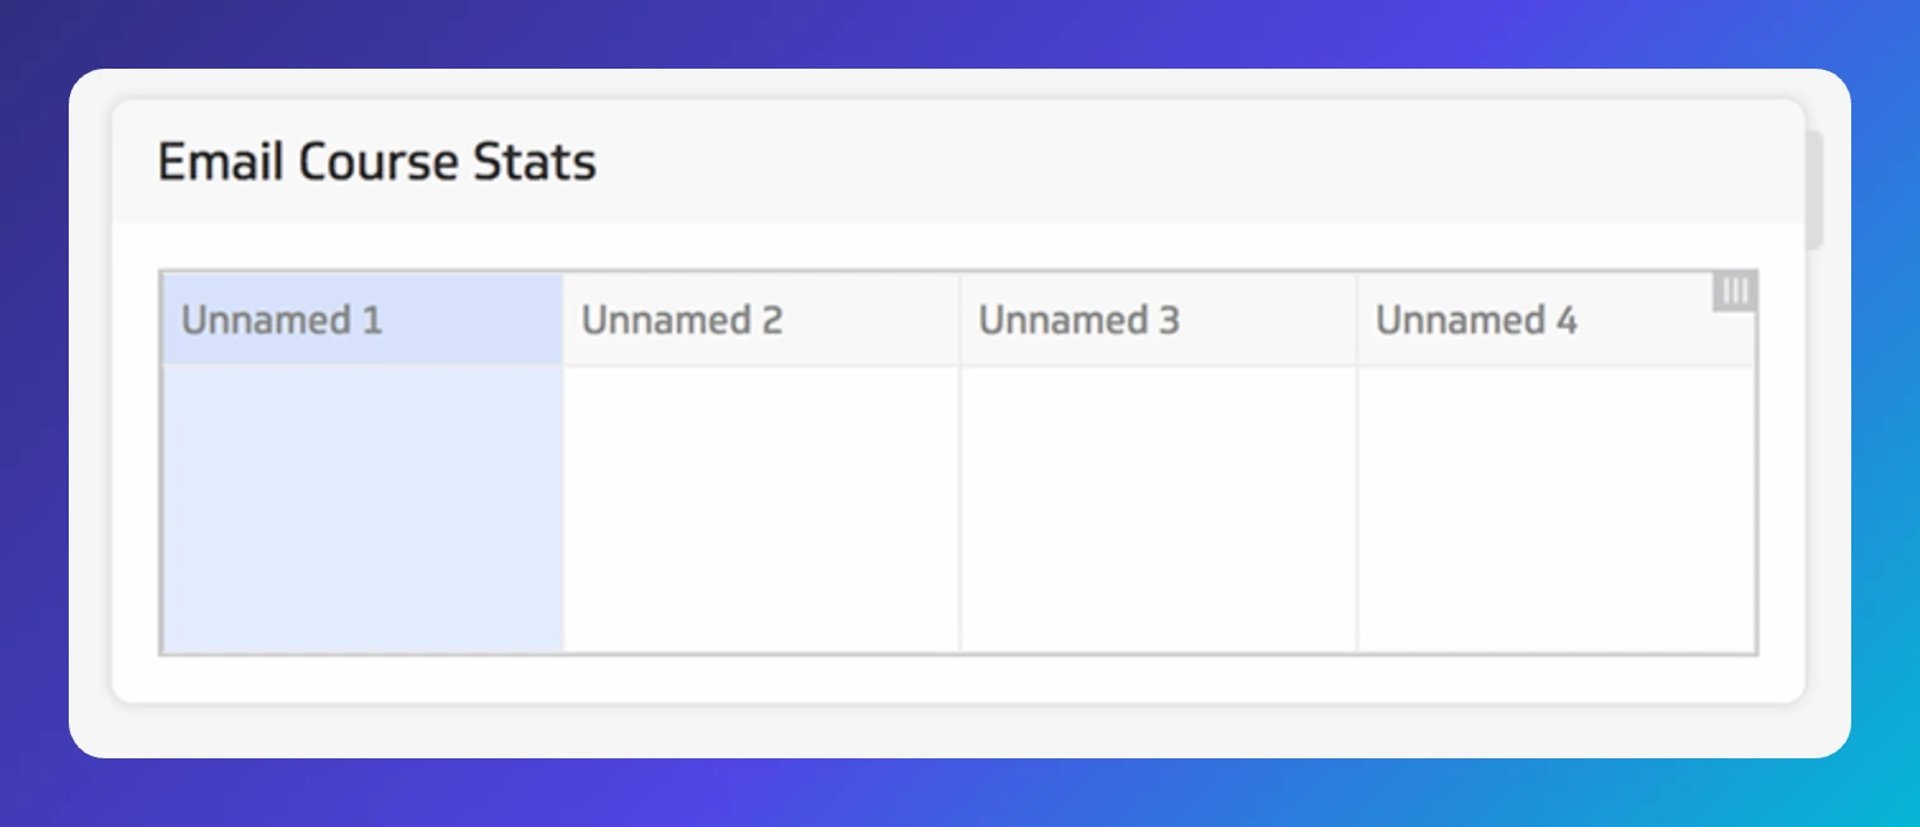
Under table properties, set the number of columns to 3 and name them: Subscribers, Trial Start %, and Win %. Adjust formatting and font style on the column headers as needed. You'll build a second table for deeper metrics the same way.
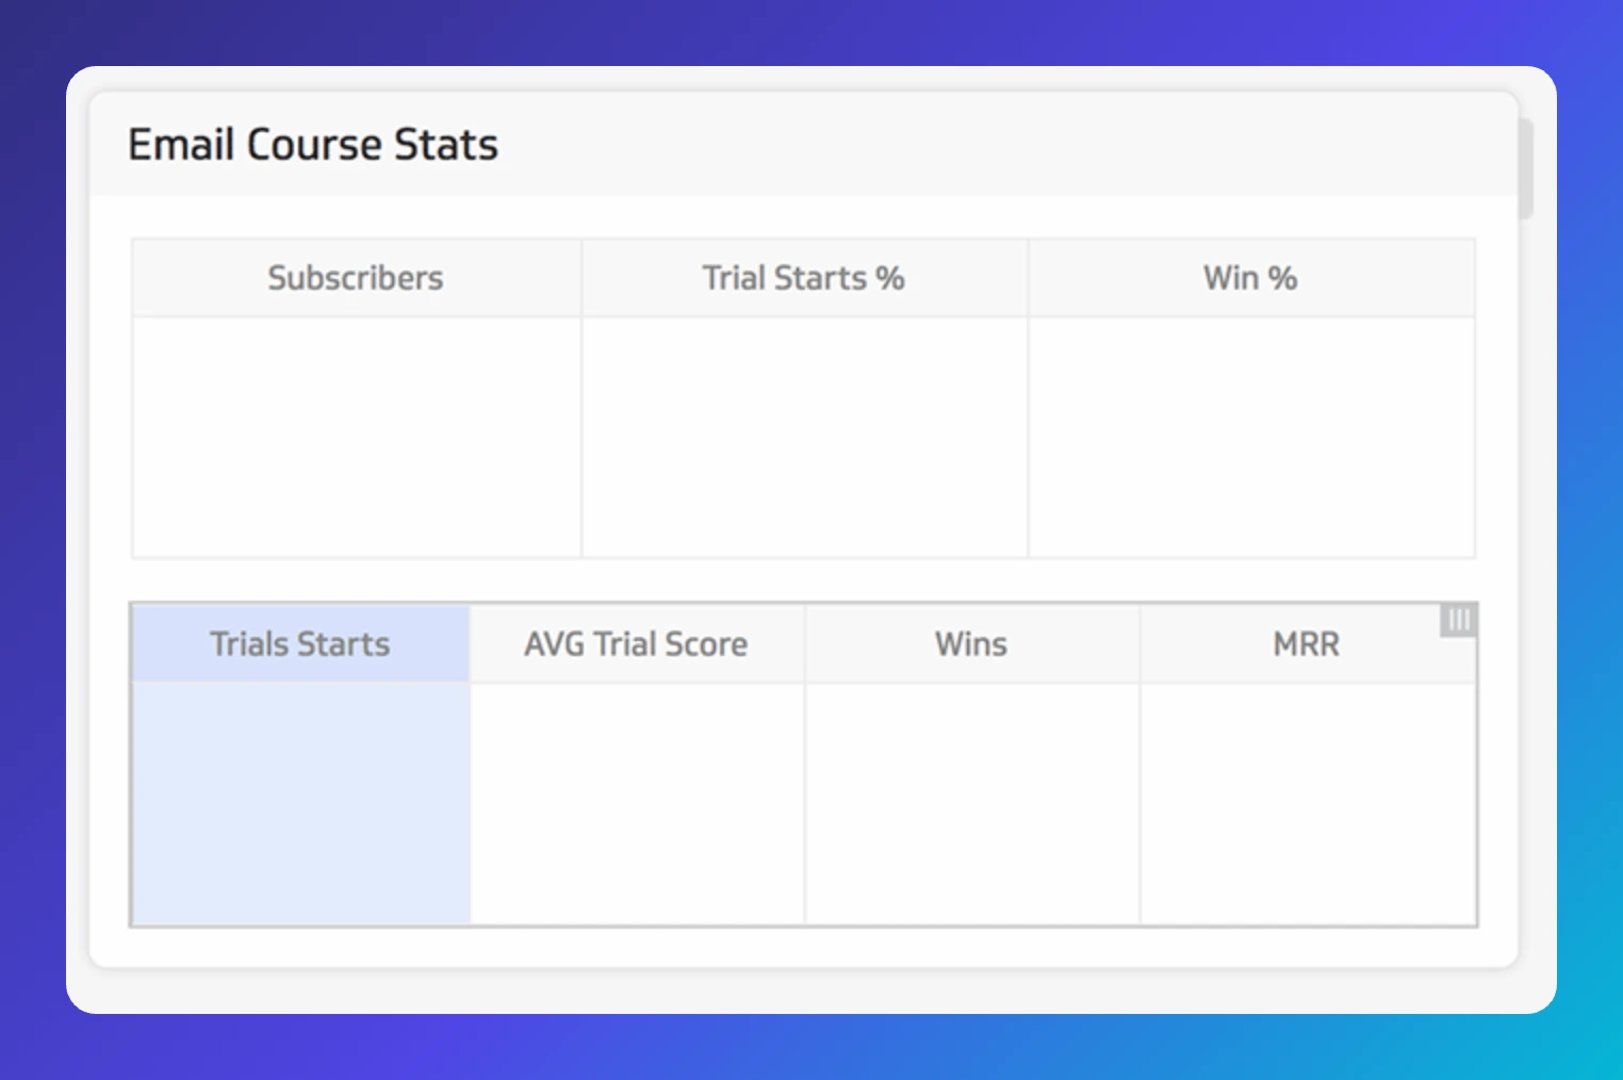
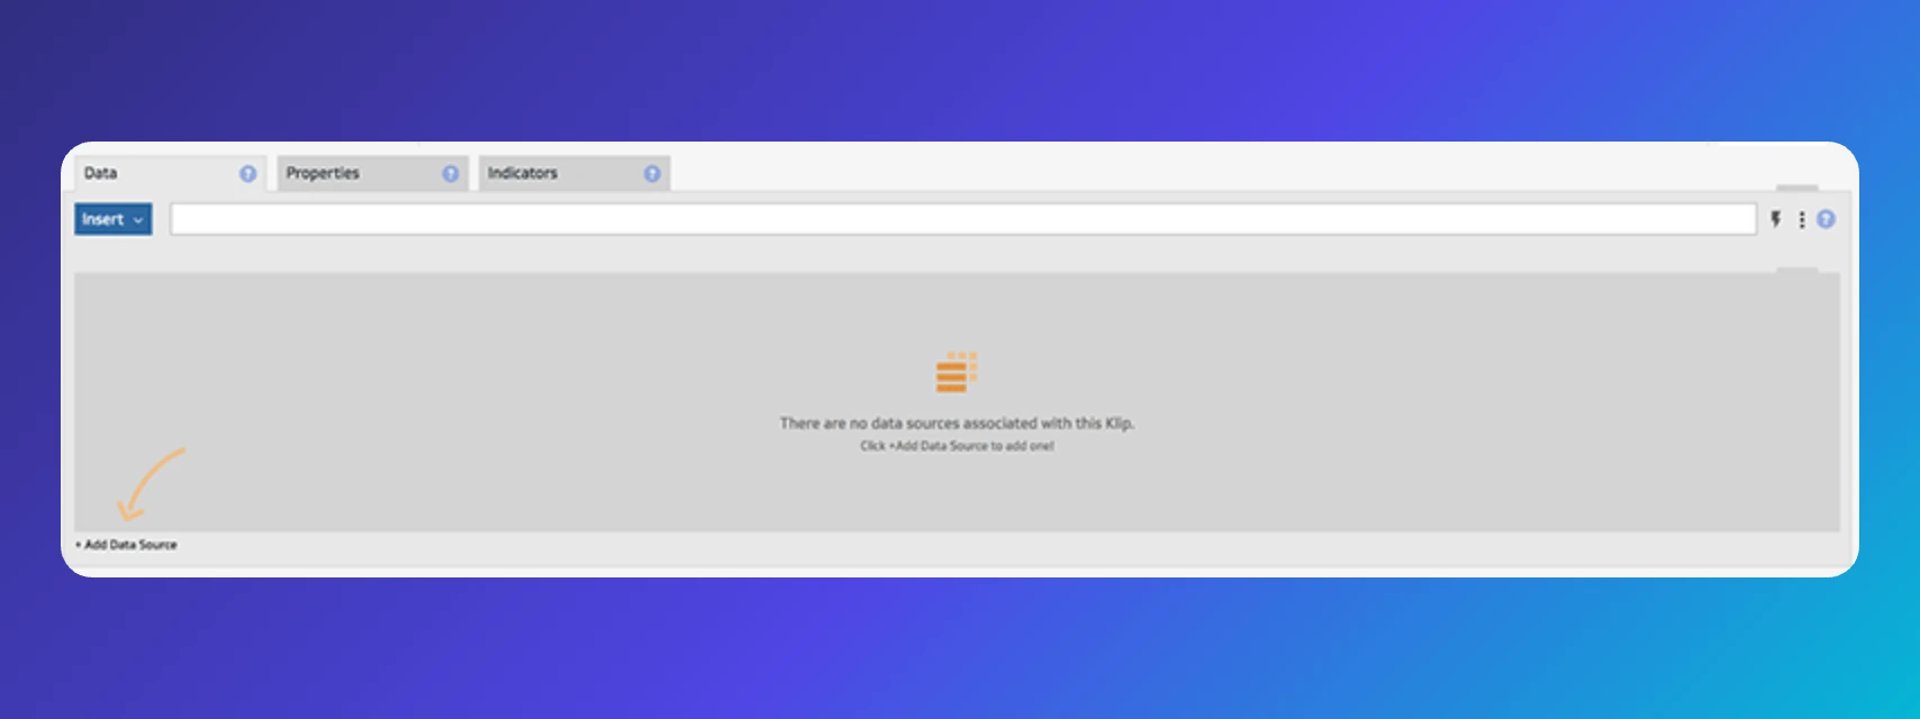
Select the Subscribers column, then go to the Data tab. Click "+ Add Data Source" at the bottom left corner.
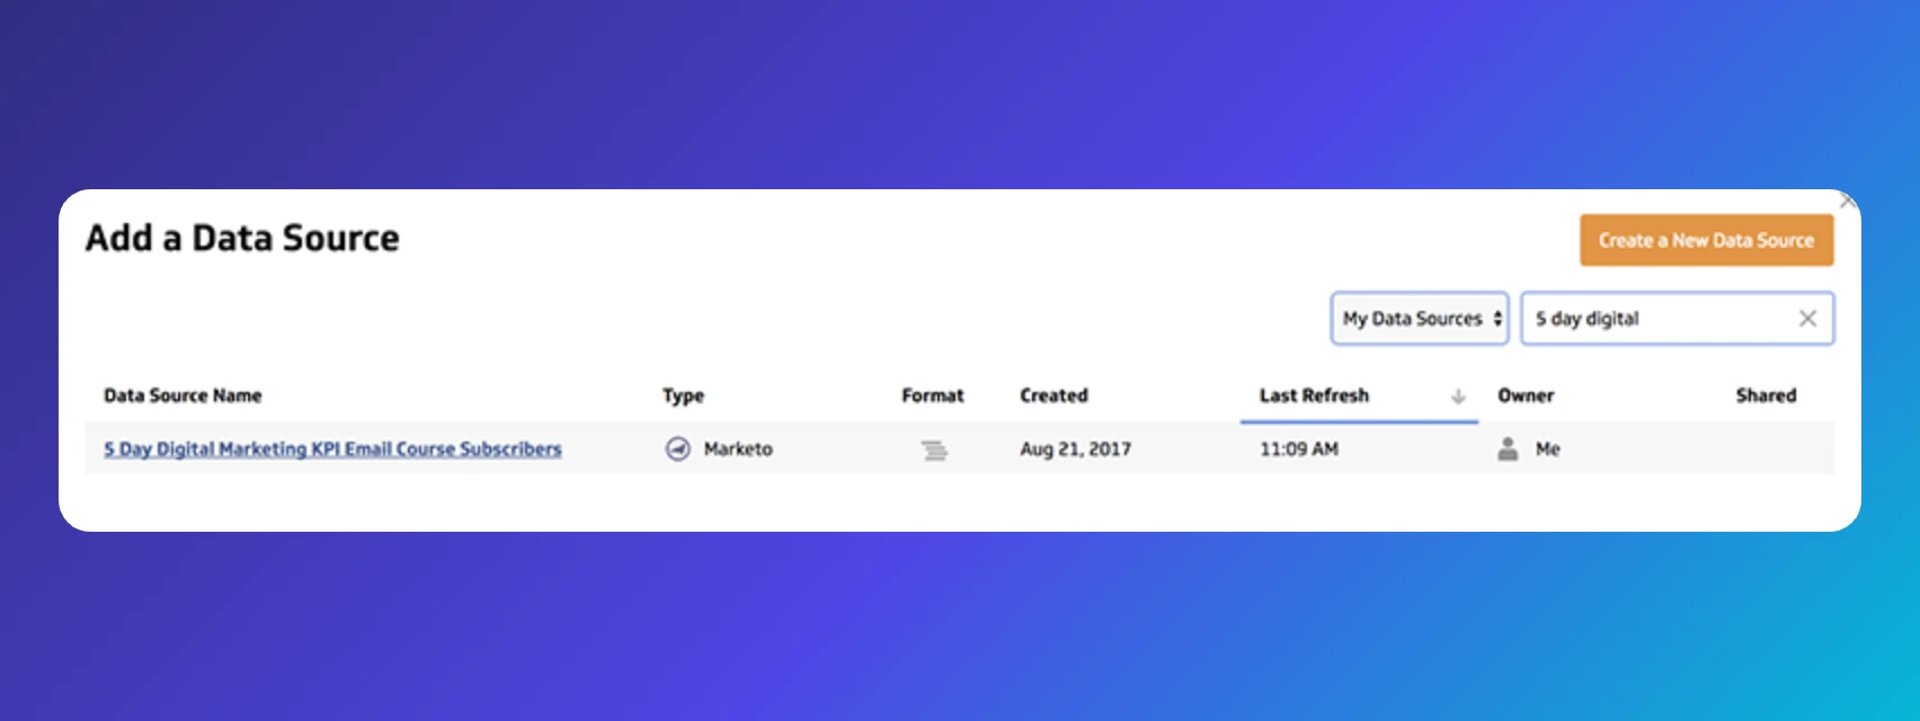
Find the data source you created and select it.
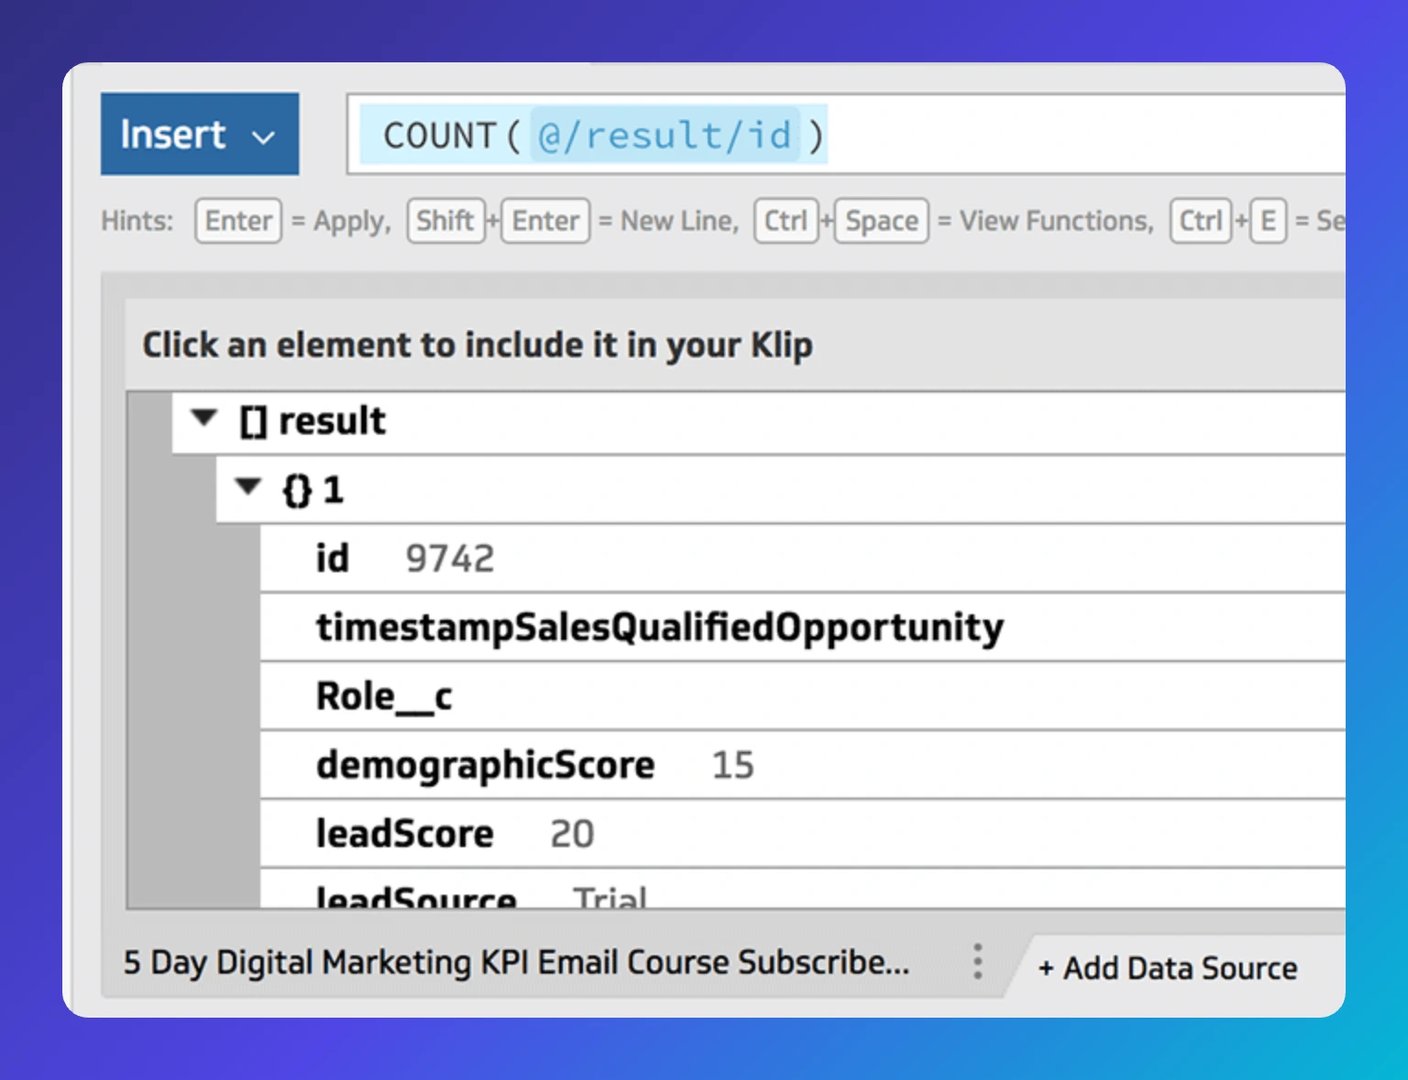
Your data source appears at the bottom left in JSON format. In the formula bar, type "Count" and select the COUNT function.
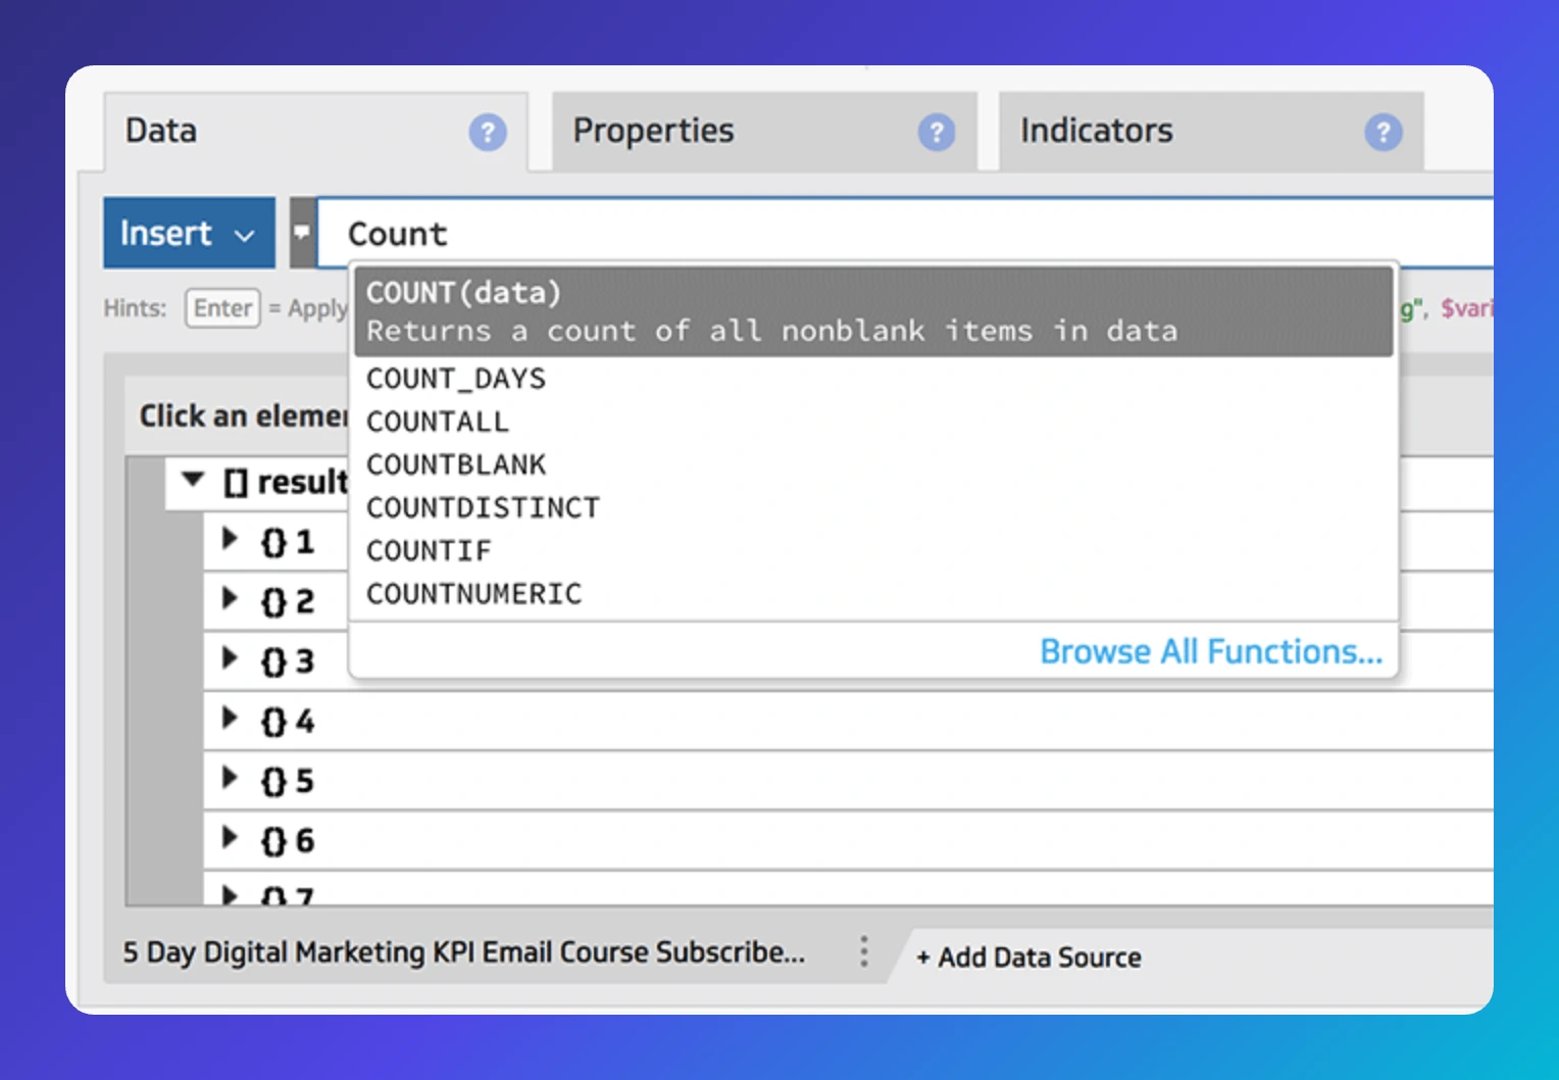
Expand your JSON results, then expand the first result and click the first "id" field. The formula bar updates to COUNT(@/result/id;) and your table shows the total subscriber count.
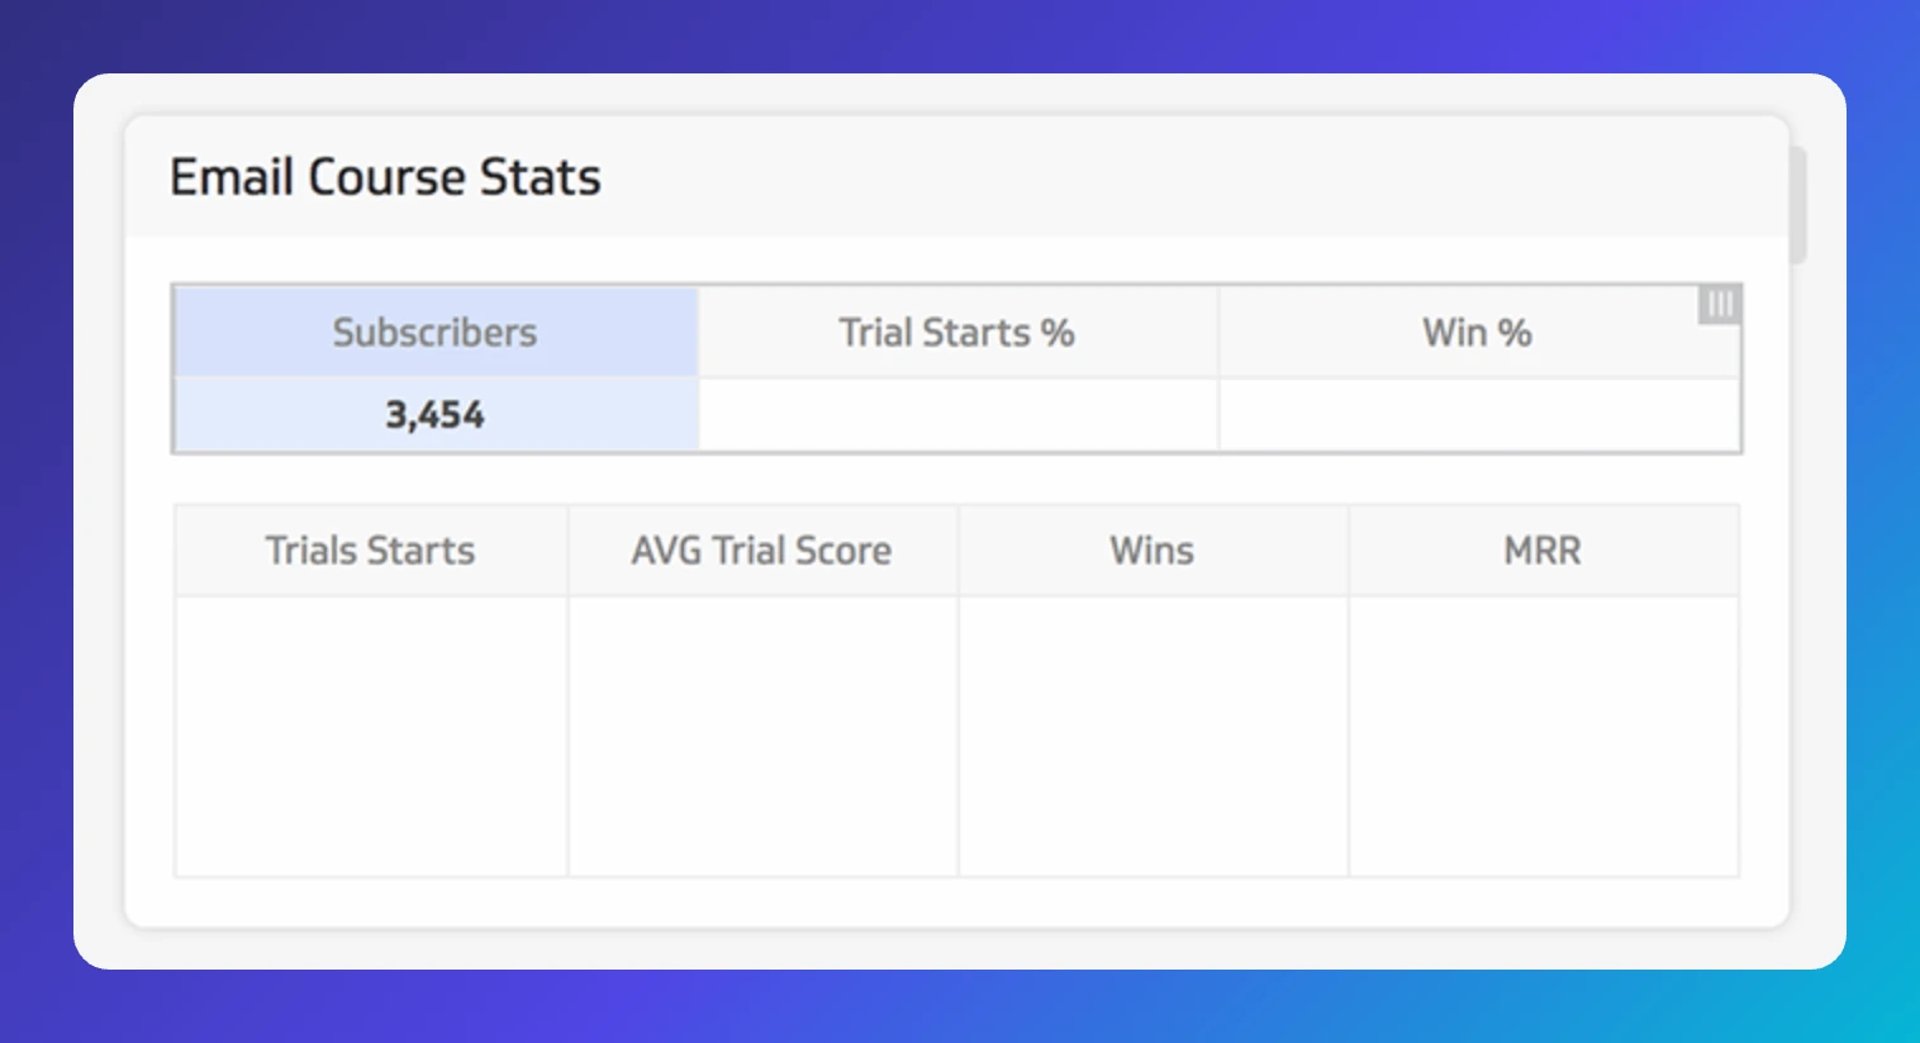
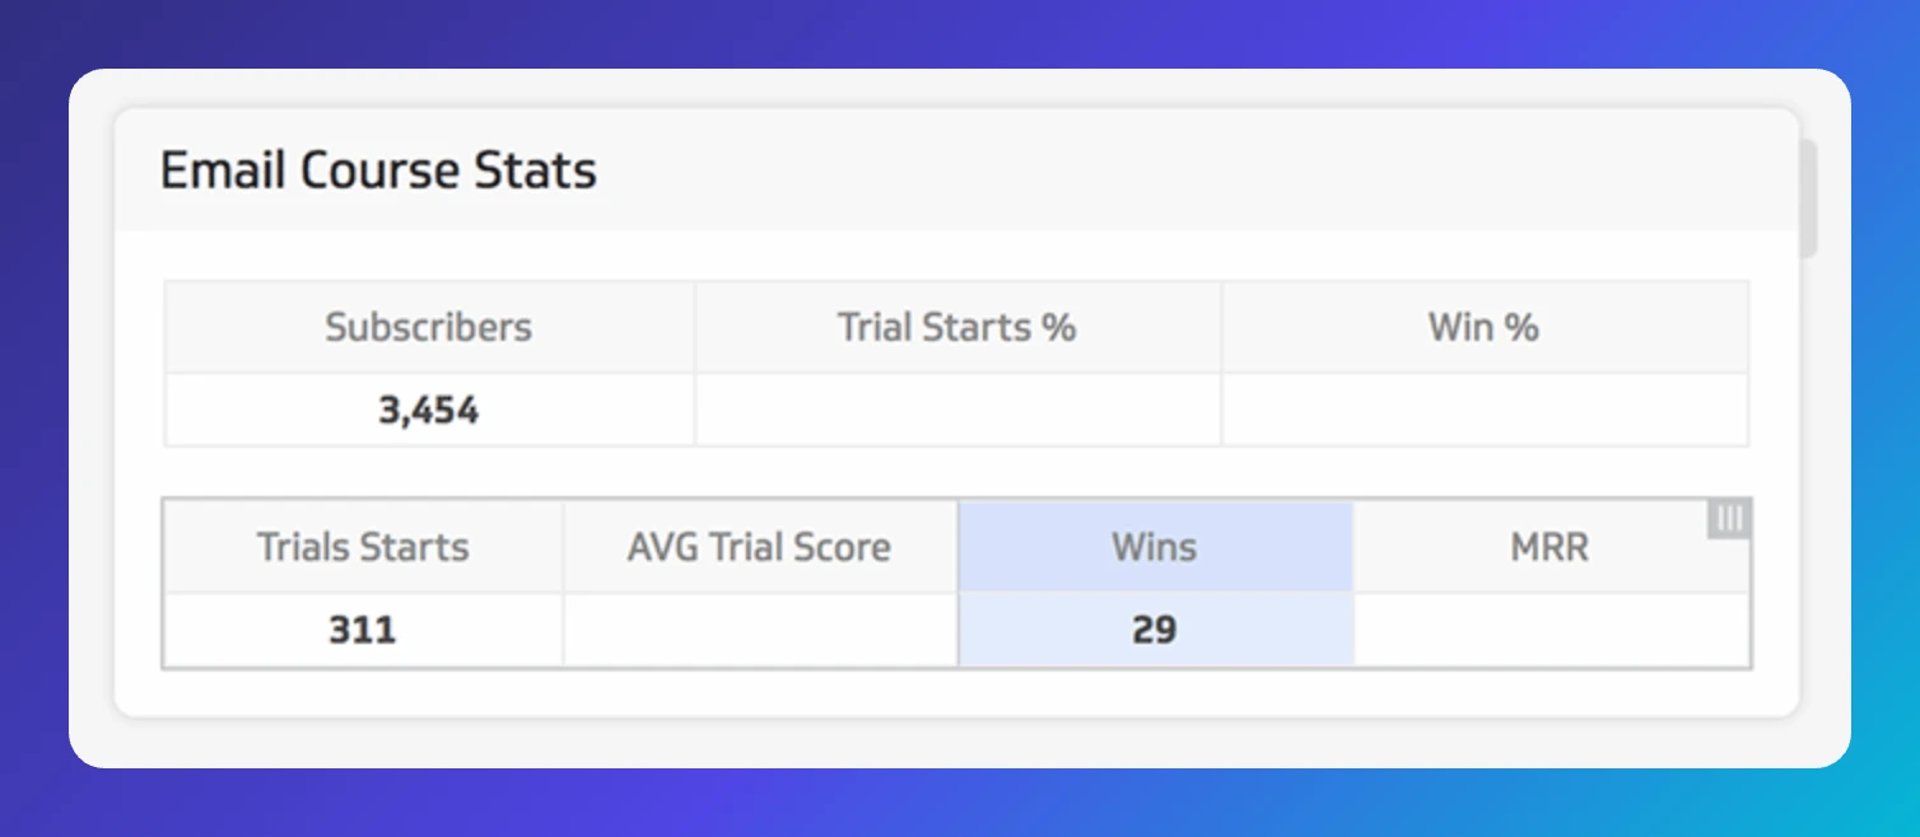
Add your two remaining data sources: one for Trial Starts, one for Wins.
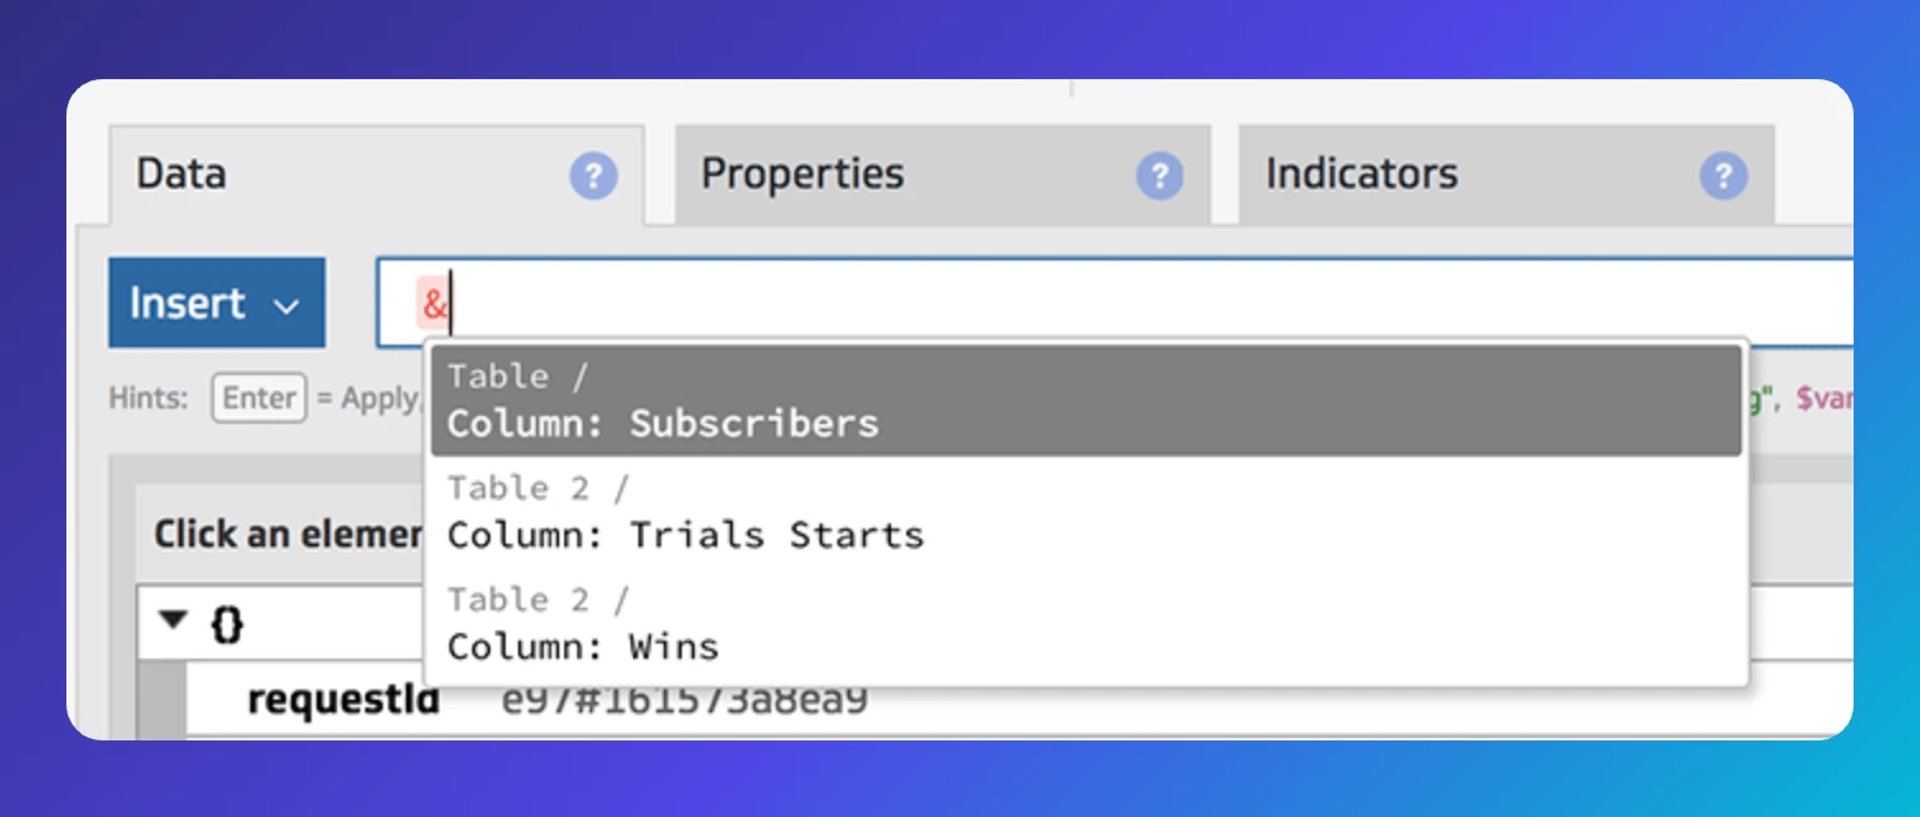
For Trial Start %, type the reference character "&" in the formula bar, select Trial Starts, and divide by a reference to Subscribers.
Your formula should look like this:
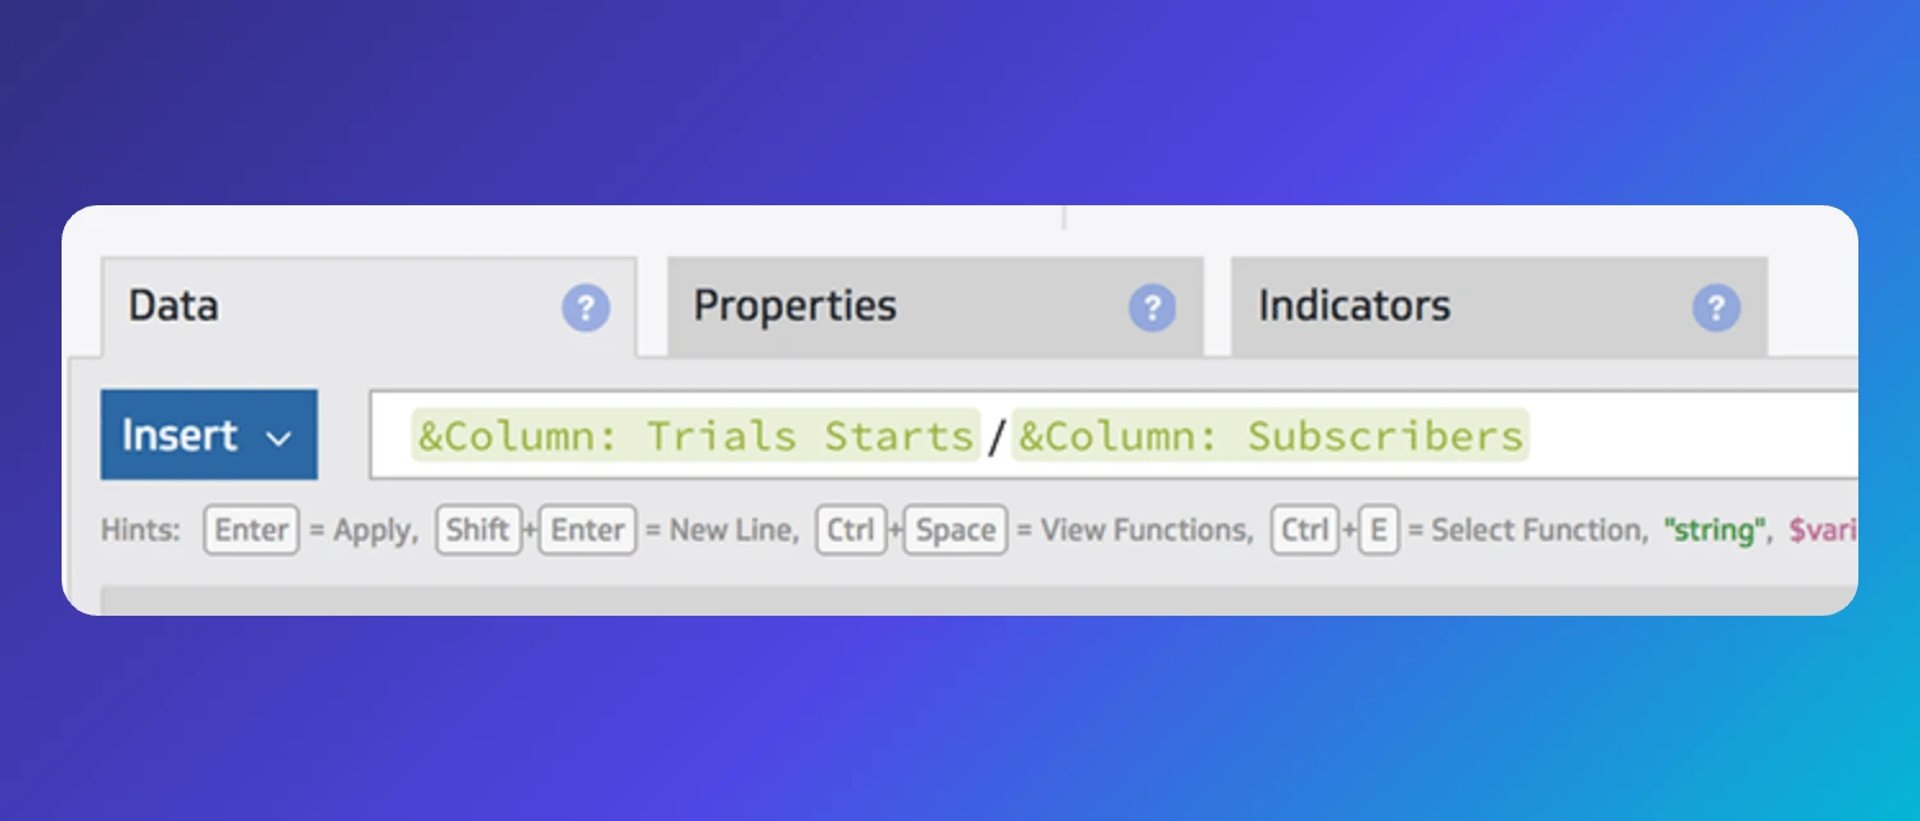
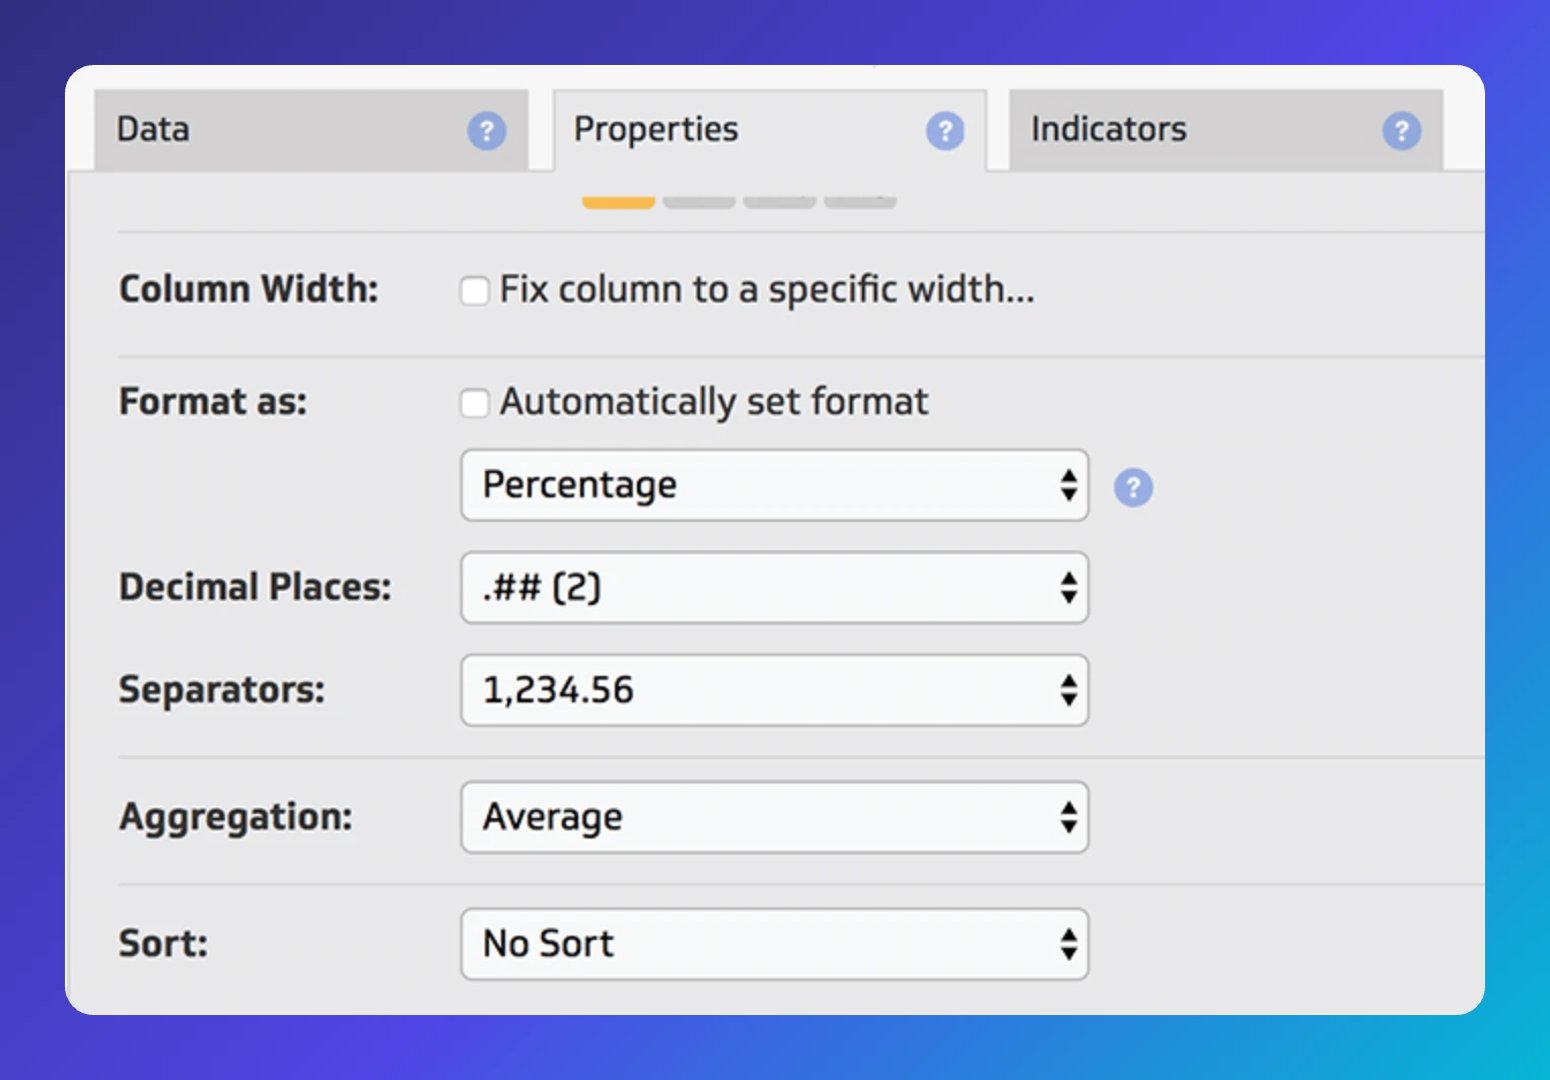
The raw number won't display as a percentage yet.
Fix that in the Properties tab: uncheck "Automatically set format," select Percentage, and set your preferred decimal places.
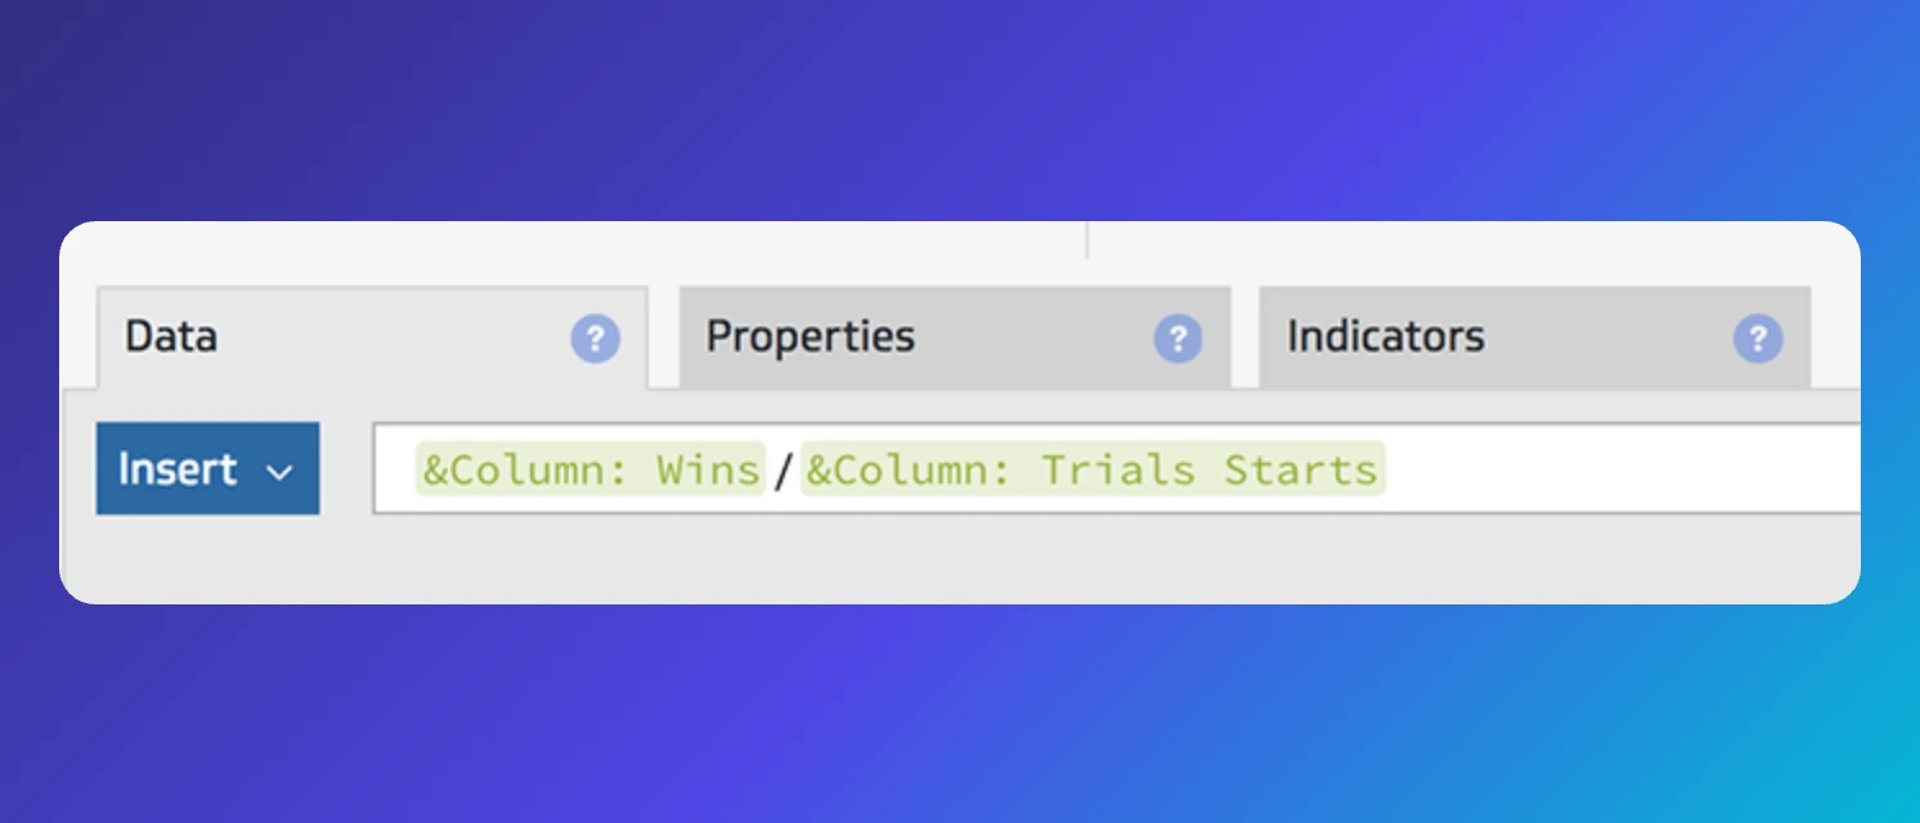
Apply the same approach to the Win % column:
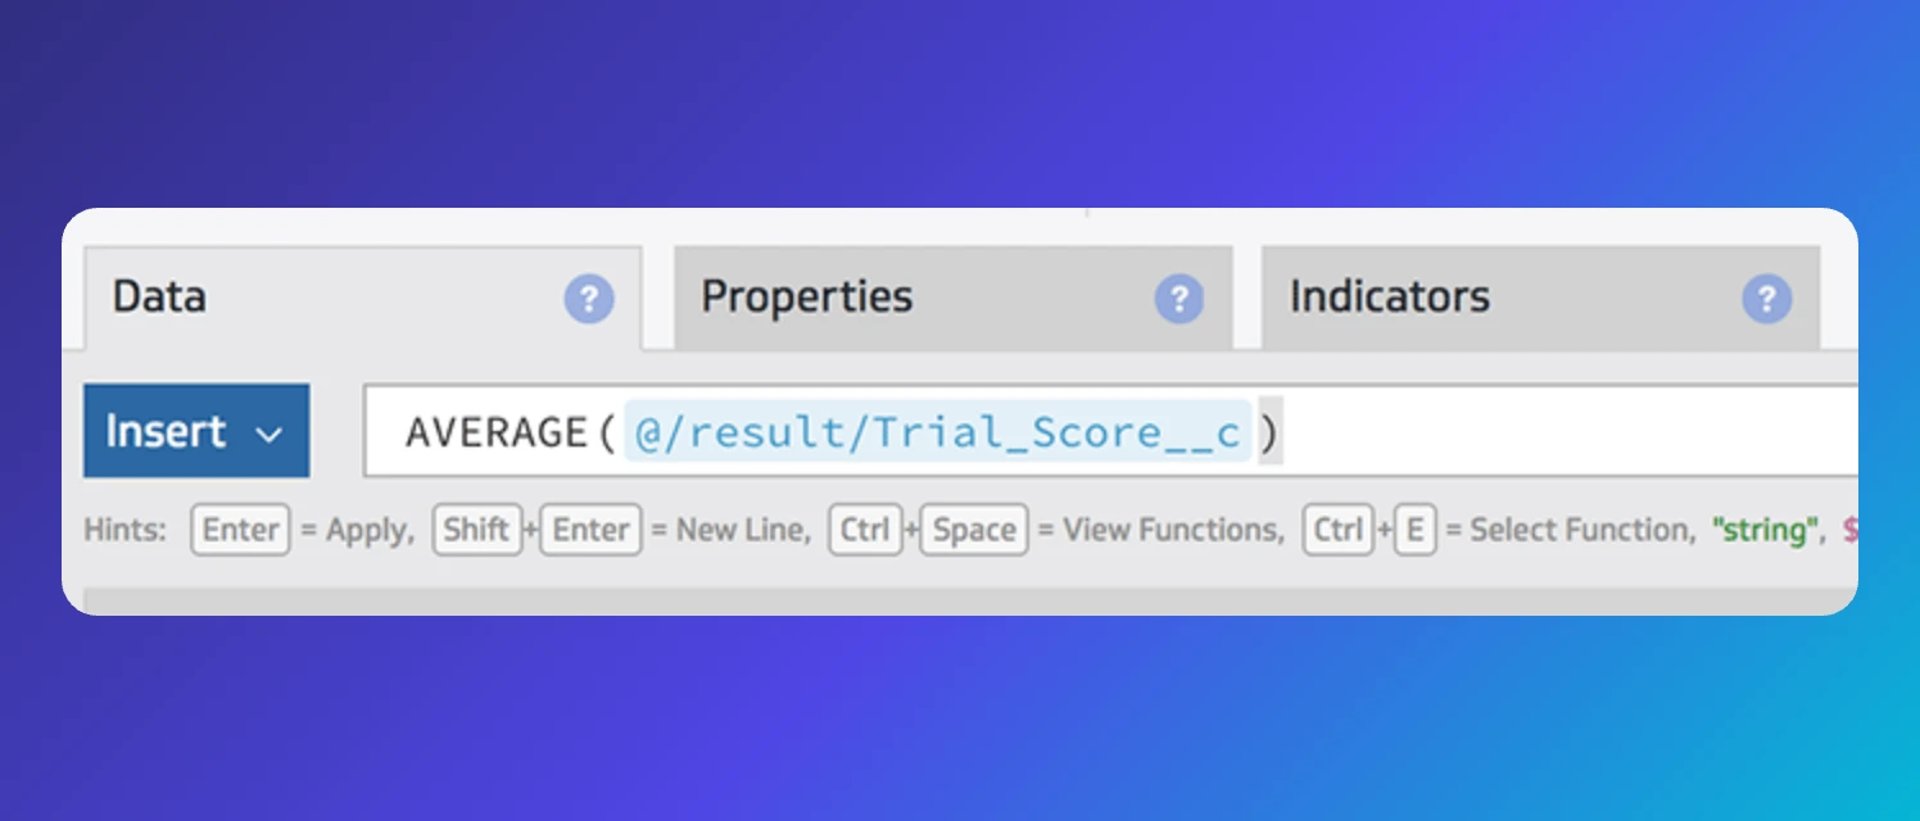
For the AVG Trial Score column, use the AVERAGE function. Select your Trial Start data source, expand the JSON records, find the trial score field, and select it. Your formula will look something like this:
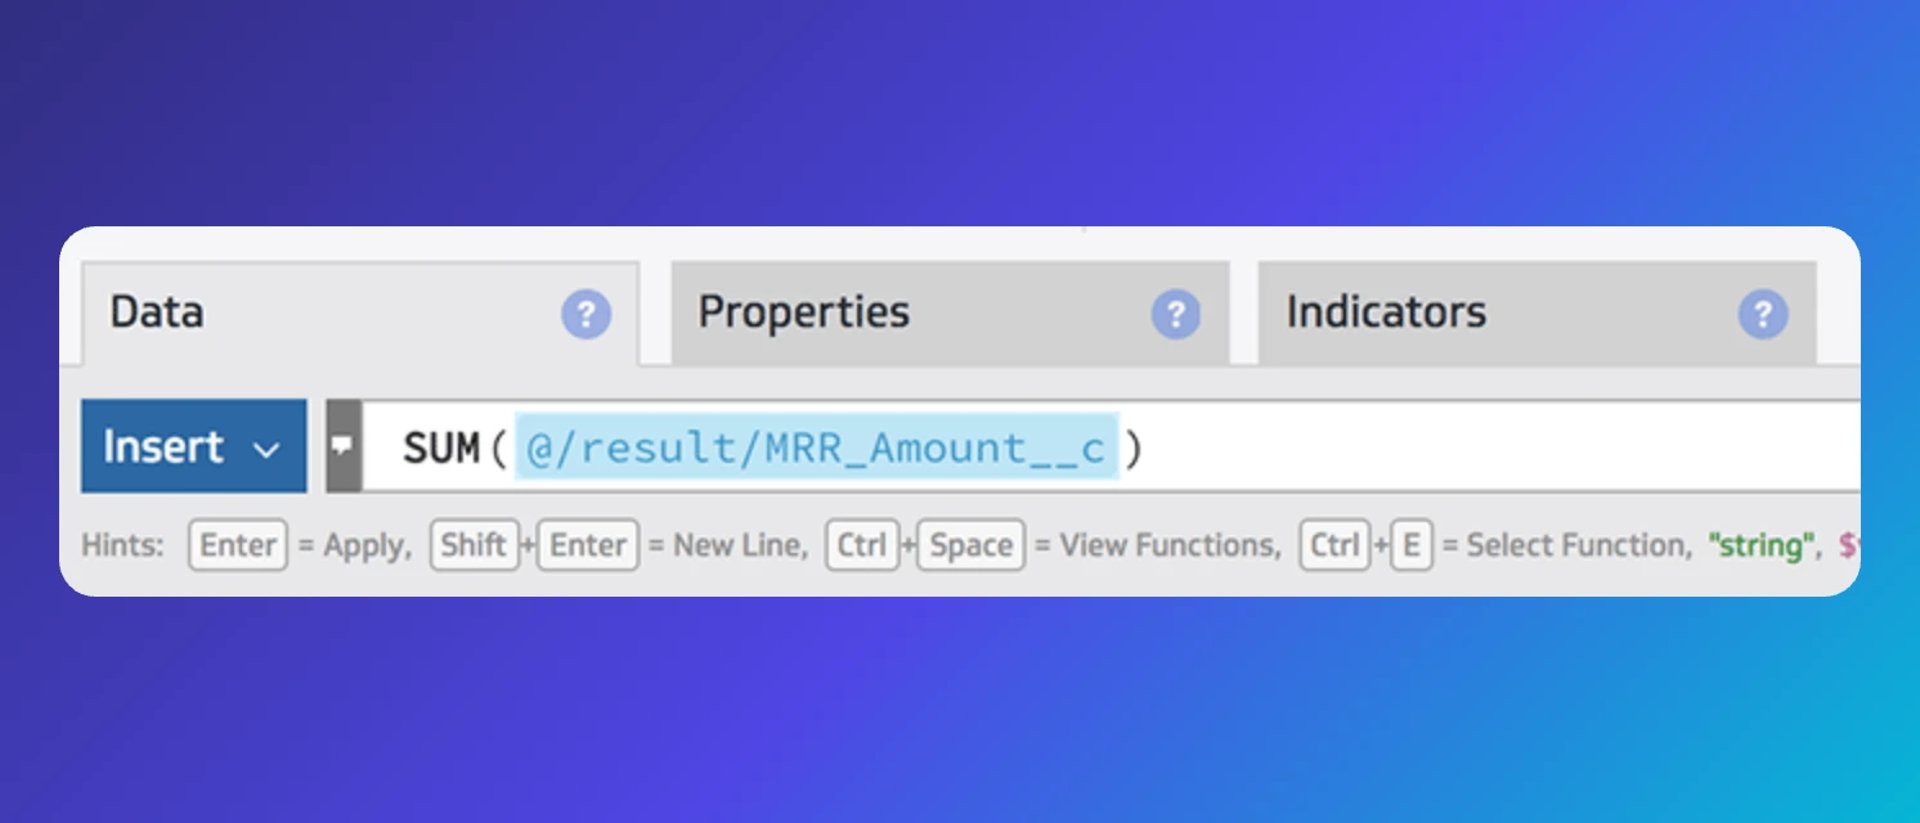
For the MRR column, use the SUM function to total the MRR value across everyone in the Wins list:
Format your numbers, and the dashboard is ready.
!Email course stats MRR
From here, you can add threshold indicators to flag when a metric moves outside an expected range, schedule a PDF report to your inbox each morning, or share a live link with anyone on your team. The data stays current without anyone having to maintain it.
What this looks like at scale
Eight months after launching the first campaign, the setup had grown to cover multiple email courses tailored to different audiences. The dashboard grew with it.
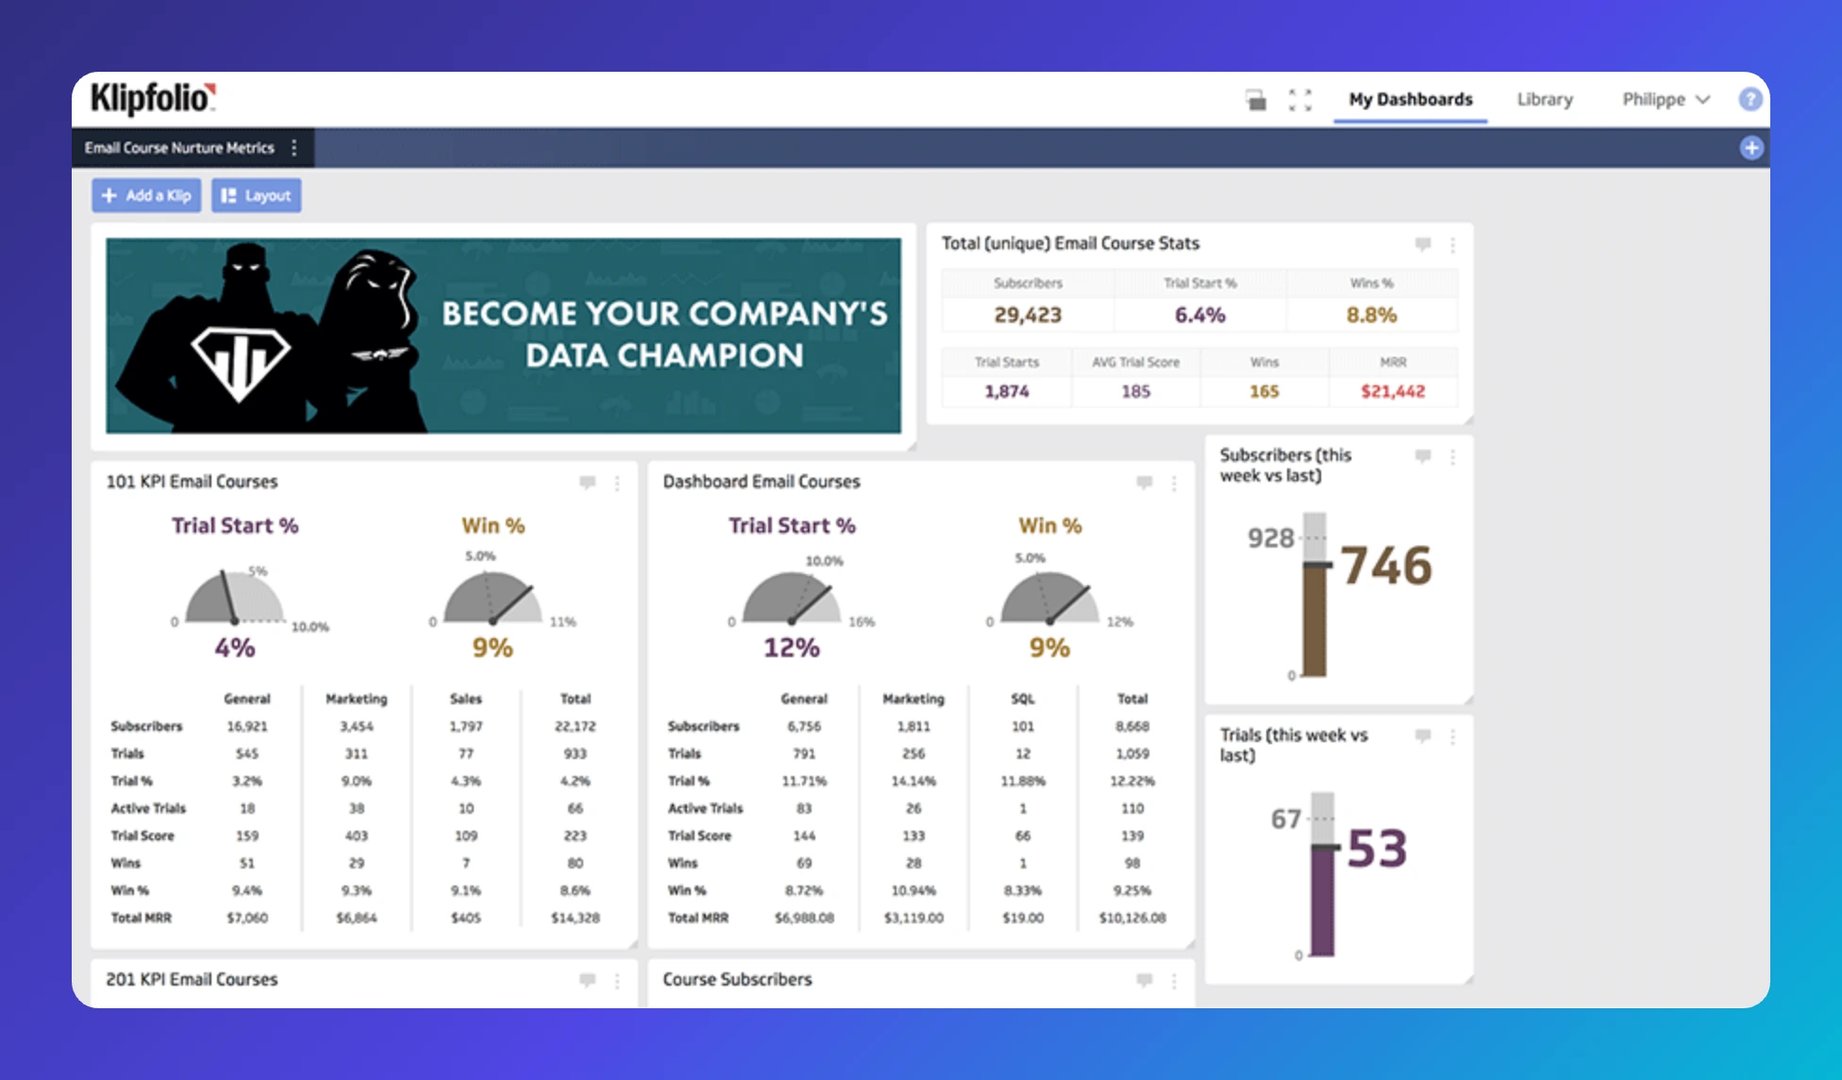
That's the real value: one connected dashboard that keeps your whole team aligned on what's working, without anyone digging through Marketo or pasting numbers into a spreadsheet to find out.
If you run into anything along the way, the Klipfolio support team is available to help.
Published 2026-08-22
More in Dashboards

6 dashboards I use daily to run my SaaS company

The 5 most important SEO KPIs for digital marketing success

What are the best inbound marketing KPIs?

Klipfolio Partner How-To #1: Duplicating dashboards across client accounts

Klipfolio Partner How-To #2: Company Properties can simplify client set-up

Top 10 Marketing Dashboard Ideas for Tech Companies
Most recent
- AUG 11Beyond simple sign-ups: how True Trials and Activation predict growth
- JUL 7Why business leaders miss important trends in their dashboards
- JUN 19The best chart for the job: Visualizing data for non-technical users
- JUN 95 tips to understand (and organize) your restaurant data
- MAY 26Think in Horizons, Not Seconds
- MAY 2010 Cloud BI Dashboard Tools for Small Businesses in 2026