

Top metrics to monitor for digital ad campaigns
Learn which metrics to track when reporting on digital ad campaigns. This guide covers foundational metrics like impressions, clicks, ad spend, and conversions, then moves into advanced calculated metrics including CPC, CTR, CPA, ROAS, and ROI. Includes practical advice on dashboard design, time periods, and when to add complexity.

Tracking digital ad campaign performance gets complicated fast. Too many metrics, too many platforms, and no clear signal on what actually matters for your next decision.
This guide covers the key metrics to monitor when reporting on digital ad campaigns, organized from foundational to advanced so you know exactly what to look at and why.
Before you choose your metrics, consider these three questions
1. Who needs to see this?
Your audience shapes everything. A CEO or VP needs a high-level view of business impact. A marketing manager wants enough granularity to act on what's underperforming. Tailor the report to what each person needs to decide, not what's interesting to look at.
2. What does that person need to take action?
Nobody acts on a report with too much or too little information. The sweet spot is tight and specific.
Aim for 6 to 8 metrics on a company-wide executive dashboard and 8 to 10 metrics on a team-specific dashboard. That constraint forces you to prioritize what matters and keeps the dashboard readable at a glance.
Ask yourself: what question does this person need answered? What decision will they make with this information? Better yet, ask them directly.
3. What time periods are relevant?
You'll likely need data by day, week, or month. Confirm that level of granularity is available in your data source before you build anything.
Also think about comparisons: this month versus last month, or this month versus the same month last year.
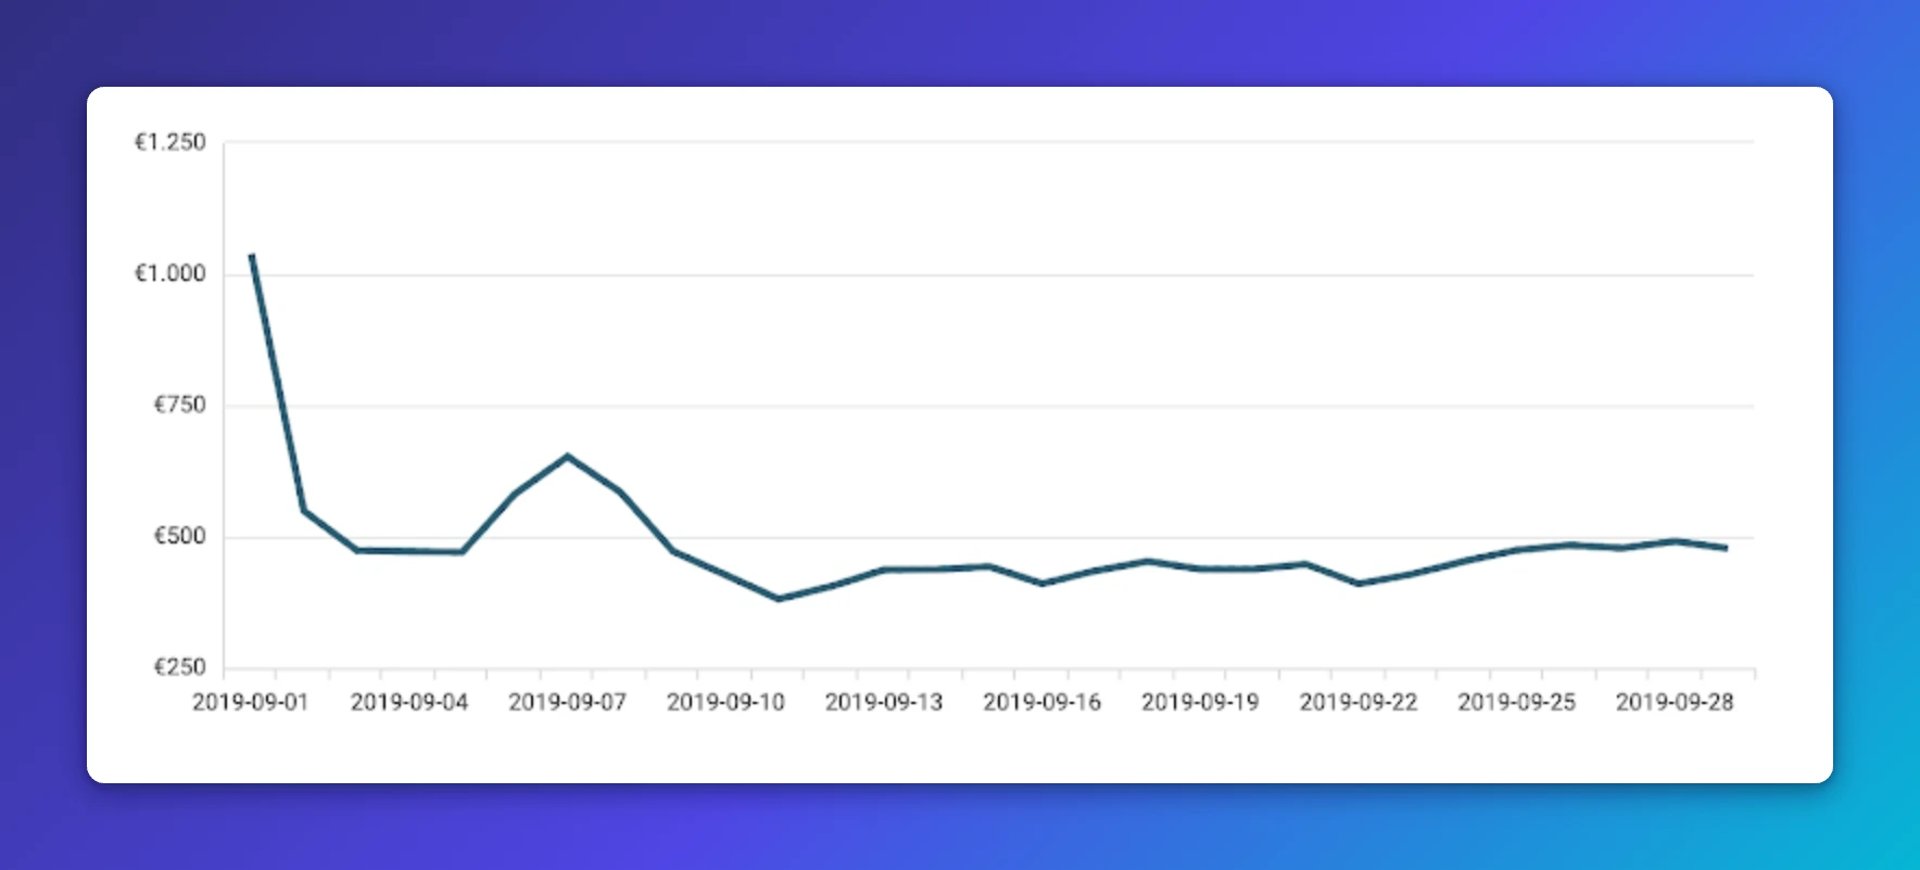
Pro tip: Daily trends generate roughly 30 times more data than monthly trends. For daily reporting, keep the time window to 90 days or fewer. Knowing what happened 127 days ago to the day rarely changes what you do today.
Once you have answers to these three questions, you're ready to move forward. Keep it simple.
Basic metrics for ad campaign reporting
These four metrics form the foundation of any digital ad dashboard. If you're starting from scratch, start here.
Impressions: The total number of times your ads display on someone's screen within a publisher's network. Track Ad Frequency alongside this for a complete picture of reach and repetition.
Clicks: The number of times users clicked your ad to reach your online property. Clicks tell you whether your creative is generating interest.
Ad spend: The amount spent on specific ad variations within a campaign or ad set. This is your cost baseline for every efficiency metric that follows.
Conversions: How well your campaign drove the action you wanted, whether that's a purchase, a signup, or a download. This is the metric that connects ad activity to business outcomes.
Bonus: See the difference between ad clicks vs. ad impressions.
!top paid metric
Depending on your campaign goal, one metric will matter more than the others. Place the most important metric in the top left corner of your dashboard. That's where the eye goes first, and it signals what the whole view is built around.
Advanced metrics for ad campaign reporting
Beyond the basics, calculated metrics provide context. They turn raw numbers into signals you can act on.
If you spend $100 and get 10 clicks, your cost-per-click is $10. If you spend $100 and get 1 click, it's $100. The raw numbers look similar; the derived metric tells you something completely different.
!top paid metric
Pro tip: Calculated metrics need enough data behind them to be meaningful. If you've spent only a few dollars on ads, cost-per-click will swing wildly with each new click. Wait for a meaningful sample before drawing conclusions.
Create custom dashboards for you and your team.
Get started with KlipsThree must-have advanced metrics
Cost-per-click (CPC): The average cost each time someone clicks your ad. A rising CPC signals declining efficiency; a falling CPC suggests your targeting is improving.
Click-through rate (CTR): The percentage of people who see your ad and click it. A higher CTR means your ad is resonating with the right audience.
Cost-per-action (CPA): The average cost to achieve one desired outcome. This metric directly reflects campaign efficiency and whether you're paying a sustainable price for results.
Three additional advanced metrics to consider
Goal completions in GA4: A goal represents a completed activity you've defined as important, such as a form submission, a resource download, or a purchase. Goal conversion rate is one of the clearest indicators of whether your campaigns are driving real business value.
Pro tip: If you manage multiple websites, use consistent goal naming across properties. Cross-site analysis becomes much easier when the definitions match.
Ecommerce transactions in GA4: For sites selling products, this metric ties ad spend directly to revenue. It's one of the most actionable numbers available because it connects what you spent to what you earned.
Pro tip: Make sure your UTM tagging is structured correctly. UTM parameters let you attribute transactions back to specific campaigns and platforms, so you know which spend is working.
Platform-specific conversions: Google Ads, Meta, LinkedIn, and other platforms each offer standard conversion types. Use your reporting tool to surface the conversions that matter most to your business goals.
Once you've set up advanced conversion metrics, report conversions as your primary metric and use cost-per-conversion and conversion rate as health indicators. If you've configured ecommerce revenue in GA4, use that as your target metric and tie it back to ad spend.
!top paid metric
Super-advanced metrics: The complete efficiency picture
If you've defined conversions and set up ecommerce metrics, you're ready to go deeper. These metrics tell you not just whether campaigns are working, but whether they're worth running at all.
Pro tip: Don't abandon simplicity. Stick to 6 to 8 metrics on a company-wide dashboard and 8 to 10 on a team dashboard. Build multiple focused dashboards, one per campaign, platform, or narrative, rather than cramming everything into a single view.
Return on ad spend (ROAS)
ROAS measures how much revenue your campaigns generate for every dollar spent.
ROAS = (Revenue from campaigns) / (Ad spend)
To calculate ROAS, you need revenue data from your ad platforms or, better still, transactions tied to specific campaigns. That often means mapping campaign data from multiple ad platforms to your GA4 revenue data. ROAS is a powerful indicator of campaign quality and platform performance.
!top paid metric!top paid metric
Understanding ROAS thresholds
A ROAS above 1 means you're earning more than you're spending. But that assumes zero product costs, which is rarely true.
If your product costs 50% of its selling price, you need a ROAS of at least 2 just to break even. Factor in repeat purchases and you can set a minimum ROAS based on estimated lifetime value. This mirrors how customer lifetime value works in SaaS: the number that looks acceptable in isolation may not be when you account for the full cost of the sale.
Master metrics: Accounting for total business cost
When you're ready to see the full picture, add these metrics.
Return on investment (ROI): The most comprehensive calculated metric available.
ROI = (Revenue - Total costs) / Total costs
ROI accounts for all relevant expenses, not just ad spend. That includes salaries, software, creative production, and any other cost tied to the campaign. It tells you whether the whole effort was worth it, not just whether the ads paid for themselves.
A few things to keep in mind:
- Include every relevant cost. Missing even one category distorts the number.
- Treat ROI as a benchmark or target, for example, a minimum ROI of 1.05. The trend over time matters as much as the absolute figure.
- Set ROI as a dashboard target so you can track progress and flag when campaigns drift below threshold.
Rate of return (returned goods): For ecommerce businesses, returned products reduce the real value of every campaign-driven sale. Track this to understand true campaign profitability.
Gross margin: Reveals the percentage of revenue left after product costs. A campaign can drive high revenue and low margin at the same time, especially if it's built around discounted products.
Pro tip: Use BigQuery or a similar data warehouse for complex metrics like returned goods and product margin. These calculations often involve large datasets and joins across multiple sources.
Keep it simple: Avoid metric overload
Display only the metrics that matter to the people who need to see them. More data does not produce better decisions. Focus does.
Start with the basics. Add advanced metrics when you have enough historical data to draw meaningful conclusions. Move to master metrics when you're ready to account for the full cost of running campaigns.
The goal is not to track everything. The goal is to know what's working, understand why, and decide what to do next.
Published 2026-08-24
More in How To
Business Metrics vs. KPIs: What’s the Difference?

The 5 most important SEO KPIs for digital marketing success
What is a KPI, metric, or measure?

What are the best inbound marketing KPIs?

Klipfolio Partner How-To #1: Duplicating dashboards across client accounts

Klipfolio Partner How-To #2: Company Properties can simplify client set-up
Most recent
- AUG 11Beyond simple sign-ups: how True Trials and Activation predict growth
- JUL 7Why business leaders miss important trends in their dashboards
- JUN 19The best chart for the job: Visualizing data for non-technical users
- JUN 95 tips to understand (and organize) your restaurant data
- MAY 26Think in Horizons, Not Seconds
- MAY 2010 Cloud BI Dashboard Tools for Small Businesses in 2026