

Using Facebook's Graph API Explorer to retrieve Insights data
Learn how to use Facebook's Graph API Explorer to pull Page Insights data directly, without waiting for a report or copying numbers by hand. This step-by-step tutorial covers access tokens, querying specific metrics, and connecting your request URL to Klipfolio for automated, always-current data.
A few years ago, the mere mention of "API" would send most marketers straight to their development team. Today, APIs are an accepted part of the marketing vocabulary and a sought after skill, especially for anyone responsible for growth. The reason is simple: API knowledge gives you direct access to the data sitting inside the web services you use every day, without waiting for someone to pull a report or paste numbers into a spreadsheet.
For marketers, a basic knowledge of APIs can open doorways to growth hacking tactics, like the one Airbnb used to grow their business. It also gives you reliable, on-demand access to the performance data from your campaigns, which is exactly what this tutorial covers.
Tutorial: Using Facebook's Graph API Explorer to retrieve Page Insights data
This tutorial walks you through using Facebook's Graph API Explorer to pull Insights from Facebook Pages you manage. You'll end up with a request URL that retrieves exactly the metric you want, automatically, without logging into Facebook or asking anyone to run a report.
In the world of APIs, an "API Explorer" is an interface that helps you build a request URL. That URL works like a command that tells Facebook to return specific data on your behalf, such as a GET request that pulls data from your Facebook Page.
Open the Graph API Explorer in a separate window so you can follow along.
Step-by-step
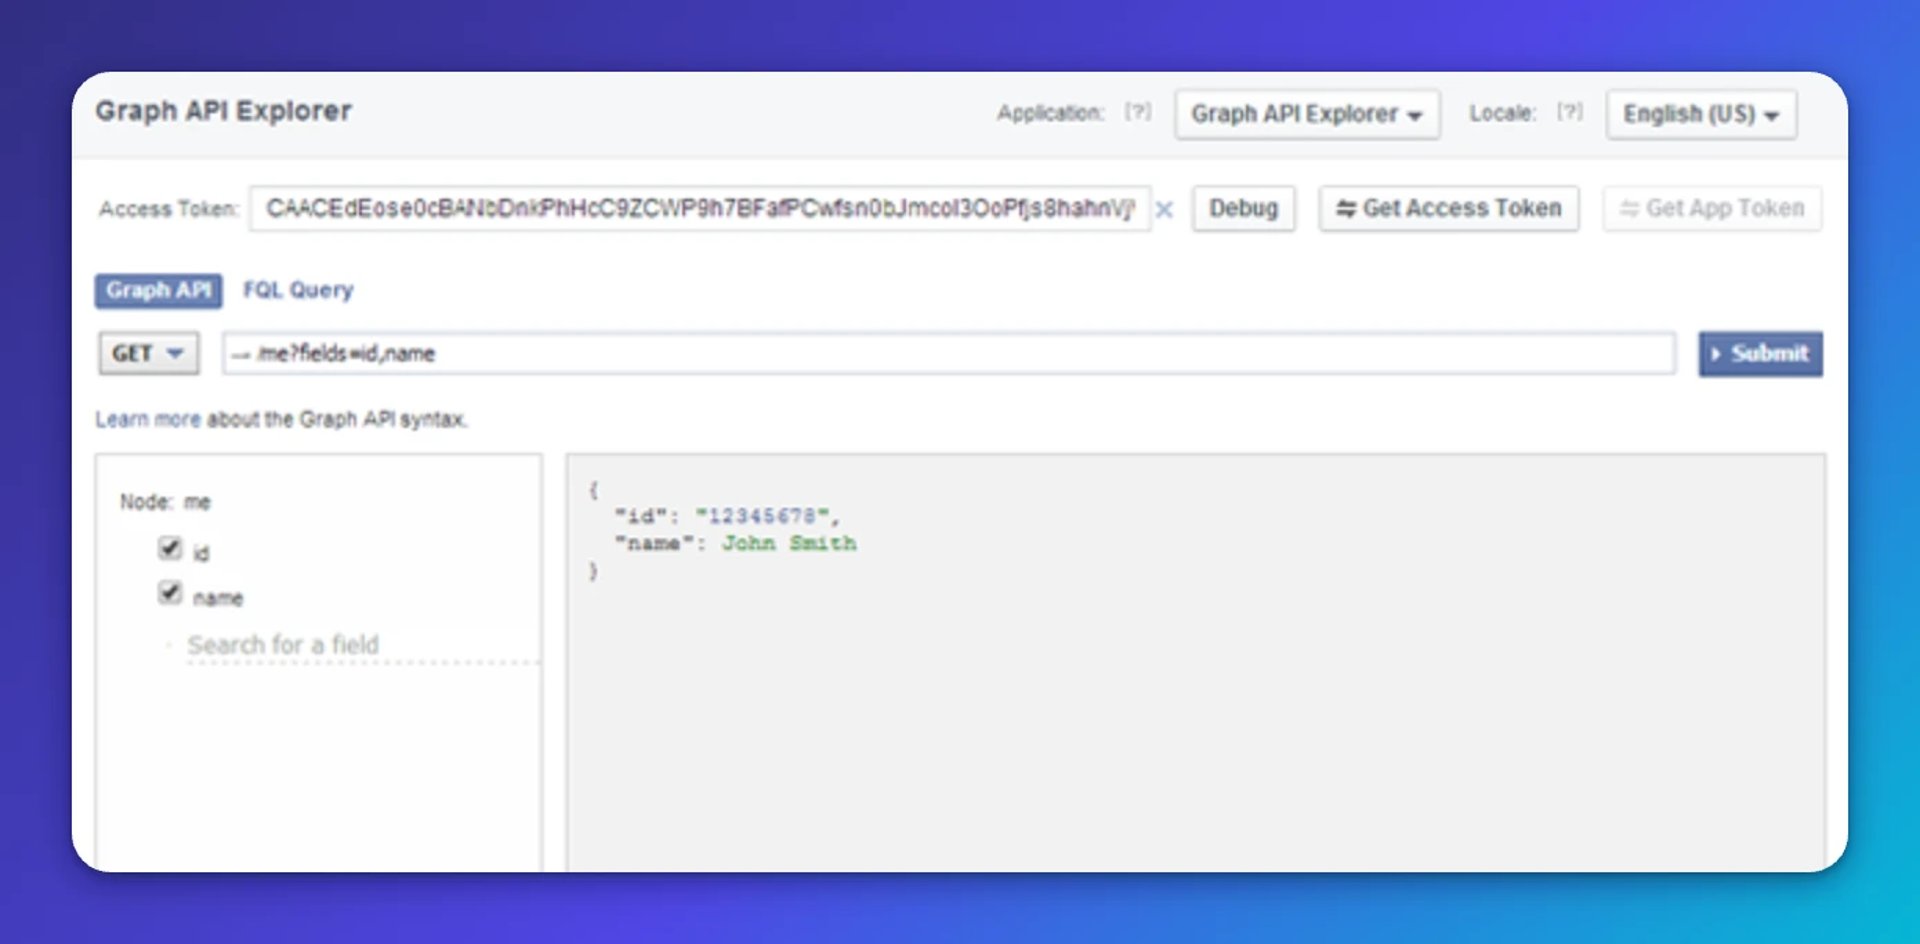
Step 1: Navigate to the Facebook Developer website
Go to https://developers.facebook.com/tools/explorer.
By default, your profile name and profile ID appear in the explorer panel.
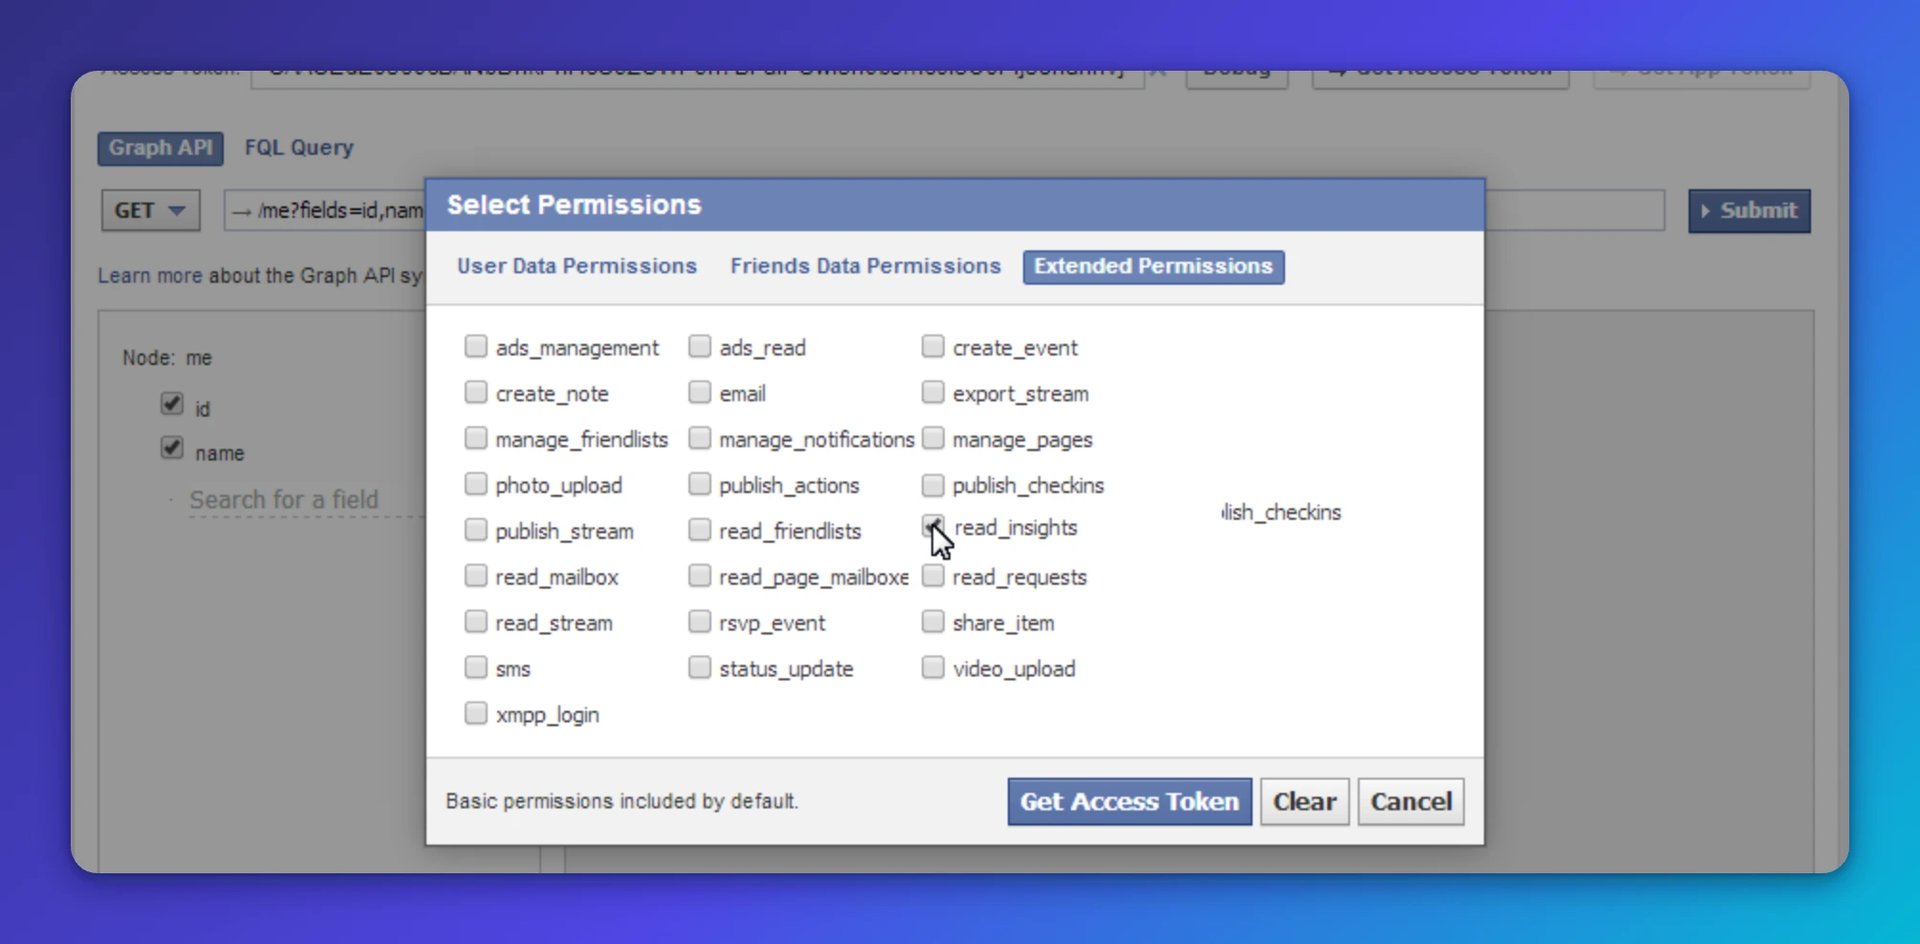
Step 2: Set up your Access Token
You need an Access Token with "read_insights" permission to retrieve Page Insights data.
- Click the Get Access Token button.
- Under Extended Permissions, select Read Insights.
- Click Get Access Token to confirm.
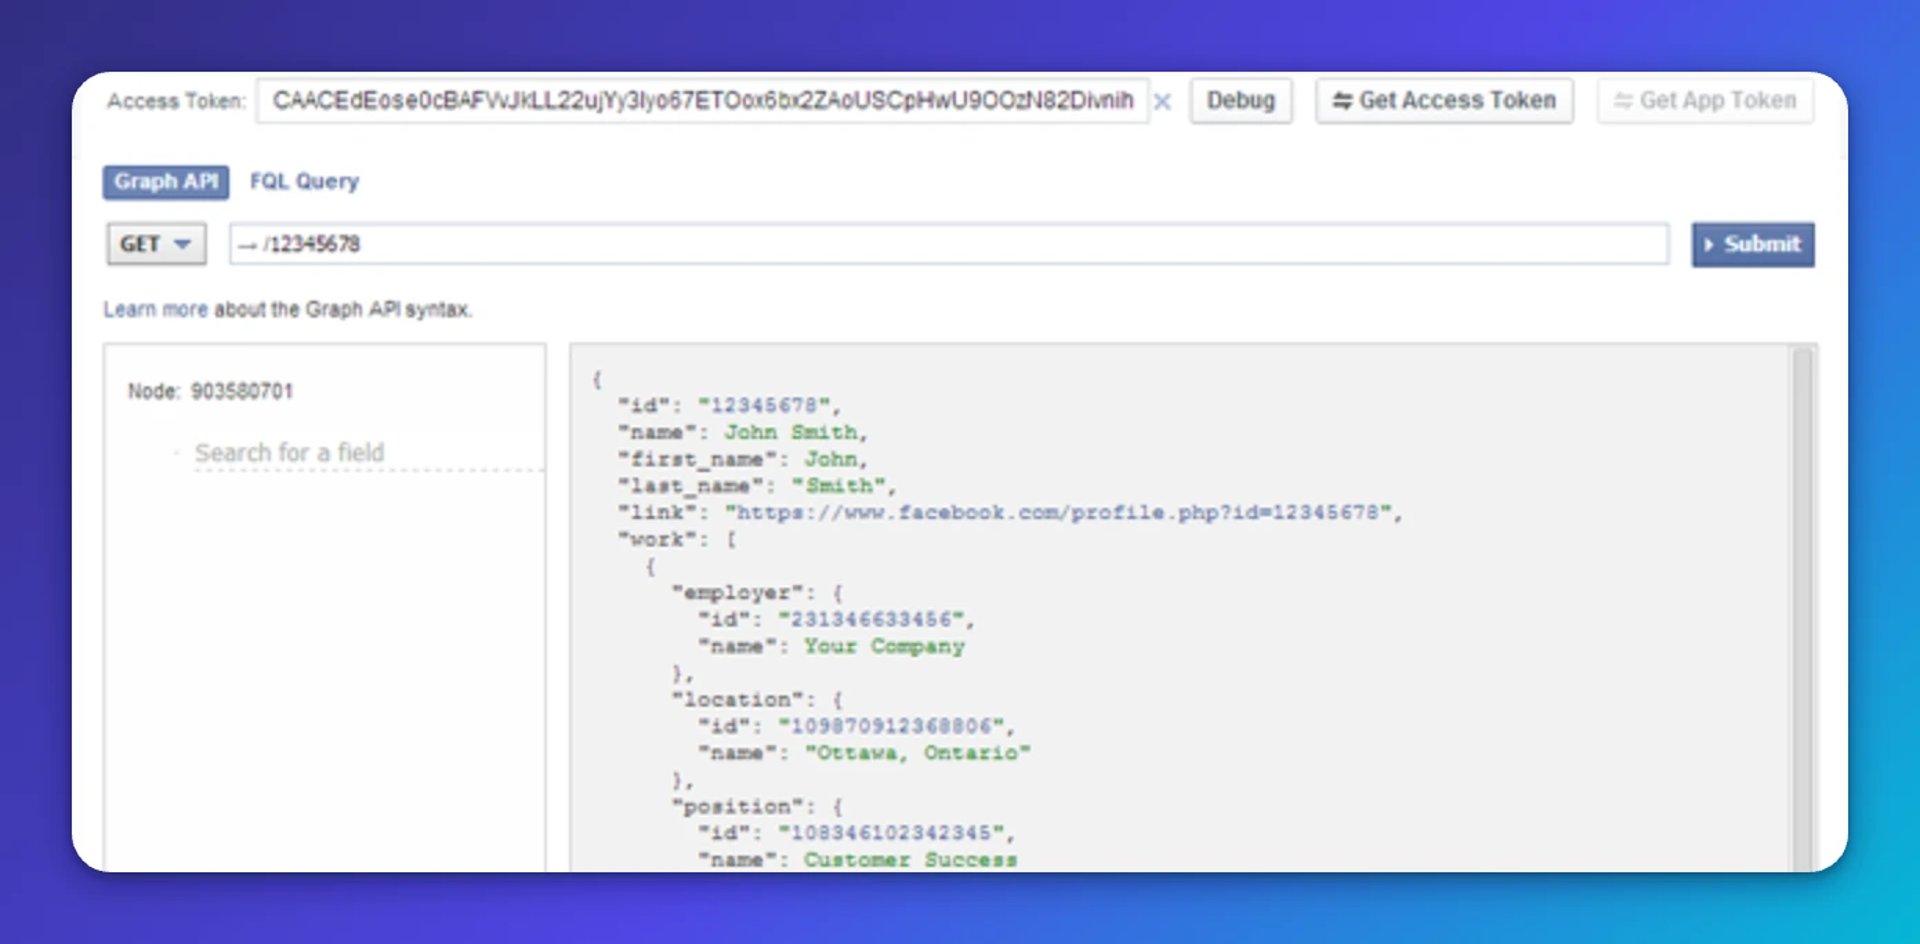
Step 3: Use the explorer panel
The explorer panel shows items associated with your Facebook account. By default, it displays your profile ID. Selecting an item updates the panel to show its child elements and refreshes the request URL.
- Select your profile ID. It is a clickable link within the explorer panel.
The Request URL updates.
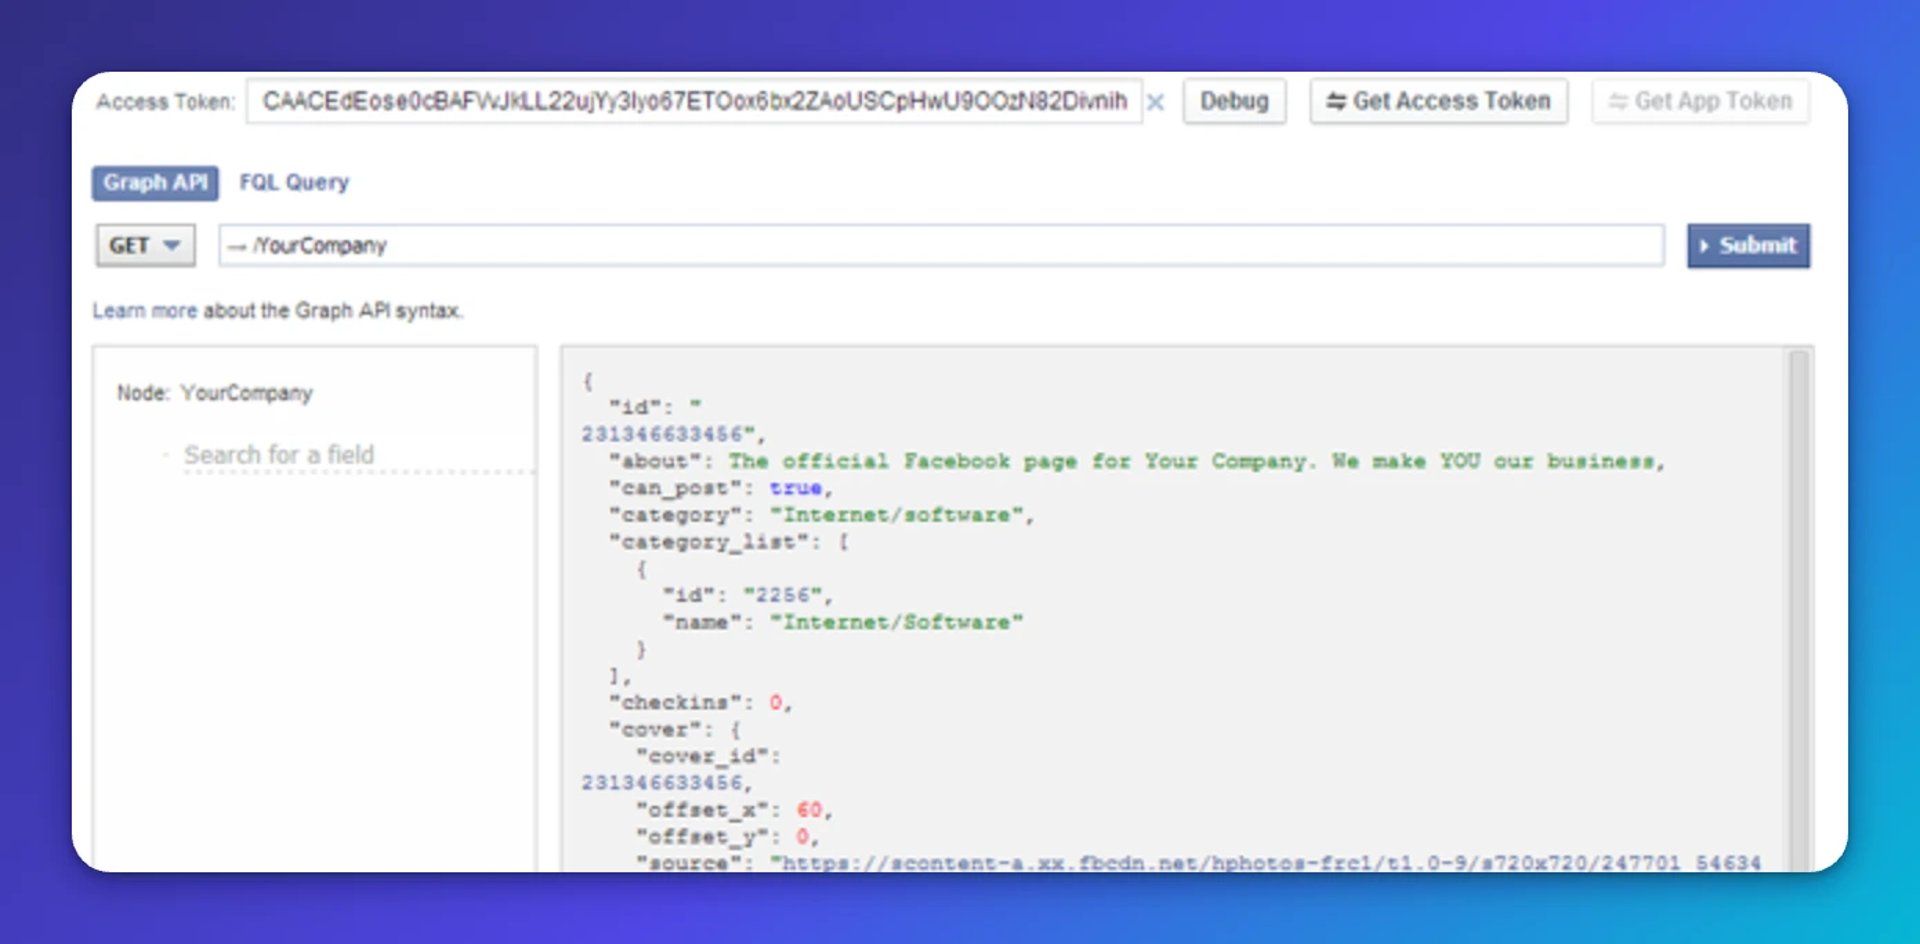
Step 4: View Page information
You can access any Facebook Page you manage by typing its name into the URL field. For example, our Facebook Page is https://www.facebook.com/Klipfolio, so we'd type /Klipfolio.
- Type the name of your Facebook Page into the URL request field.
- Click Submit.
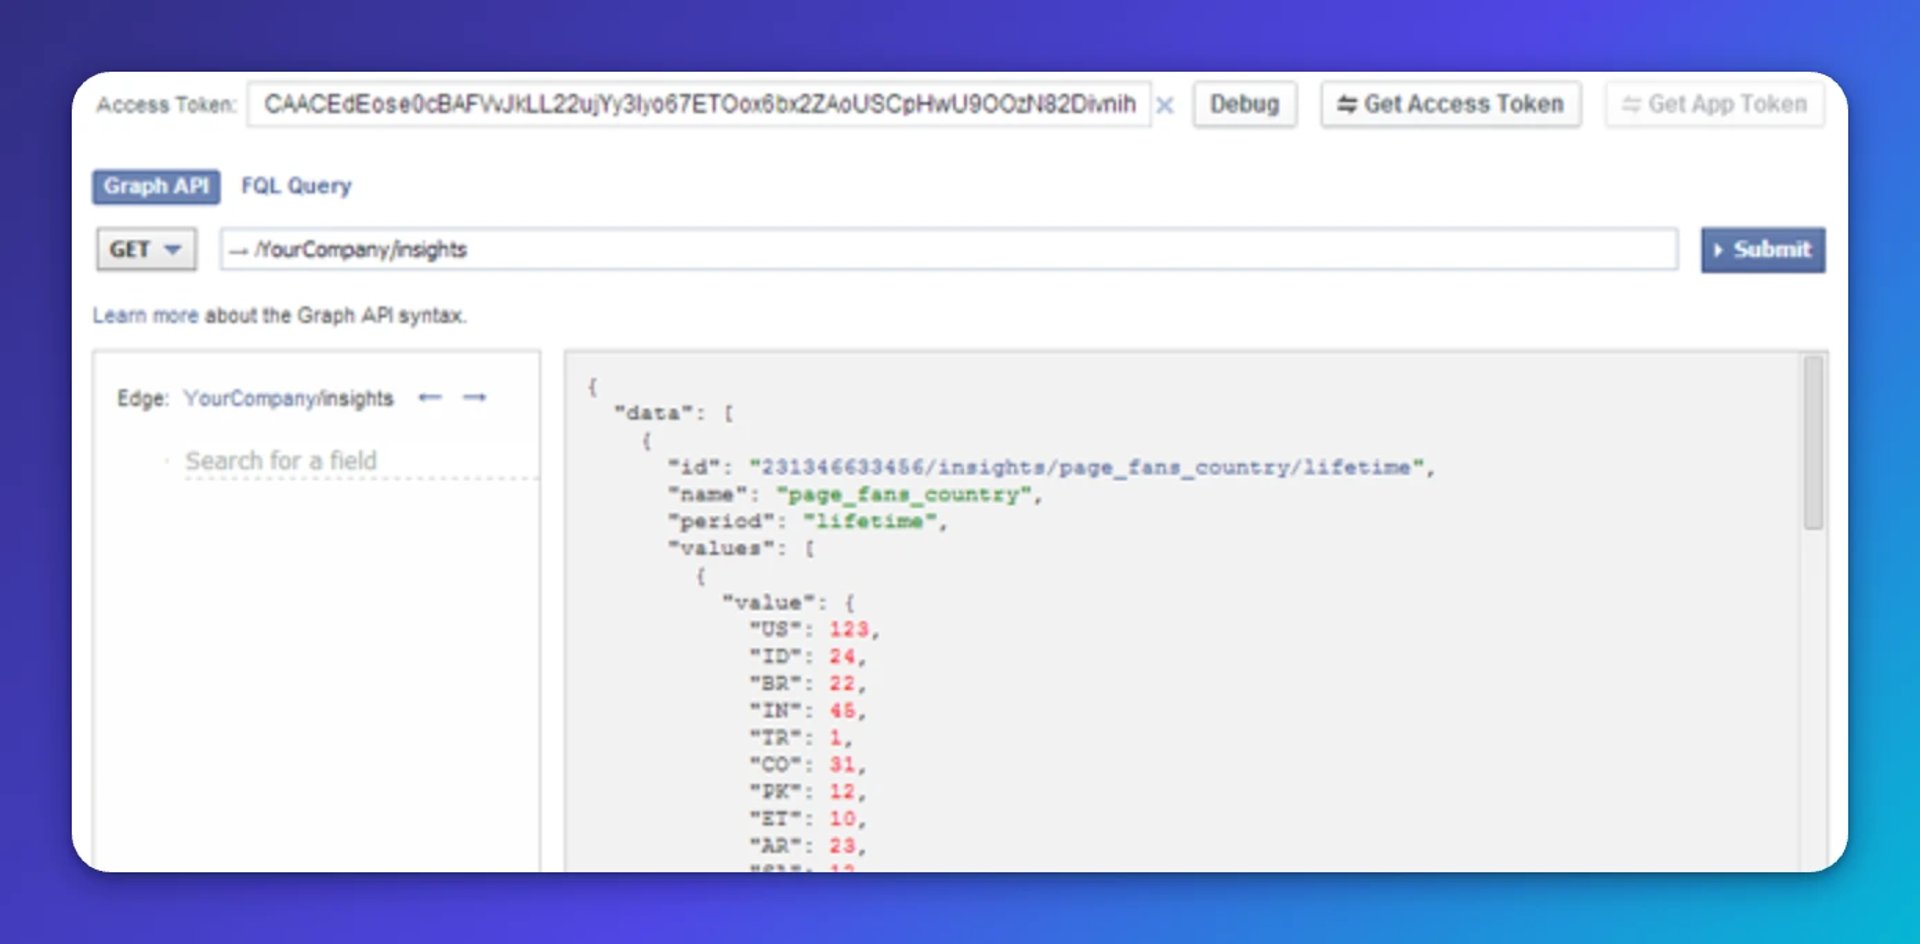
Step 5: View Page Insights
Add /insights after your Page name in the URL field. This retrieves all Insights associated with your Page.
- Type "/insights" after your Page name.
- Click Submit.
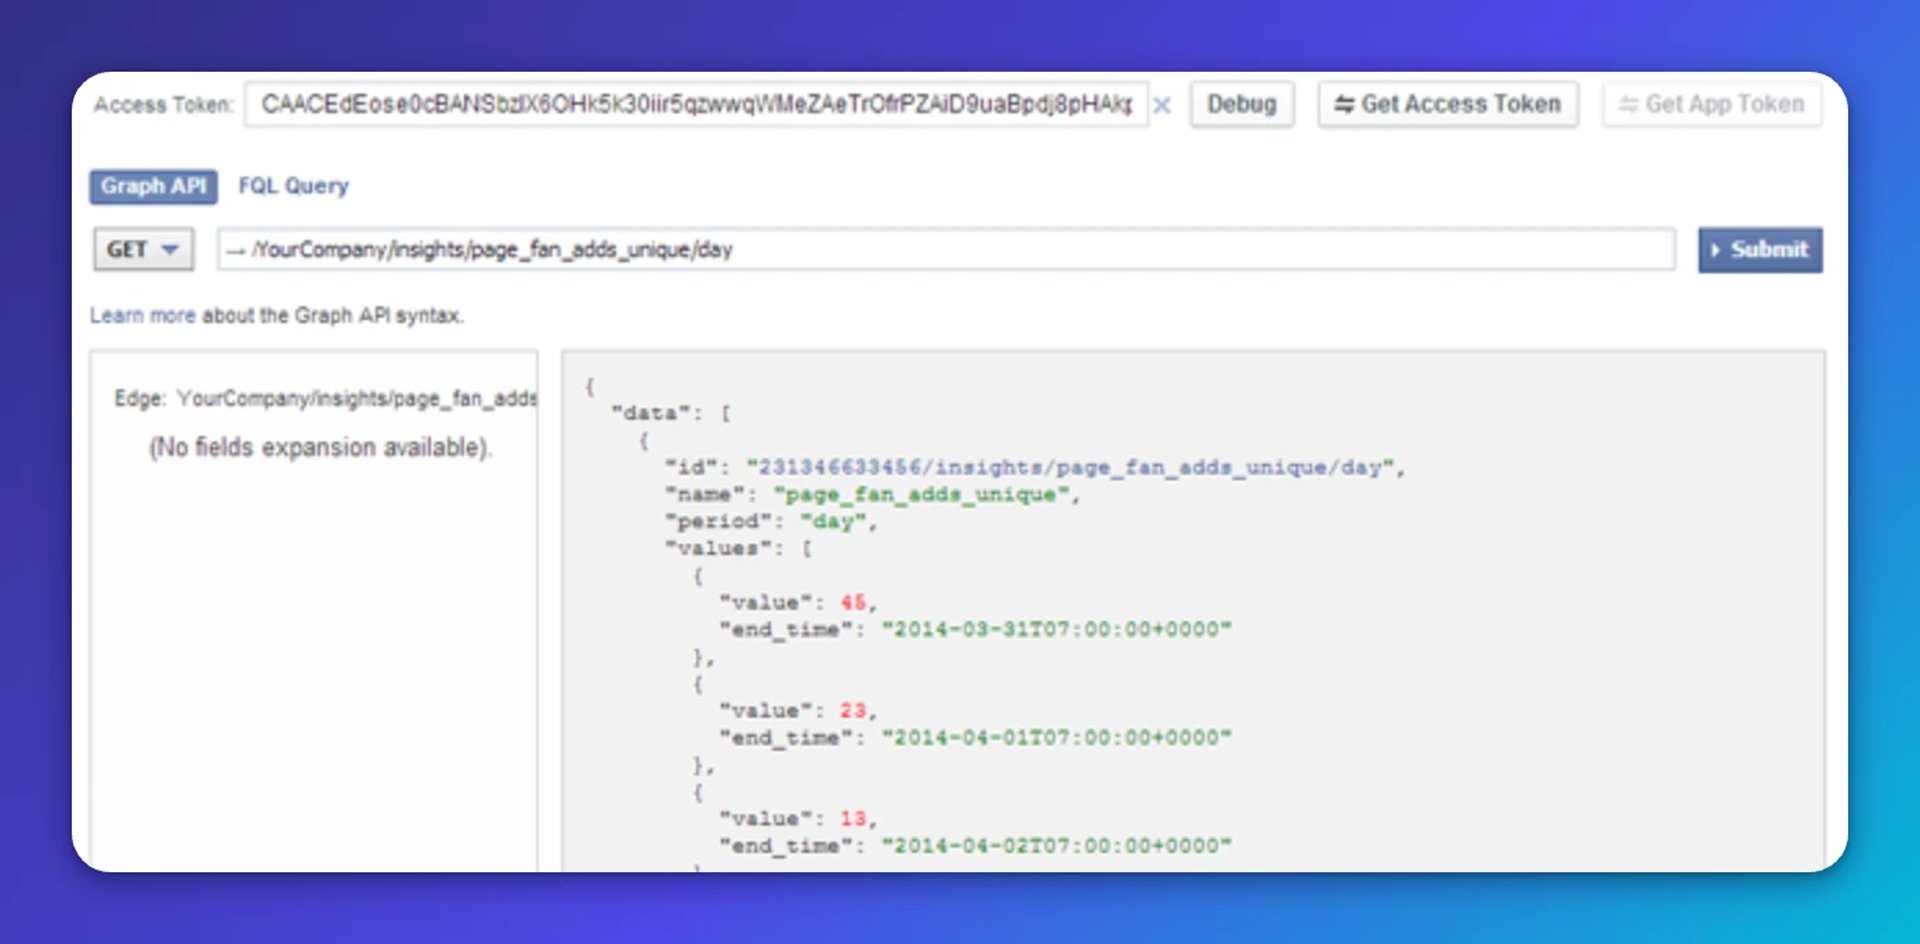
Step 6: View a specific Insight
The basic "/insights" command returns a large data file covering every Insight for your Page. In most cases, you want a single metric, such as Unique page fan adds.
- Scroll through the explorer panel to find the Insight you want.
- Click the "id" of that Insight.
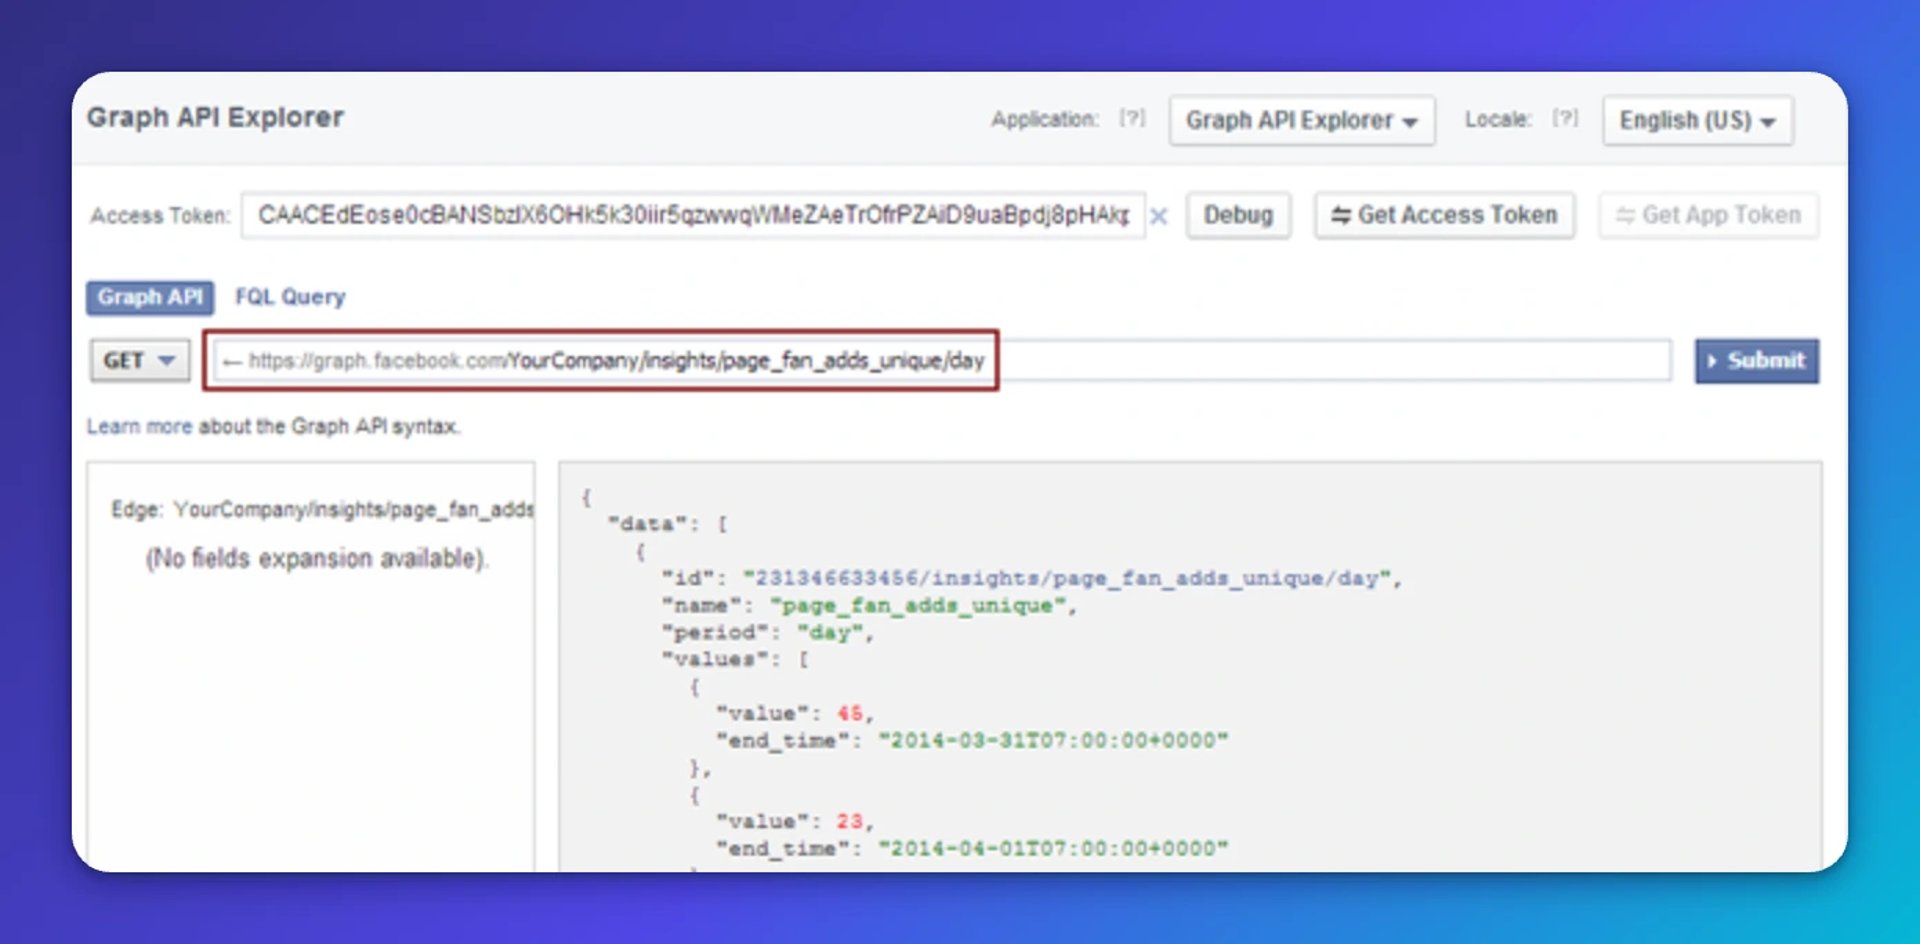
Step 7: Put the query to use
Your request URL now retrieves one specific Insight. If you use Klipfolio, you can take this URL and build a data visualization directly from it. The steps below show you how.
Next steps: Connect and automate with Klipfolio
Once you have a working request URL, you have something genuinely useful: a reliable, repeatable way to pull a specific Facebook metric without logging in, without asking anyone, and without copying numbers by hand.
When you connect this URL to Klipfolio, your authentication credentials pass automatically with each request. The data source refreshes on a schedule you set, so any Klip built on it always shows current data. That means the number you see on your real-time social media dashboard is the right number, every time, without anyone having to check.
For setup details, see our documentation: Using Facebook as a data source
Modifying the request URL in Klipfolio
Many request URLs return data for a fixed, limited window by default. For example, the daily fan adds request retrieves only the past three days. When you're building a visualization, you usually want a longer, well-defined time range.
Within Klipfolio, you can modify the request URL to control exactly which date range you retrieve.
Adding date parameters to the request URL
Start with your base URL:
https://graph.facebook.com/**PAGENAME**/insights/page_fan_adds
Add a ? to begin your query parameters:
https://graph.facebook.com/**PAGENAME**/insights/page_fan_adds?
Add a start date using the since parameter:
https://graph.facebook.com/**PAGENAME**/insights/page_fan_adds?since={date.last30Days}
Add an end date using the until parameter:
https://graph.facebook.com/**PAGENAME**/insights/page_fan_adds?since={date.last30Days}&until={date.today}
This returns metrics for the past 30 days, up to and including today. You know exactly what period the numbers cover, which makes the data easier to act on.
For more detail, see: Using date range parameters
Create custom dashboards for you and your team.
Get started with KlipsWhy learning APIs is worth the effort
APIs take some effort to learn. But the payoff is direct access to your data, on your terms, without depending on a platform's built-in reporting or pasting numbers into another tool and hoping the context carries over.
This tutorial covers one narrow use case: pulling Facebook Page Insights. The broader opportunity is combining data from multiple sources in one place, for example, pairing Facebook Insights with your email marketing results to see how campaigns actually connect.
Also see:
What are some good KPIs in Facebook?
Published 2026-08-22
More in Agency Analytics

5 tips to understand (and organize) your restaurant data

The 5 most important SEO KPIs for digital marketing success

What are the best inbound marketing KPIs?

Top 10 Marketing Dashboard Ideas for Tech Companies
17 KPIs Every Data-Driven Manager Needs to Lead Their Team

PayTabs embraces a data-driven strategy with KPI dashboards
Most recent
- AUG 11Beyond simple sign-ups: how True Trials and Activation predict growth
- JUL 7Why business leaders miss important trends in their dashboards
- JUN 19The best chart for the job: Visualizing data for non-technical users
- JUN 95 tips to understand (and organize) your restaurant data
- MAY 26Think in Horizons, Not Seconds
- MAY 2010 Cloud BI Dashboard Tools for Small Businesses in 2026