

5 common dashboards among over 800 digital agencies
Digital agencies using Klipfolio rely on five core dashboards to run their own business: Financial Management, Project Management, Inbound Prospecting, Client Alerts, and Marketing Performance. See how each dashboard works, which metrics it tracks, and where the data comes from.

Digital marketing agencies are constantly looking for ways to prove their value to clients. Dashboards are one of the clearest ways to do it. They shift the conversation from activity to outcomes, from "here's what we did" to "here's what changed."
And nothing communicates results like reliable, real-time data.
With over 800 agencies using Klipfolio, we've seen first-hand how digital agencies are differentiating themselves and improving client relationships with dashboards.
Sending clients a massive export of numbers still happens, but it increasingly feels like a missed opportunity. Even well-organized spreadsheets with highlighted trends ask the client to do interpretive work they shouldn't have to do.
Modern agencies deliver modern reports. They choose living dashboards over dead screenshots.
Want to know if you're working with an elite agency? Ask them how they deliver reports. This single question can reveal a lot about how they operate across every other part of the engagement.
What is an agency dashboard?
An agency dashboard is a visual reporting tool that brings all of a client's marketing campaign data together in one place, giving clients a clear, unified view of campaign performance without requiring them to interpret raw numbers.
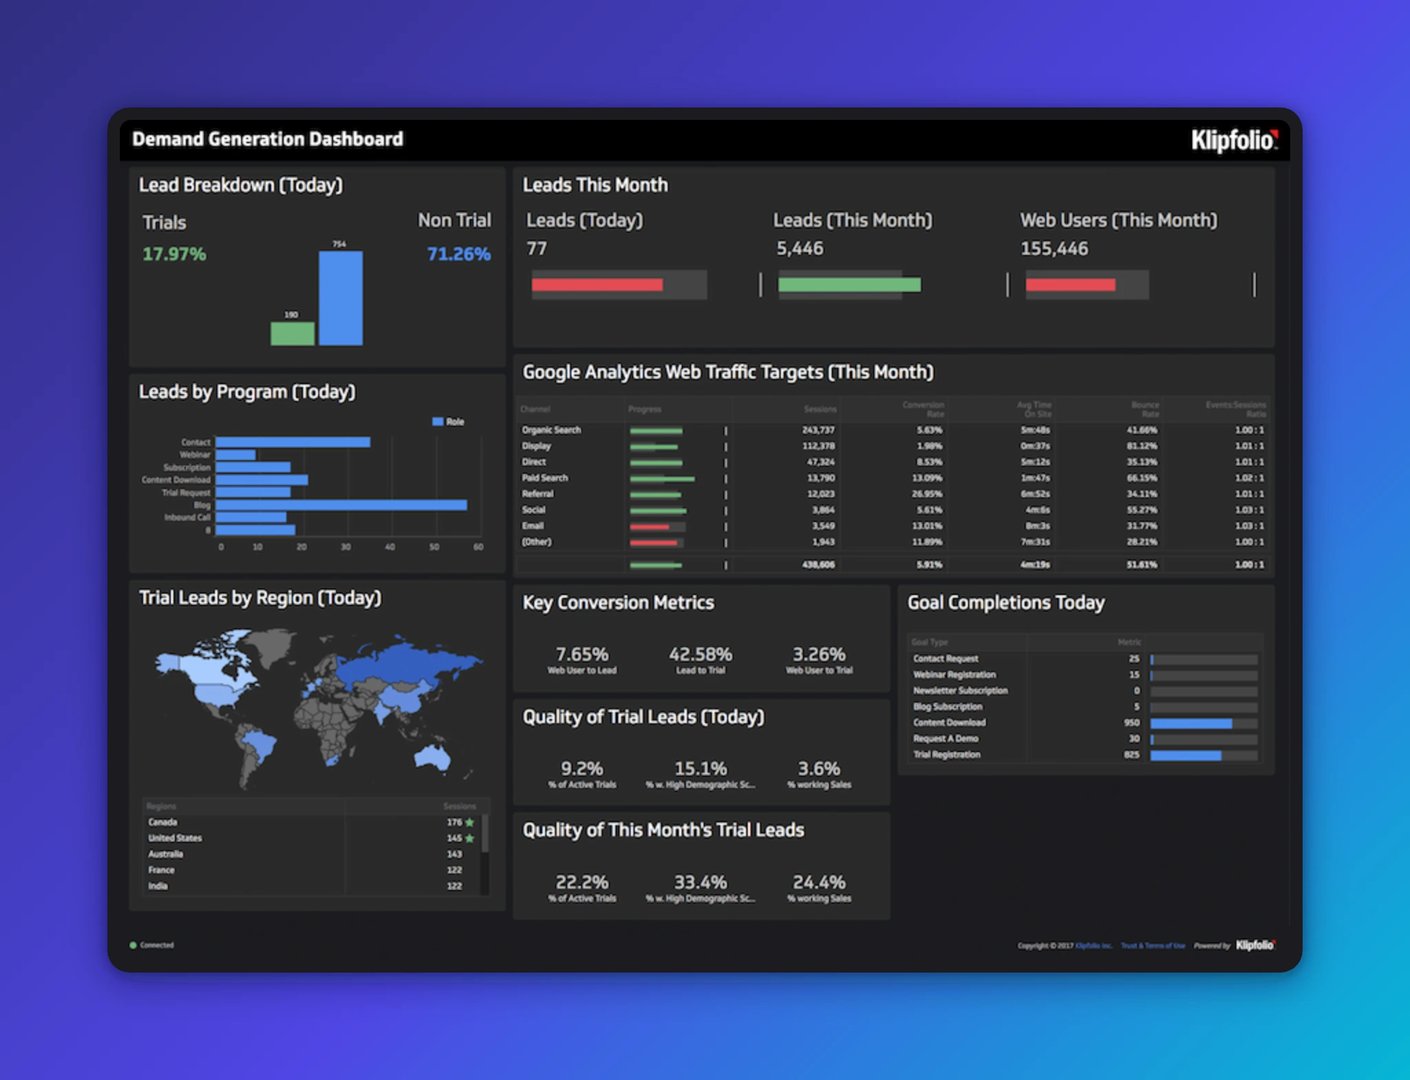
From a client management perspective, dashboards replace the manual process of cutting and pasting numbers into report templates in Excel or PowerPoint. Instead of a static file, clients get a dynamic, real-time view they can understand in seconds. No explanation required. No waiting for someone to pull the numbers.
Every agency remembers winning their first client: the hustle, the thrill, and the care they brought to every detail. That attention to quality is notoriously hard to maintain as the client list grows. Automated dashboards help agencies hold that standard across their entire portfolio without adding headcount.
But digital agencies aren't just using dashboards for their clients.
Used internally, dashboards help agencies track their own performance, increase team productivity, and build a culture where everyone is working from the same numbers. While we provide lots of examples of how agencies can display marketing dashboards for their clients, the five dashboards below are ones agencies use to run their own business.
Financial Management Dashboard
Project Management Dashboard
Inbound Prospecting Dashboard
Client Alerts Dashboard
Marketing Performance Dashboard
1. Financial Management Dashboard
Agencies must manage the billing side of every client relationship. Juggling multiple clients and different account types requires clear processes, and a financial management dashboard gives the whole team visibility into where things stand without anyone having to ask.
It keeps everyone focused on the numbers that matter. The metrics worth tracking here include:
Adjusted Gross Income (AGI)
Client Income (Actual vs. Estimated)
Accounts Receivable Aging
Number of Proposals Submitted
Pipeline by Expected Close Date
KPI sample: Client Income (Actual vs. Estimated)
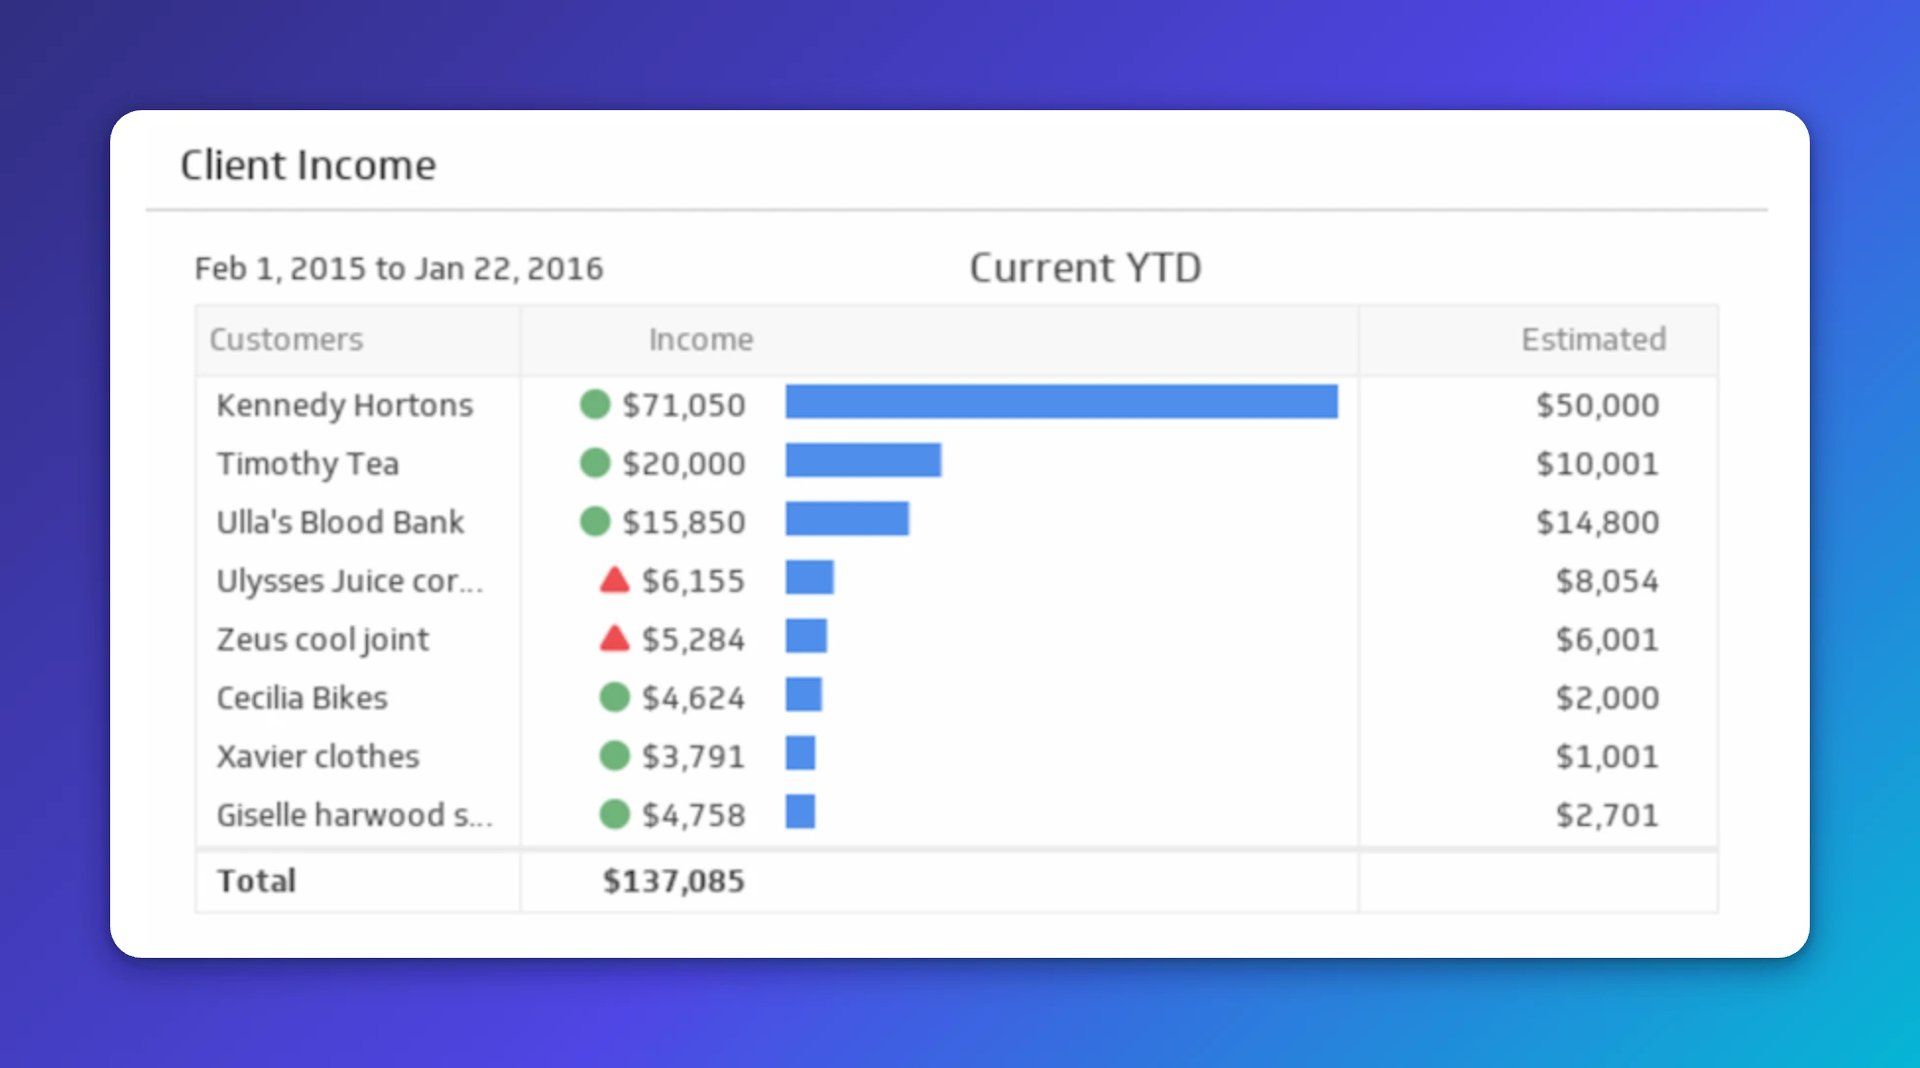
How is each client contributing to the business? Agencies need to track not only how much income each client generates, but whether that commitment is growing or shrinking. Seeing actual versus estimated income in one view makes it easy to spot where to focus.
2. Project Management Dashboard
Creative teams do their best work when the process around them is clear. Growing agencies are often managing dozens of projects across multiple clients, and keeping that straight is a significant operational challenge.
A project management dashboard consolidates the whole picture into a single view, connecting deliverables to targets so nothing slips through. Common metrics on this dashboard include:
Project Updates
Billable vs. Unbillable Hours per Employee, per Team/Project
Lost Hours Report
New Business Opportunities by Rep
Number of Data-Driven Audits Completed
KPI sample: Project Updates
!project management dashboard
Who's doing what and when? Project management tools like Trello, Asana, and Basecamp make it easy to track progress. That progress becomes even more useful when everyone on the team has complete visibility into it, without having to chase a status update.
Create custom dashboards for you and your team.
Get started with Klips3. Inbound Prospecting Dashboard
Agency growth requires a lot of hustle. Finding new clients is time-consuming, but many agencies never build formal processes around it, let alone track what the data is telling them about how well those efforts are working.
The agencies that grow sustainably tend to treat inbound with the same editorial discipline they apply to client work. A prospecting dashboard makes that possible. Metrics worth monitoring include:
Visits
Average Time on Site by Device
Session Duration
Goal Conversions by Page
Keyword Ranking on Top Terms
Conversion Rate
Page Performance
Website performance
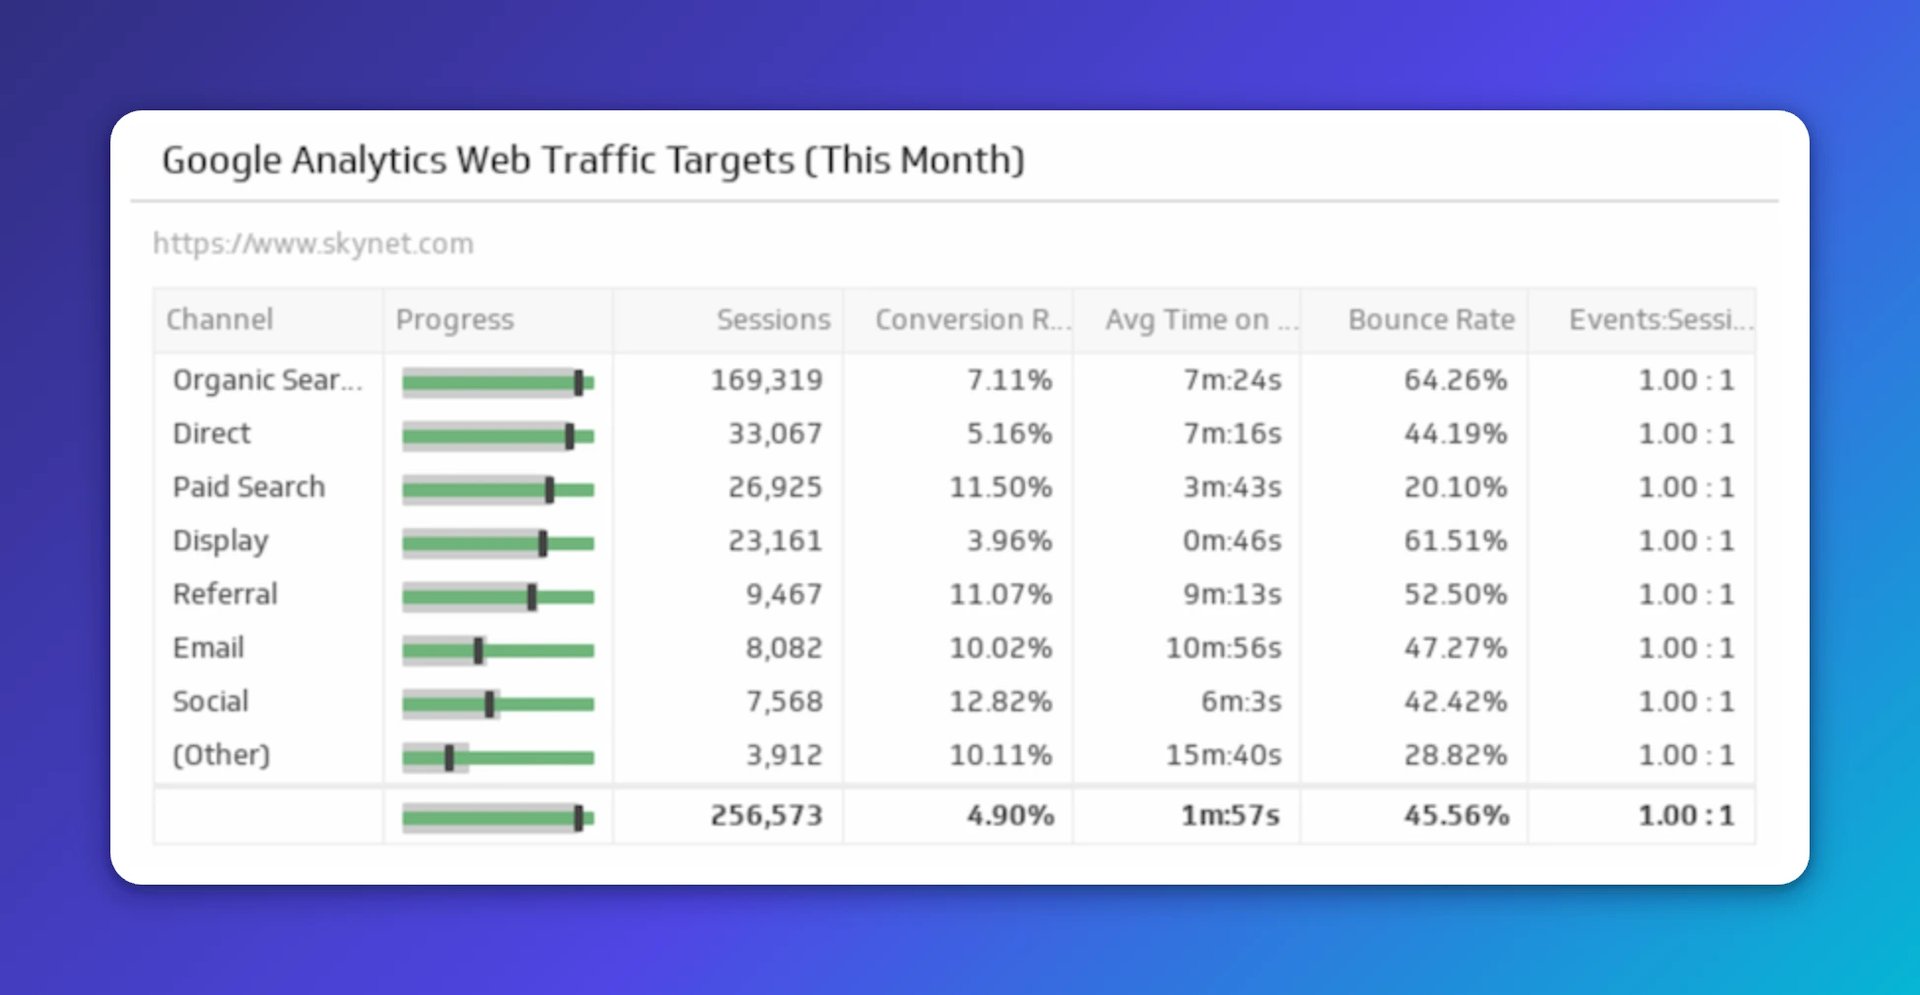
Your website is the foundation of any inbound strategy. Understanding which acquisition channels are actually working, rather than guessing, is what separates sustainable growth from unpredictable peaks and valleys. This is also a set of metrics your clients will want to see for their own sites.
4. Client Alerts Dashboard
This is where agencies can get creative. Some display a TV dashboard of their clients' social channels. Others use it to highlight client growth metrics in a shared office space, keeping the team focused on outcomes rather than tasks.
Metrics and content worth including here:
Social Media Handles
Google News Alerts (using IFTTT)
Client Case Studies
Client Testimonials and NPS Score
Social Media Command Centre
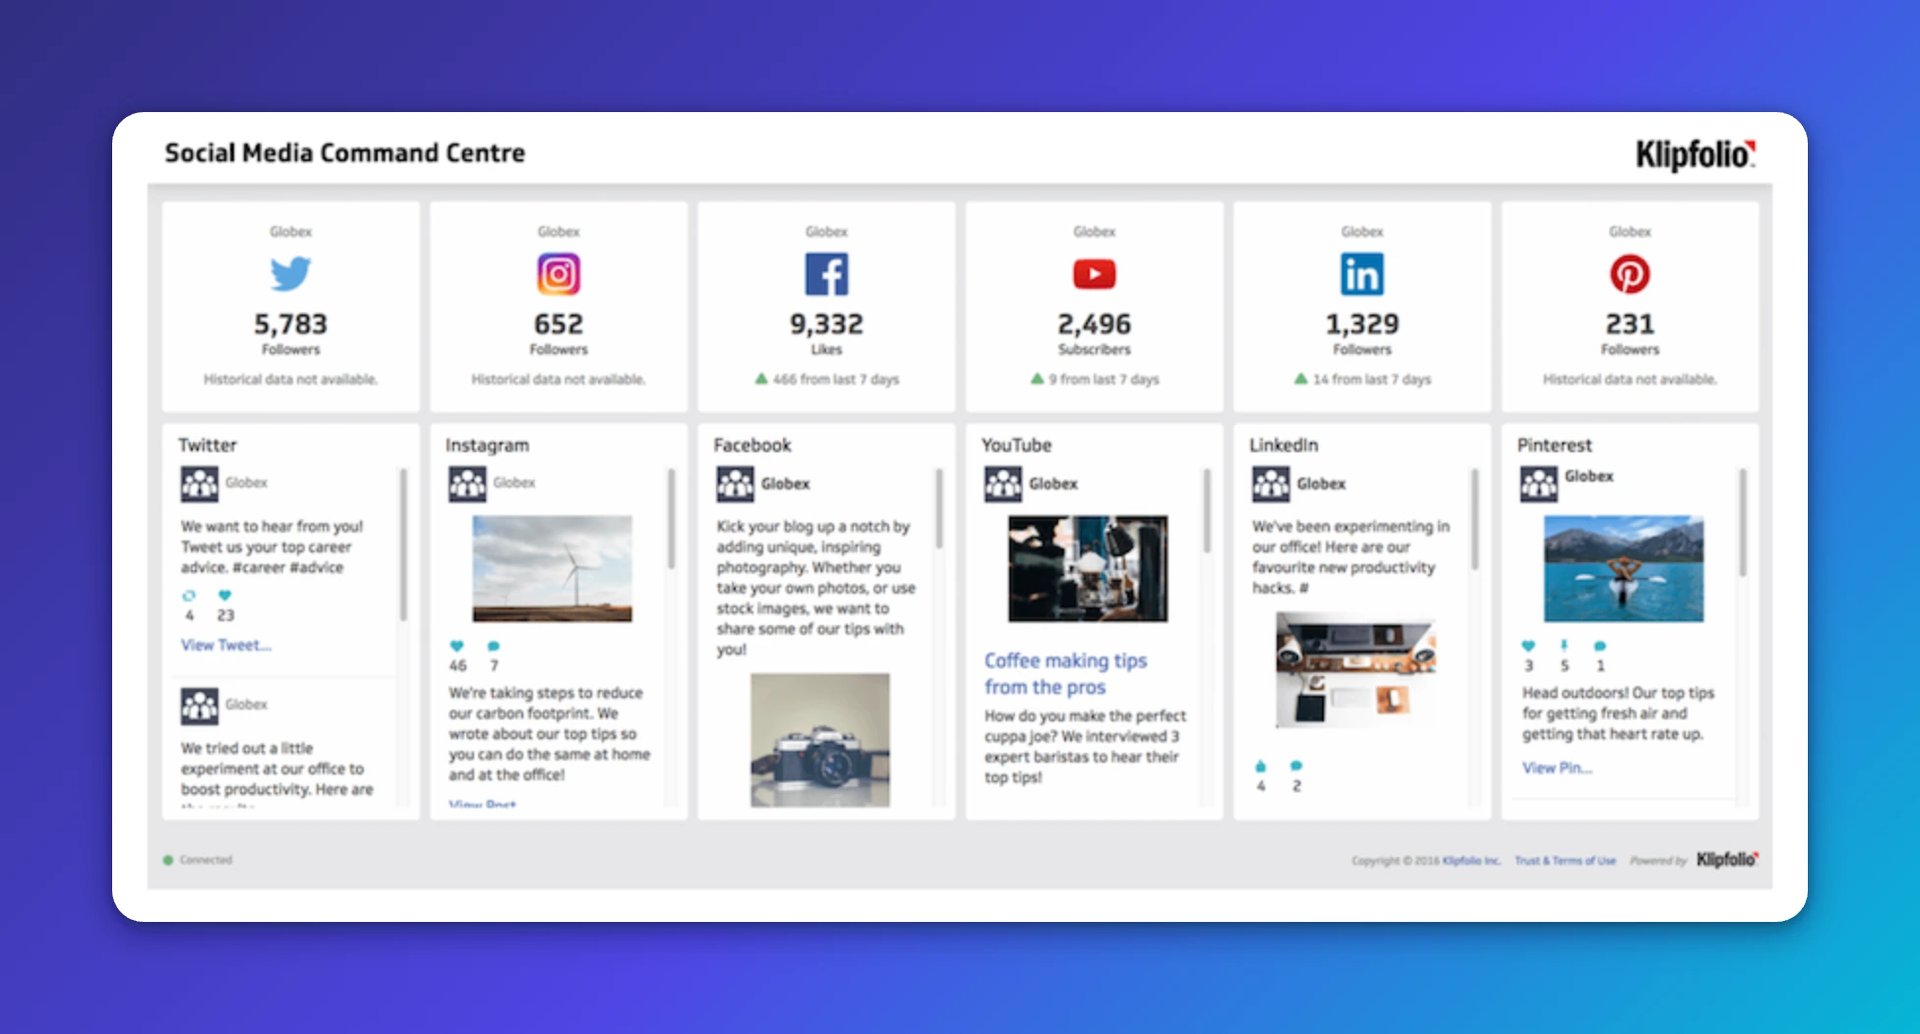
Easy to set up (thanks to a pre-built connection) and even easier to use, the Social Command Centre helps digital agencies keep their clients front and centre, with no manual updates required.
5. Marketing Performance Dashboard
Agencies spend a lot of energy on their clients' marketing. Their own marketing deserves the same rigour. Here are the metrics many agencies use to track their own marketing metrics:
Traffic and Lead Conversion
Channel Effectiveness
Content Effectiveness
Campaign Performance
Search Engine Marketing
Social and Community Engagement
Digital Advertising
Content effectiveness
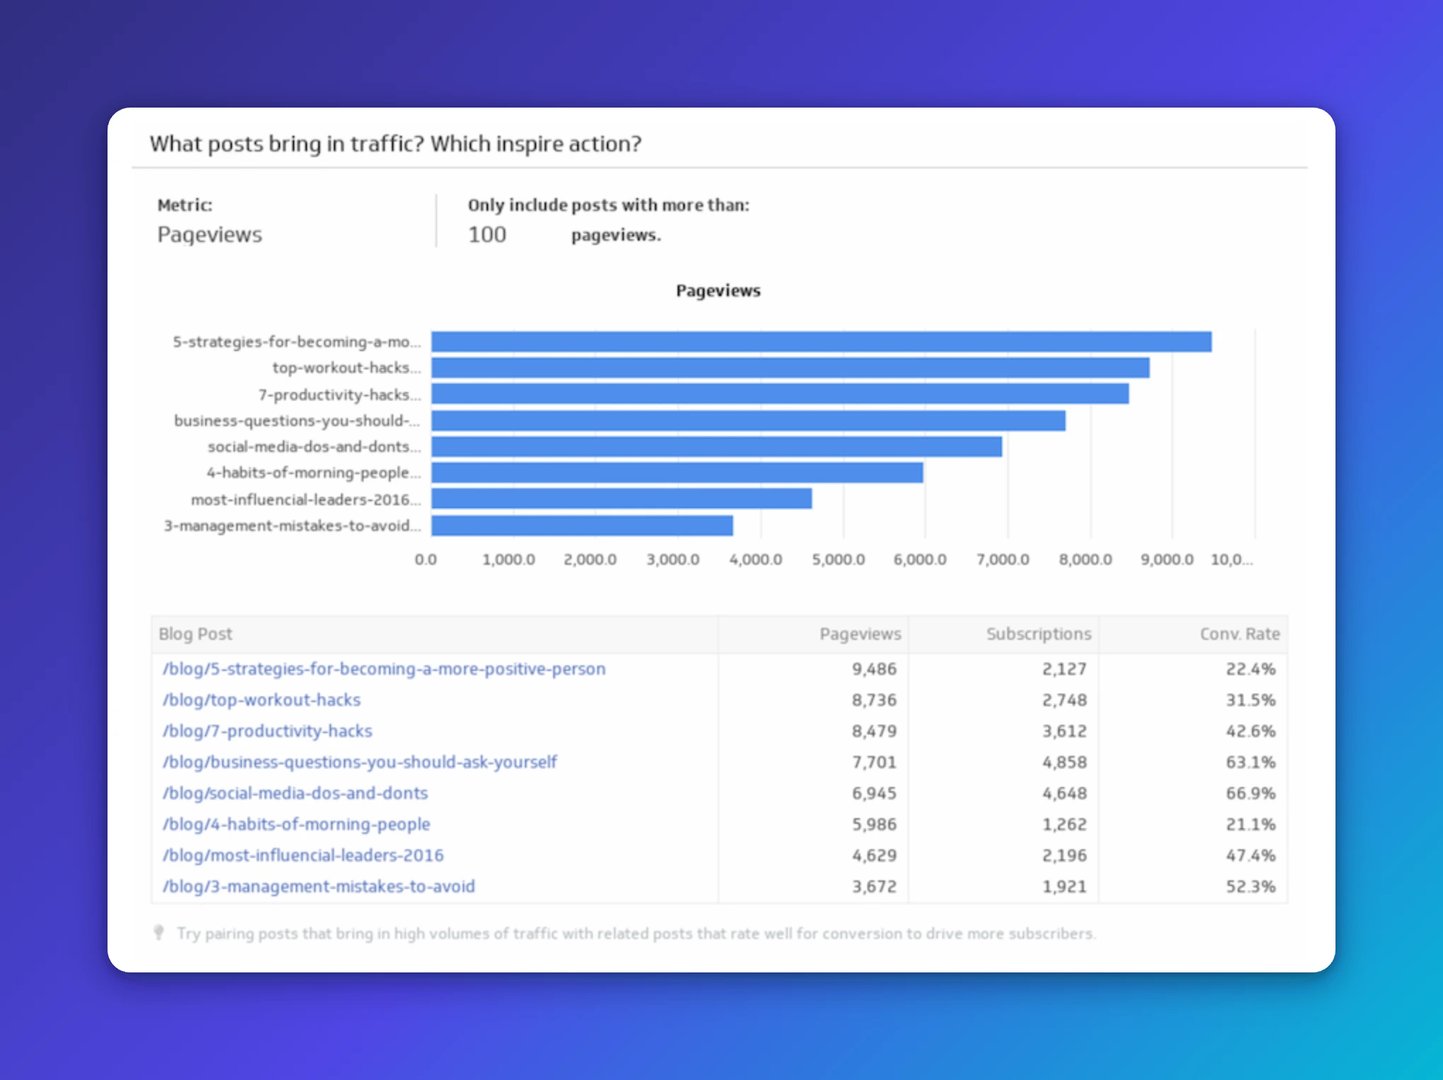
Pair content marketing with SEO and you get the core engine of inbound growth. Andy Crestodina helped us prototype this dashboard, and agencies rely on it because it shows which content is attracting and converting visitors, and where the next opportunity is, without having to dig through GA4 or paste data into a spreadsheet to figure it out.
Create custom dashboards for you and your team.
Get started with KlipsWhere does the data come from?
These dashboards pull from the tools agencies already use. Here's a typical agency tool stack:
Website: Hotjar, GA4
SEO: SEMrush, Moz, Ahrefs
CRM: HubSpot, Salesforce, Mailchimp, Pipedrive
Ads: Meta, Google
Dashboarding/Monitoring: Klipfolio
Accounting/Finance: QuickBooks
Billing/Project Management: Asana, Trello, Basecamp, Airtable
Klipfolio connects to 130+ data sources, so the data flows in automatically. The numbers stay current, the team stays aligned, and no one has to spend their morning pulling reports.
See also:
Published 2026-08-21
More in Agency Analytics

6 dashboards I use daily to run my SaaS company

The 5 most important SEO KPIs for digital marketing success

What are the best inbound marketing KPIs?

Klipfolio Partner How-To #1: Duplicating dashboards across client accounts

Top 10 Marketing Dashboard Ideas for Tech Companies
17 KPIs Every Data-Driven Manager Needs to Lead Their Team
Most recent
- AUG 11Beyond simple sign-ups: how True Trials and Activation predict growth
- JUL 7Why business leaders miss important trends in their dashboards
- JUN 19The best chart for the job: Visualizing data for non-technical users
- JUN 95 tips to understand (and organize) your restaurant data
- MAY 26Think in Horizons, Not Seconds
- MAY 2010 Cloud BI Dashboard Tools for Small Businesses in 2026