

5 content marketing opportunities you're probably missing (we were too)
Ever feel like your content marketing is as good as it's going to get? We did. Then we were shown what we were missing. Here are five ways to track and improve content marketing performance, and the decisions those metrics make possible.

Ever feel like your content marketing is as good as it's going to get? We did. Then someone showed us what we were missing.
Here's the story of how our small digital marketing team went from thinking we were nailing content marketing, to realizing we were out to lunch on some big opportunities, to actually doing something about it.
We'll show you five ways we now track our content marketing to improve performance — and the decisions those metrics make possible.
Frankly, we thought we were hot $&#!
We were (and remain) a small team of four digital marketers driving more than 100,000 people to our website every month with organic content. We had content ranking in the top three for over 1,300 search queries.
Content marketing plan? Check. Tracking key marketing metrics like reach, engagement, and conversions? Check. We were happy with the results, and critically, we were satisfied.
Then we started talking with Andy Crestodina, an SEO and content marketing strategist with 16 years as a web practitioner, speaker, and writer.
On a call, Andy walked us through Google Search Console and shared a few content optimization techniques he'd developed over the years. It turned out we'd been missing some significant opportunities. His tour raised questions we hadn't thought to ask:
Are we investing too much energy trying to optimize the wrong content?
Are we wasting high-ranking content?
Who is consuming our content? How? And what are they doing next?
I remember walking off that call with Jon, our Digital Marketing Manager, on a longer-than-usual trip down the street for coffee.
We were thinking: our numbers look fine on the surface, but we have a lot of work to do.
We were also energized. Andy helped us see that a few targeted adjustments to content and how it's described promised real gains in traffic, engagement, and leads. And our experience building custom marketing dashboards had us eager to track these new opportunities in real time.
Here are the five content marketing improvement opportunities we identified in the weeks that followed. They're a mix of live reports, metrics, and processes we put in place to monitor and improve our content marketing performance.
Top 5 content marketing improvement opportunities
1. Search rank improvement opportunities
In the past, we were all about new content. We were always looking for opportunities to add new posts and KPI library entries so we could rank on more keywords and queries.
That strategy was working. We were ranking on a growing number of keywords and reaching more of the long tail each week.
But the work was inefficient. We were spending a lot of time writing brand-new content, and not all of it was reaching or engaging the right audience. Some new content ranked well. Some ranked on page three, four, or five. Some drove zero traffic.
In our heads-down push to publish as much as possible, we were missing lower-hanging fruit: previously published, moderately performing content. Optimizing that content can deliver significant gains in visibility and traffic with moderate effort.
Tip: Prioritize optimizing content that ranks at the top of page two of Google search results to get the biggest return on your time investment.
Here's why: The difference in value between ranking on the first page of organic search results and any page after it is significant. Research suggests that only 8.5% of search traffic makes it past the first page. But pushing a result up many positions takes real effort, especially in competitive keyword categories.
Focusing on content sitting at the top of page two is a practical way to get value from your optimization efforts. Moving a result from position 11 to position 10 takes far less effort than moving it from position 15 or 20, and the payoff is immediate.
Here's how:
View the average search rank position of your web content in Google Analytics (Acquisition > Search Console > Queries).
Filter the results to display only listings with an average position of 11 or 12 (Advanced > Add a Metric > Avg Position). This is the content currently sitting in the top two positions on page two.
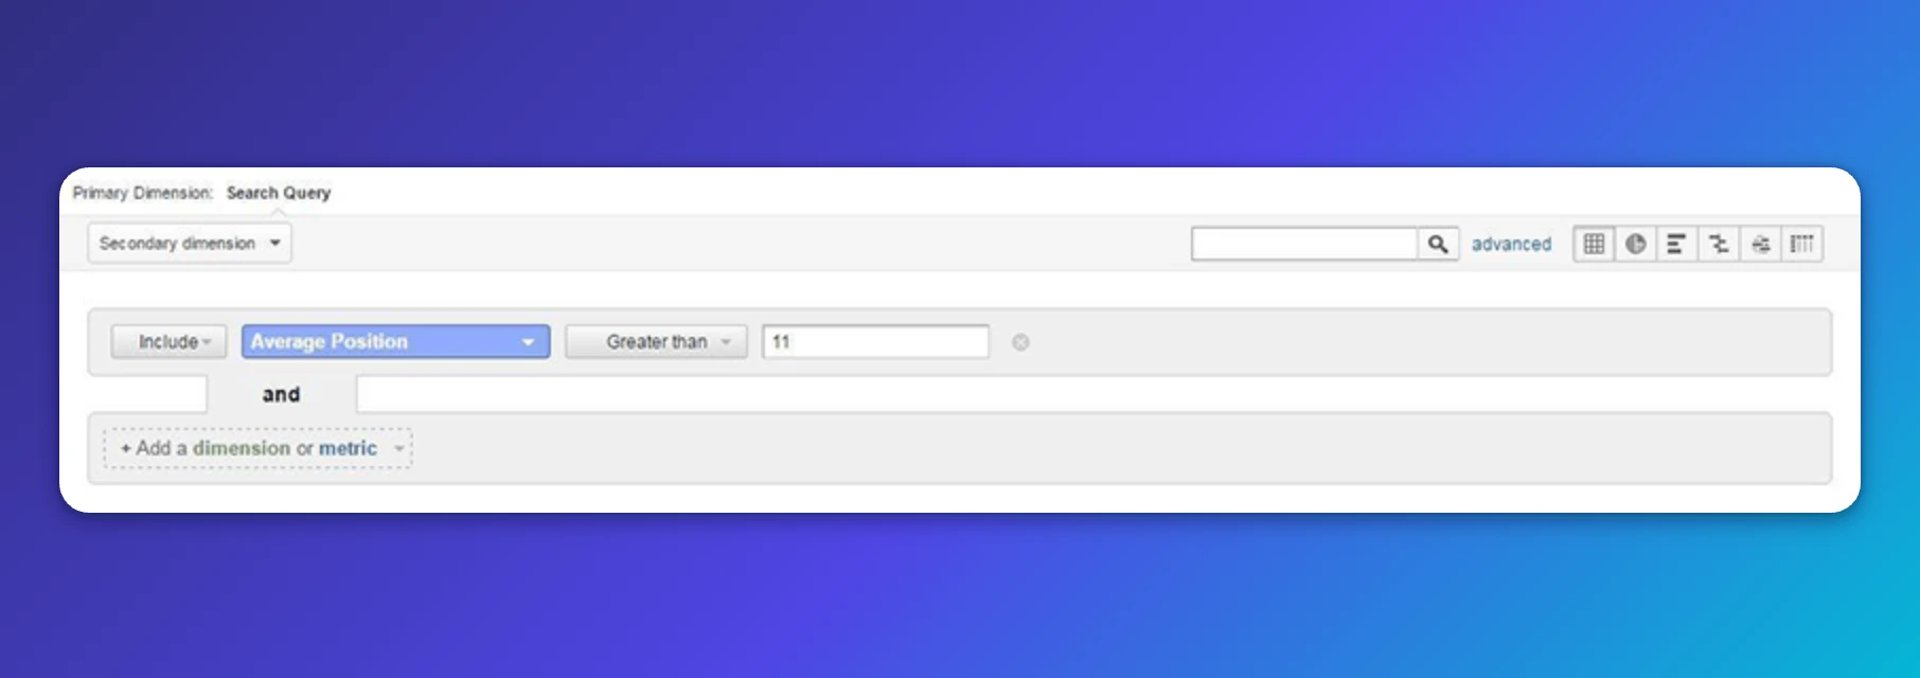
- Review the data. You can do so directly in Google Analytics or export to Excel. We automated the retrieval of this data in Klips and built this data visualization for a quick view of our performance:
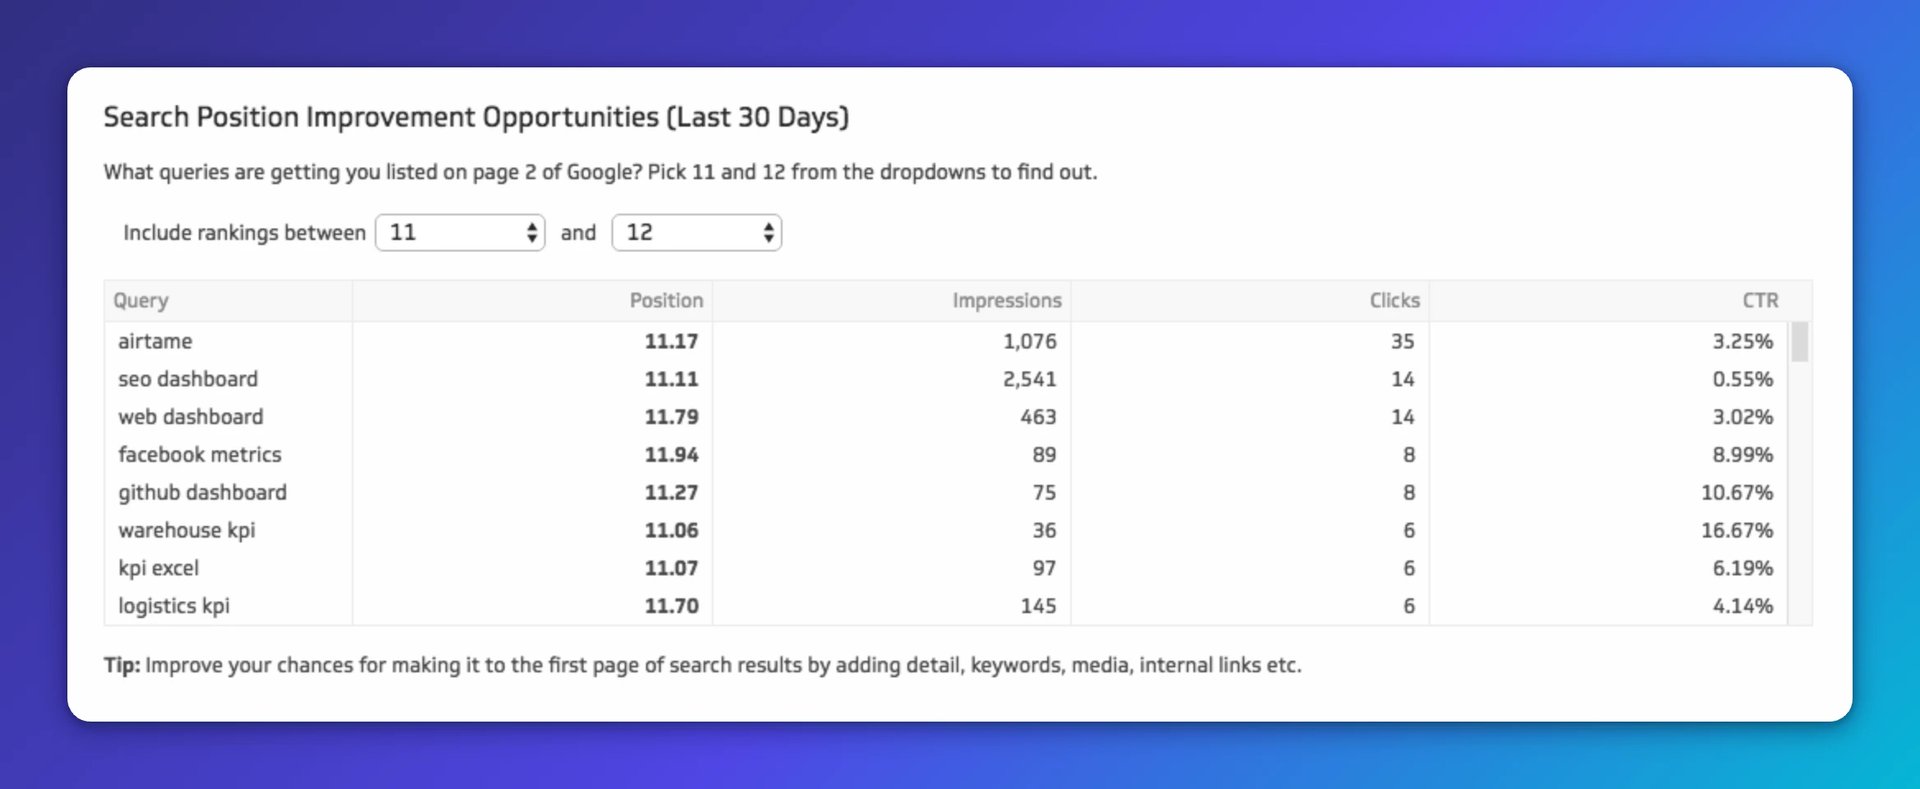
This visualization helps us prioritize which content improvements will deliver the highest return: moving content from page two to page one of search rankings.
Looking at it, we could quickly see that small adjustments to certain content could yield significant dividends. In this example, we'd focus on the content ranking 11th for "SEO dashboard" and "Facebook metrics" because those queries show decent impressions and a reasonable click-through rate at position 11.
Next steps:
Once you've identified which content to focus on, here's how to optimize it:
Above all, create content that is useful to the reader. Your content should address the question, problem, or topic driving the search. In his book CTRL ALT DEL, Mitch Joel writes that you should prove value before you expect people to spend a dime. Think about content marketing as helping people make informed choices, not hard-selling them.
Think about what you want to know when you shop for goods and services. That's a realistic guide for which questions your content needs to answer: What will this cost? What benefits will I get, and in what timeframe? What are the risks? How are you better than Competitor X?
Incorporate keywords wisely. Make sure the keyword or phrase you're targeting appears in the title and once in the first sentence. Sprinkle the keyword and related terms in H2 headings (for example: if your keyword is "ice cream," a good H2 might be "types of ice cream cones").
Keep content lean and rich. Unless essential for understanding, avoid symbols like exclamation marks and dollar signs, excessive bolding or italics, or stop words.
A few more tips on rich content:
Make content at least 300 words long. More content generally signals richer content to search engines.
Embed images and videos. They improve the reader's experience and receive their own search rankings.
This one's from Crestodina himself: include photos of your team. Doing so humanizes your company and creates additional ranking opportunities.
Optimize meta descriptions. Google bolds mentions of a search query in SERPs. An optimized meta description contains the target keyword phrase and is a compelling summary of why readers should click. We cover this in 5 Easy HTML Tags Anyone Can Code and Every Webpage Needs.
Don't overlook internal linking. In this post, Andy outlines how links among pages within your domain can boost authority for individual pages, raising the chance they'll rank. Internal links are yours to control, and they're fast and free.
Create custom dashboards for you and your team.
Get started with Klips2. Click-through rate (CTR) improvement opportunities
Back to our power trip.
We were feeling good about how our organic content was ranking. We were in the top three for a lot of the keywords we were targeting.
But so what? Who cares if your content ranks well if it's not pulling in relevant traffic?
On our walk with Andy, we learned that our number-one ranked post for a given query was capturing only 10% of all clicks for that query. Ten percent. It was click-through Teflon.
Realizing our high-ranking content wasn't converting impressions into visits was a tough pill to swallow. But as we discovered with a bit more research, it wasn't necessarily the content that was the problem. It was the description of the content in the search results.
Tip: Measure the SEO effectiveness of organic content by comparing the click-through rate the content should be receiving (based on its average search ranking) with the click-through rate it's actually receiving.
Here's why: According to a CTR study by Advanced Web Ranking, content ranked first on an organic search query draws about 30% of all clicks for that query. Content ranked second tends to generate a CTR of about 15%, and third-ranked content usually achieves around 10%.
This research, also supported by a study from the online ad network Citika, confirms what we all intuitively know: the higher your organic content ranks, the higher your CTR should be. It also gives us benchmarks to work toward:
| Organic search rank | Benchmark CTR |
|---|---|
| 1 | 30% |
| 2 | 15% |
| 3 | 10% |
| 4 | 7% |
| 5 | 5% |
Here's how:
View the average search rank position and CTR of your content in Google Analytics (Acquisition > Search Console > Queries).
Export the report to Excel and add a "Benchmark CTR" column next to the actual CTR stats (write a formula to pull in the correct benchmark based on average search ranking). Then add a column to calculate the difference between benchmark and actual CTR. We skipped Excel and built this real-time data visualization in Klips:
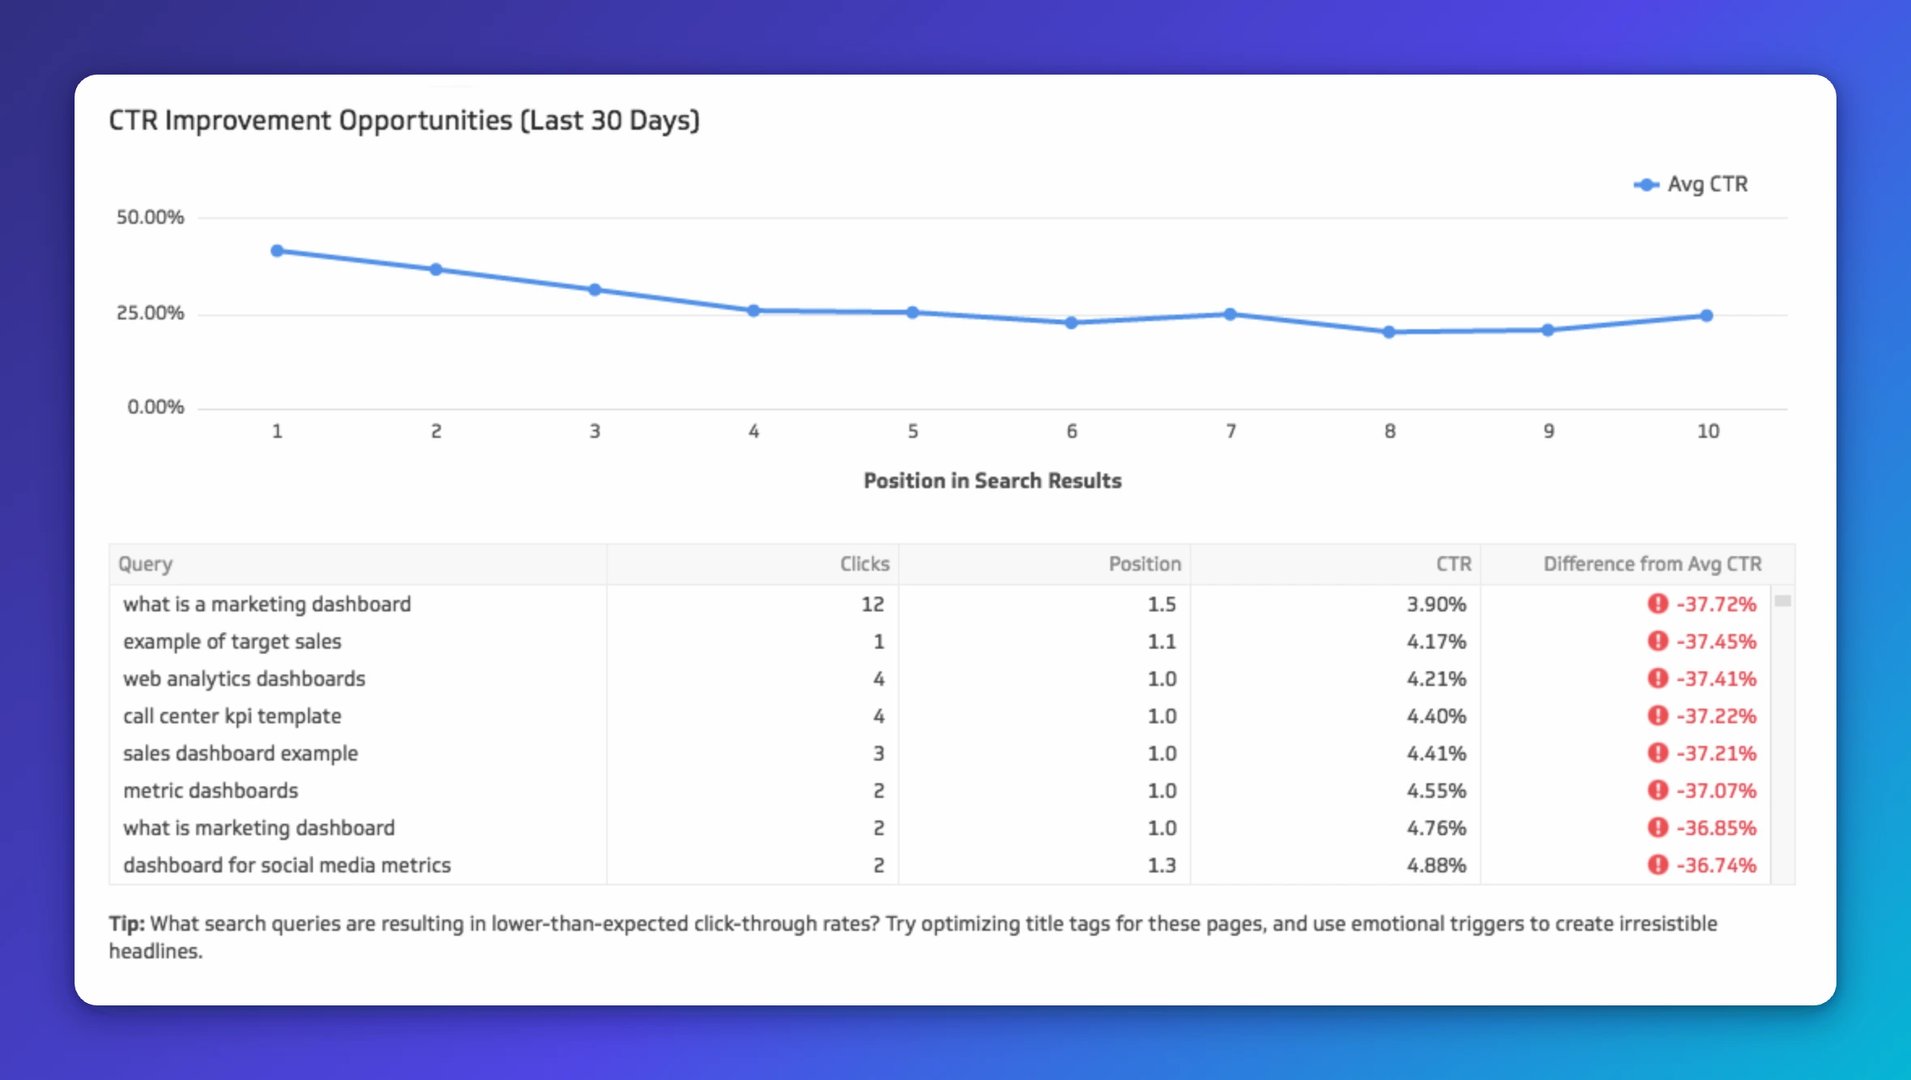
This visualization gives us quick visibility into where our top-ranked content is performing or underperforming against benchmark CTRs.
Measuring actual CTRs against benchmarks made it immediately clear where the biggest opportunities were. Improving CTRs on high-ranking queries would meaningfully increase the flow of traffic to our site, without writing a single new word.
Next steps:
If your CTR is underperforming relative to your search rank, there are two things you can adjust immediately: the title and the meta description.
Here are some do's and don'ts from Andy Crestodina on how to optimize both:
Do:
Know the right words to use with each type of user. Check out Andy's post 131 Words That Increase Web Traffic for a list of words that attract buyers, encourage clicks, and make people want to share.
Add numbers to your title tag.
Add an adjective with emotion (sometimes negative emotions work too — see the 131 Words post linked above).
Add a specific benefit to the title. Instead of "Home page title tag best practices," try "9 killer home page title tag tricks for higher CTR."
Don't:
Remove the target keyphrase, or you risk hurting your ranking.
Write a title tag longer than 55 characters, or it will get truncated in SERPs.
3. Top posts by page views and conversion rate
Another mistake we used to make, especially with high-traffic, top-of-the-funnel content, was making the wrong ask or no ask at all.
We'd drive a lot of traffic to a post like Best Practices For Picking The Right KPIs For Your Business, which appeals to a wide segment of our audience, and then embed product CTAs like "Add This Data Visualization to Your Dashboard" or "Start Your Free Trial."
Those CTAs disrupted the natural flow of the post, which reduced engagement. And because most visitors had little or no knowledge of our company or product, the CTAs were ineffective. Click-through rates were low.
The disruptive CTAs also broke the small amount of trust visitors had invested when they clicked our title in the SERP. A lot of them bounced and never came back.
A second mistake was producing top-of-the-funnel content with no direct CTAs at all. We'd publish posts defining metrics and KPIs relevant to our audience and hope visitors clicked links to middle-of-the-funnel content placed in and around the post. Most read what they wanted and left, and we didn't know who they were or how to reach them again.
These mistakes were costly, especially when high-traffic content generated no leads. Here's what we learned:
Tip: Pair content at different levels of the marketing funnel with CTAs that fit the stage of the buyer journey your audience is in.
Tip: Link top-of-the-funnel traffic-generating content with bottom-of-the-funnel conversion-driving content to improve conversion rates and volume.
Here's why: If you're attracting visitors to pages from which people tend to flee, what's the value of drawing them there in the first place? As Andy Crestodina puts it, "It's like constantly refilling a leaky bucket instead of just fixing the leak."
Many viewers of your top-of-the-funnel content will know next to nothing about your company or product. This may be their first time on your site. They may not even recognize the problem you're trying to help them solve. They're in discovery mode.
Trying to sell them something at this early stage won't work. As content marketing expert Barry Feldman notes, "Only 2% of first-time website visitors make purchases — and that applies to carefully crafted websites optimized for conversion."
It's all about context. James Ellis, VP of Inbound Marketing at TMP Worldwide, puts it well: "Everyone thinks the problem is the quality of content. It's not. It's usually more about context. Offering pizza to someone who isn't hungry won't get you many pizza sales." More of James's perspective on effective content marketing is here.
Think about your audience's motivation for visiting your top-of-funnel content, and don't try to serve bottom-of-the-funnel CTAs before they're ready to act.
Instead, drive visitors toward complementary content that's a step further down the funnel. Once you've earned their trust, you can start weaving in your product and making your ultimate ask.
Building your content funnel to actually work like a funnel is the key to driving high-volume, qualified leads toward a decision. To do that well, you need to know what content generates the most traffic and what content drives the most conversions, so you can connect them.
Here's how:
View page views and conversion rates in Google Analytics (Behaviour > Behaviour Flow > Site Content > Content Drill Down).
Evaluate the data. What content is receiving the highest page views? What content is producing the most product-related conversions (demo sign-up, trial start, purchase, etc.)? We built the interactive visualization below so we don't have to go fishing for answers in Google Analytics. This example uses Subscriptions as the conversion metric, but you can substitute any goal you've set up.
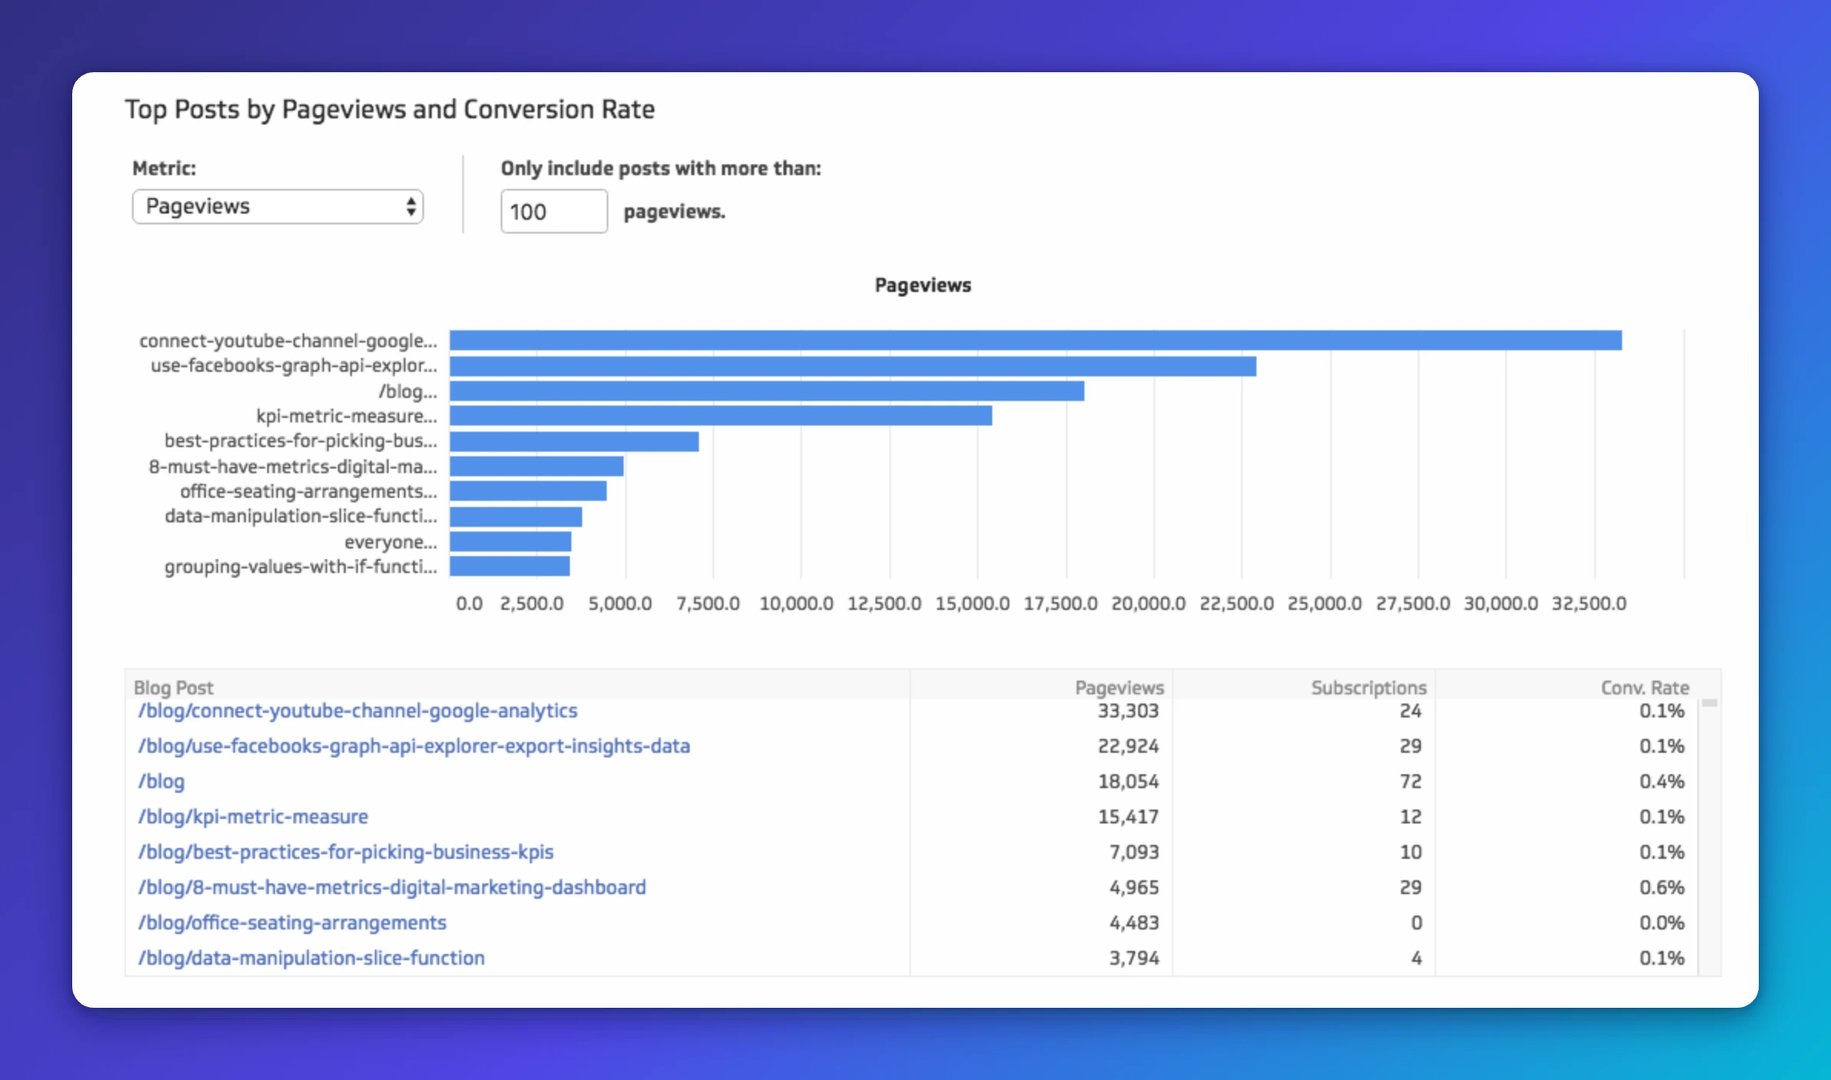
This visualization lets us quickly toggle between top-performing content by page views and conversions, so we can map out a logical linking strategy.
Next steps:
Once you've identified your top traffic-driving and top conversion-driving content, you can build a linking strategy to move visitors further down the funnel.
First, re-evaluate your high-traffic content. If it's top-of-the-funnel, strip out CTAs related to your product or service.
Consider adding relevant offers — what Barry Feldman calls "lead magnets."
In Barry's words, "Lead magnets are free offers you make in exchange for an email address (and possibly additional information)." Free offers might include an ebook, a video, or an infographic. What makes an offer magnetic is relevance, specificity, authority, value, and the promise of instant gratification.
Next, identify complementary content that's a step closer to your value proposition. This should be content that overlaps a sub-topic or theme from the top-of-funnel piece and touches on why your product or service matters. Having several secondary pieces catering to slightly different audience segments gives you more flexibility.
For example, if you sell accounting software and you've published a top-of-the-funnel article like "Study Tips for the CPA Exam," secondary content you could link to might include "Accounting Tips for Tech Startups" and "Cloud Accounting Security Considerations for Enterprises." These pieces help you qualify and segment leads, so you can serve more targeted content further down the funnel and convert more visitors into customers.
4. Behaviour flow and flow-through rate
As we took a harder look at our top traffic-generating and top converting content, we started thinking more about the journeys people were taking through our site.
How many pages were people exploring after that first content experience?
What path were they taking?
Were they diving deeper into our product with each successive piece of content? Or were they skimming the top-of-the-funnel content and leaving?
We wanted to find out.
Tip: Track where users go after they've consumed an initial piece of content on your site to understand them better and evaluate the effectiveness of the buyer journeys you've mapped out.
Here's why: Understanding what visitors do after their first content interaction tells you more about who they are. That knowledge helps you serve more relevant content to drive deeper engagement. It can also reveal a targeting problem: if you've published content you expect to resonate with your audience but your bounce rate is high, your search result description may be attracting the wrong people.
Tracking post-first-interaction behaviour also tells you how well your content layout, internal linking strategy, and site navigation are working. If things are working, engagement and conversions go up.
Here's how: Google Analytics' Behaviour Flow report helps you understand the path users travel through your content and, more specifically, how effective your top-of-the-funnel content is at drawing users deeper into your site.
Access the Behaviour Flow report in Google Analytics (Behaviour Flow > Pages and Events).
In the second drop-down list, next to "Pages and Events," select the web page you'd like the report on.
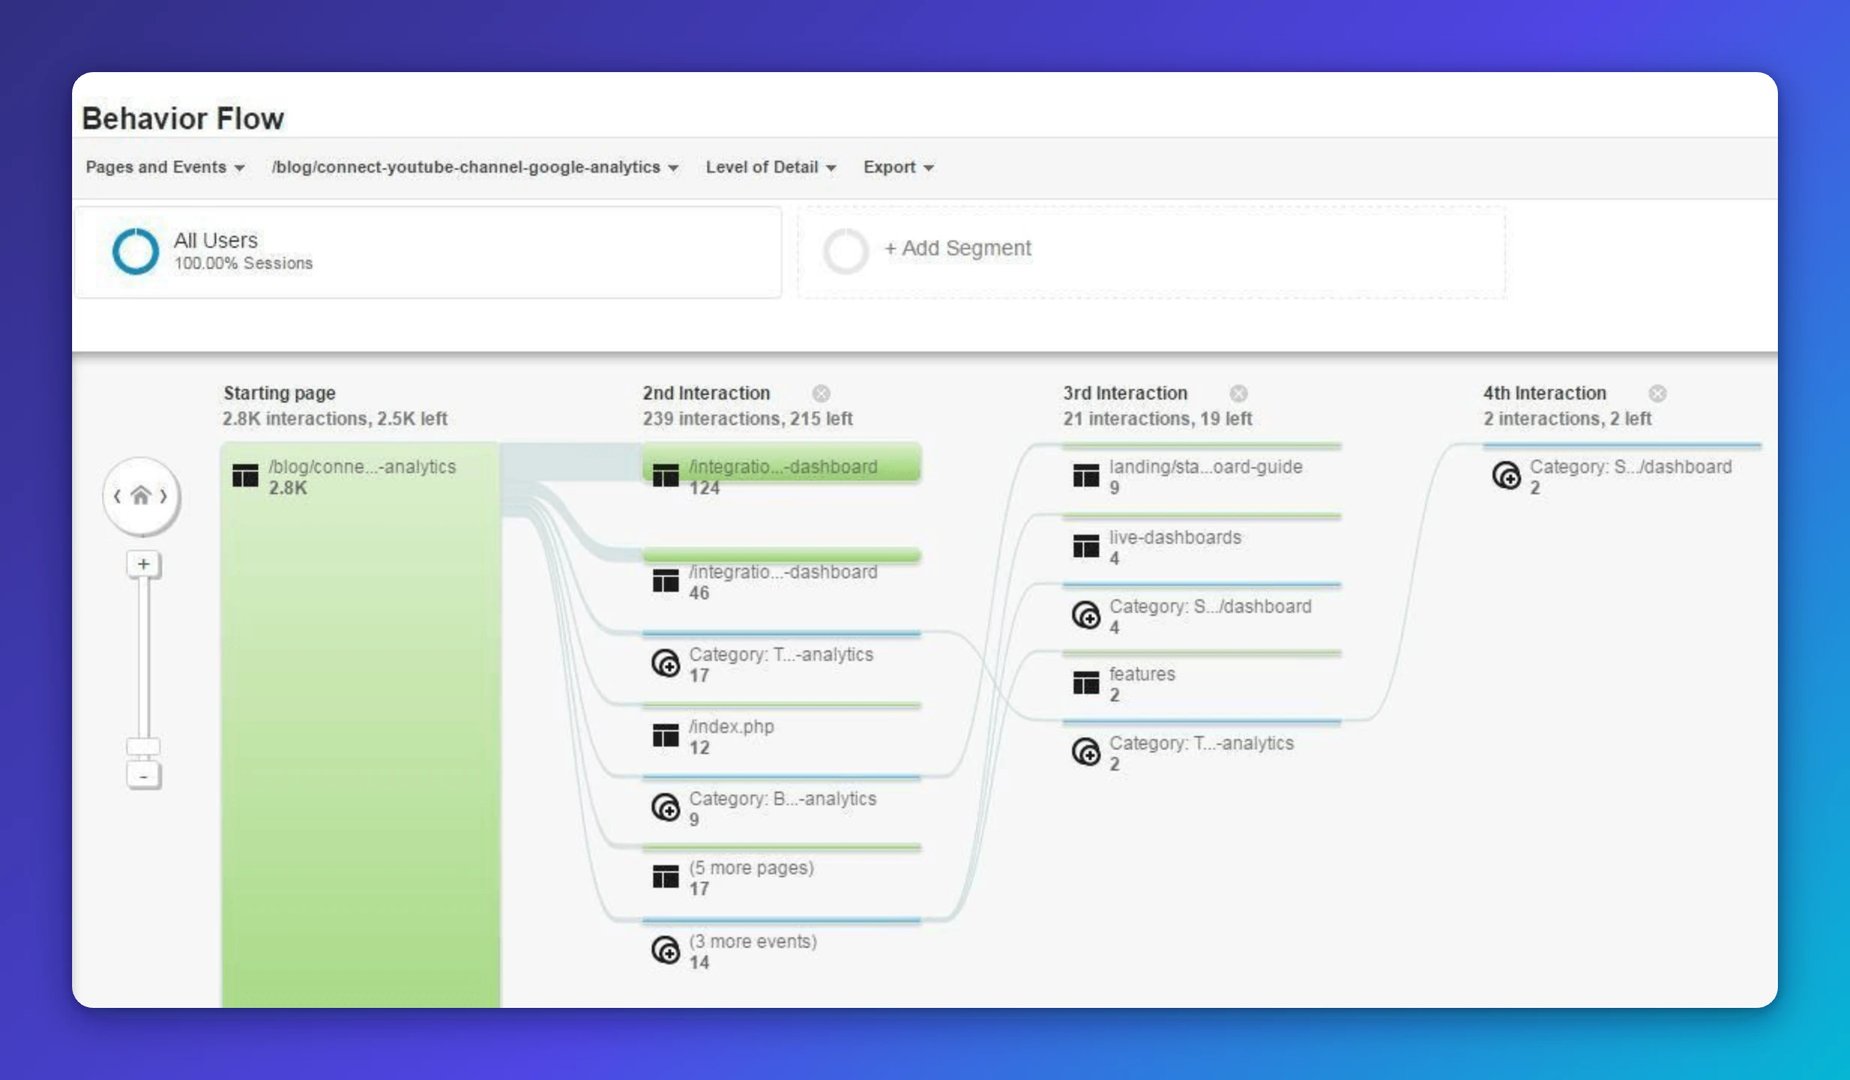
- Review the data. While this report gives useful information, it's not the most intuitive visualization. We built this view in Klips to get actionable information faster:
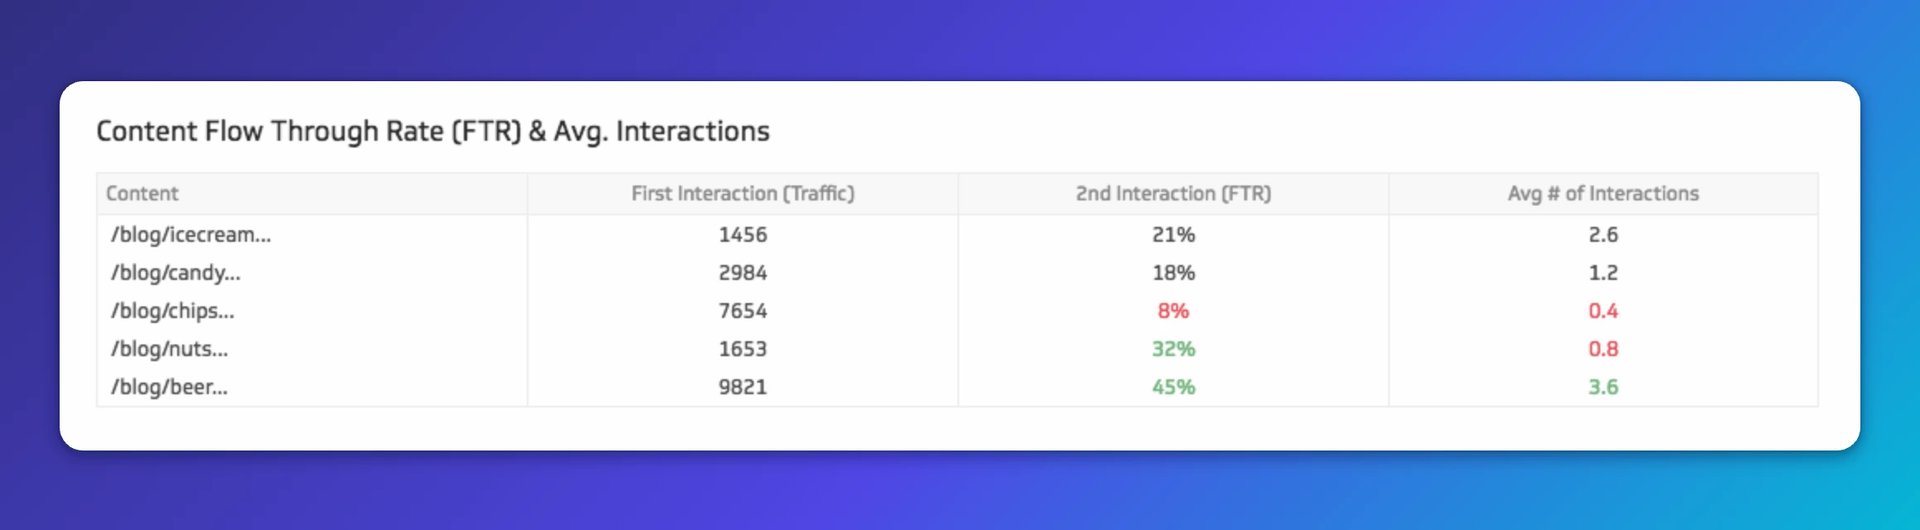
This visualization shows which top-of-funnel content drives the deepest engagement, based on how many internal pages are viewed after the first page is visited.
A low "Avg # of interactions" (highlighted in red) tells us where users are checking in and immediately checking out. A high number (highlighted in green) tells us what content is pulling people further in.
Next steps:
If only a small fraction of users are exploring your site, or most are leaving after the first page view, look closely at the following:
Internal links. Not only do internal links boost page rankings, they're critical to the user journey. Are you using them frequently and appropriately, offering links to related information when and where users are most likely to want it?
Audience. Is your top-of-funnel content attracting the right audience for your middle and bottom-funnel content? You can learn more about who's viewing your content by (a) setting up an audience segment in Google Analytics and viewing traffic through that lens, or (b) using Google Analytics' advanced API Explorer to pull specific audience data for specific content.
Content quality. Is your content well-written and engaging? Consider it from the reader's point of view: is it clear and concise? Is there a compelling thread? Ann Handley offers a lot of advice on writing quality content, and tools like the Hemingway App and Grammarly.com can help you evaluate and improve readability.
Don't underestimate the value of visual communication as part of the overall reading experience.
- Overall site navigation. Is your site navigation clear and succinct? Here are some best practices and common mistakes worth reviewing.
5. Scroll depth
Another question that came up once we started looking harder at our content marketing:
How are people actually interacting with our content?
Are they reading it? Skimming it? Opening it and immediately moving on?
We were already using standard page tags in Google Analytics to capture metrics like bounce rate, page views, and time on page. But reading Rob Flaherty, Simo Ahava, and Justin Cutroni, we knew we could learn more by setting up scroll depth as a custom event in Google Analytics.
Knowing how much of a page visitors are viewing might seem like a nice-to-know. But as Rob Flaherty points out (he developed the Scroll Depth plug-in we point you to below), the real insight comes when you correlate scroll depth with other metrics.
Which areas of your site tend to be read more thoroughly?
What's different about how first-time versus returning visitors explore?
Where do different reader types tend to come from?
Before we tracked scroll depth, we didn't know. Now, these combined metrics give us clear signals for optimizing content topics, length, navigation, and linking.
Tip: Set up and track scroll depth as a custom Google Analytics event so you can see who's reading your content, who's skimming it, and who's skipping it.
Here's why: Knowing whether and how people are consuming your content helps you create the right content for the right people, aimed at specific goals.
Maybe your long-form content drives traffic but isn't being read. Is it worth writing more of it?
Maybe visitors are jumping to the middle of the page for a specific snippet. Should you move it?
Are readers more likely than skimmers to visit a second or third page? Which segments are more likely to convert?
Here's how:
- You can build a custom event to track scroll depth in Google Analytics yourself, or use Rob Flaherty's plug-in: https://scrolldepth.parsnip.io/. The plug-in monitors scroll points at 25%, 50%, 75%, and 100%, and recognizes a baseline event. You can also trigger custom events to track when specific elements — videos, visuals, sections — scroll into view.
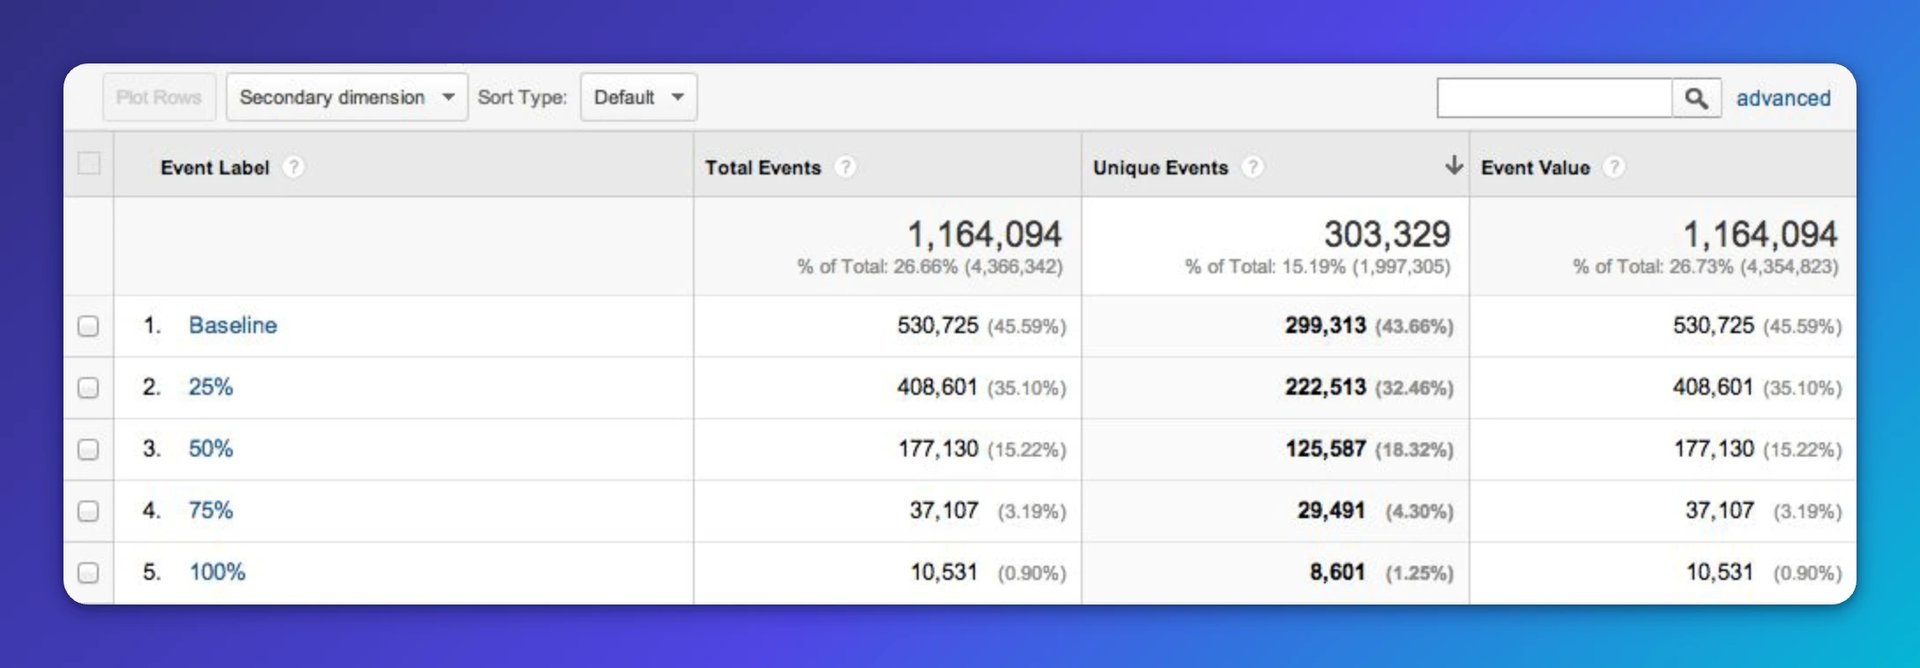
Source: medium.com/google-analytics/hacking-google-analytics-24762924fbf8#.mbdpu0y73
Next steps:
If users aren't travelling down your page, here's what to do:
Compartmentalize. Digesting information is easier when it's broken into smaller pieces, especially on a screen. Keep paragraphs short (three sentences or fewer) and use bullets and visual elements to help people scan and retain.
Show and tell. Graphics and video aren't just desirable — they're essential. They differentiate, personalize, and make content easier to take in.
Consider the position of visual elements. A principle Crestodina returns to often: always have at least part of an image visible on screen, so there's always something worth scrolling toward.
Tease out the point. Your readers won't invest time in content that doesn't signal value early. Don't save your best point for last. Hint at it up front and build toward it throughout the page.
Create custom dashboards for you and your team.
Get started with KlipsWe weren't "all that" and we still aren't
Our conversation with Andy Crestodina was an eye-opener. We'd been confidently driving down the Content Marketing Expressway without checking whether we were actually heading anywhere useful. Andy helped us slow down and ask better questions.
The five opportunities above aren't about doing more. They're about knowing more: which content deserves your attention, which pages are losing people, and which numbers you can actually trust. When your dashboard surfaces that clearly, you spend less time digging and more time deciding.
We've come a long way, and we're still learning. The difference now is that we're no longer satisfied with surface-level metrics, and that restlessness is what keeps us improving.
Do you have uncommon content marketing insights to share? How do you use less-common metrics to keep your content performing? We'd love to hear from you in the comments below.
P.S. Want to see how we built the metrics and data visualizations featured in this post? Check out this article: 4 Content Marketing Metrics You Should Be Watching Carefully - Here's How
Published 2026-08-23
More in Best Practices

The 5 ways to make your business partnership last a lifetime
The 5 most important SEO KPIs for digital marketing success

What are the best inbound marketing KPIs?
Why every digital marketer needs to learn how to deploy marketing technology

Top 10 Marketing Dashboard Ideas for Tech Companies
17 KPIs Every Data-Driven Manager Needs to Lead Their Team
Most recent
- AUG 11Beyond simple sign-ups: how True Trials and Activation predict growth
- JUL 7Why business leaders miss important trends in their dashboards
- JUN 19The best chart for the job: Visualizing data for non-technical users
- JUN 95 tips to understand (and organize) your restaurant data
- MAY 26Think in Horizons, Not Seconds
- MAY 2010 Cloud BI Dashboard Tools for Small Businesses in 2026