

6 data modeling techniques for better business intelligence
Learn the six most important data modeling techniques, why they matter for growing businesses, and how to choose the right approach for better reporting and decision-making.

Data modeling is the process of organizing and structuring data so your business can analyze it accurately and make better decisions. Before you can trust a number on a dashboard, you need a clear plan for how that data is stored, defined, and connected.
Every day, 2.5 quintillion bytes of data are created. For growing companies, that volume creates both opportunity and risk. The opportunity: richer insights than ever before. The risk: drowning in data that's poorly organized, inconsistent, or impossible to query.
Done well, data modeling turns a chaotic pile of raw data into a structured foundation your team can actually build decisions on.
What is data modeling?
Data modeling is the process of creating a visual or logical representation of how data is structured, stored, and related within a system. A good data model defines entities (the things you track), attributes (their properties), and relationships (how they connect).
For companies without a dedicated data team, data modeling is especially important. It's the difference between a reporting setup that answers business questions quickly and one that creates more confusion than clarity.
Why data modeling matters for your business
Data modeling isn't just a technical exercise. It directly affects the quality of your reporting, the reliability of your dashboards, and how confidently your team can act on what they see.
Here's what good data modeling delivers:
- Cleaner data: A well-defined model reduces duplication and inconsistency, so your reports reflect reality rather than a version of it.
- Faster answers: Structured data is easier to query. Your team spends less time chasing numbers and more time acting on them.
- Better decisions: When stakeholders trust the data, they use it. Data modeling builds that trust by making definitions explicit and consistent.
- Scalability: A model designed with growth in mind absorbs new data sources, metrics, and business units without a full rebuild.
Data modeling also acts as a shared language across teams. When marketing, sales, and finance all work from the same data definitions, you eliminate the "we're seeing different numbers" problem that slows down so many growing organizations.
6 data modeling techniques
Data modeling techniques vary in structure and purpose. The right one depends on your data complexity, your team's technical depth, and what you're trying to accomplish. Here's a breakdown of the most widely used approaches.
- Hierarchical model
- Relational model
- Network model
- Object-oriented model
- Entity-relationship model
- Dimensional model
Hierarchical model
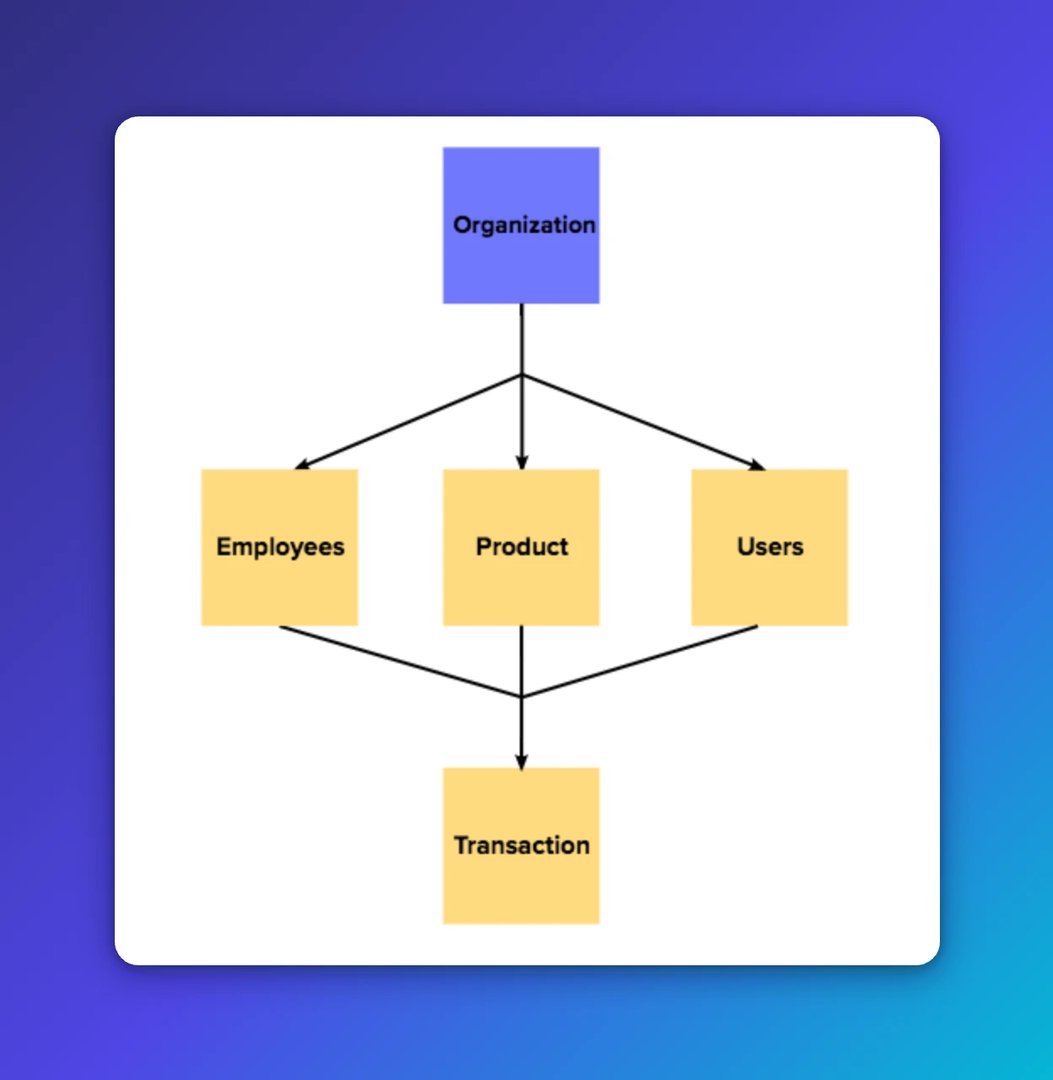
The hierarchical model organizes data in a top-down tree structure, where each record has one parent and can have multiple children. Think of it like an org chart or a file system: clear, predictable, and easy to navigate when the relationships are straightforward.
This technique works well for data with clean parent-child relationships, like organizational structures or product categories. The limitation is rigidity. If an employee reports to two managers, or a file needs to live in two folders, the model struggles. Forcing that kind of complexity leads to duplicated records and inconsistent data.
For companies with simple, stable hierarchies, this model is easy to implement. For anything more dynamic, a more flexible approach will serve you better.

Relational model
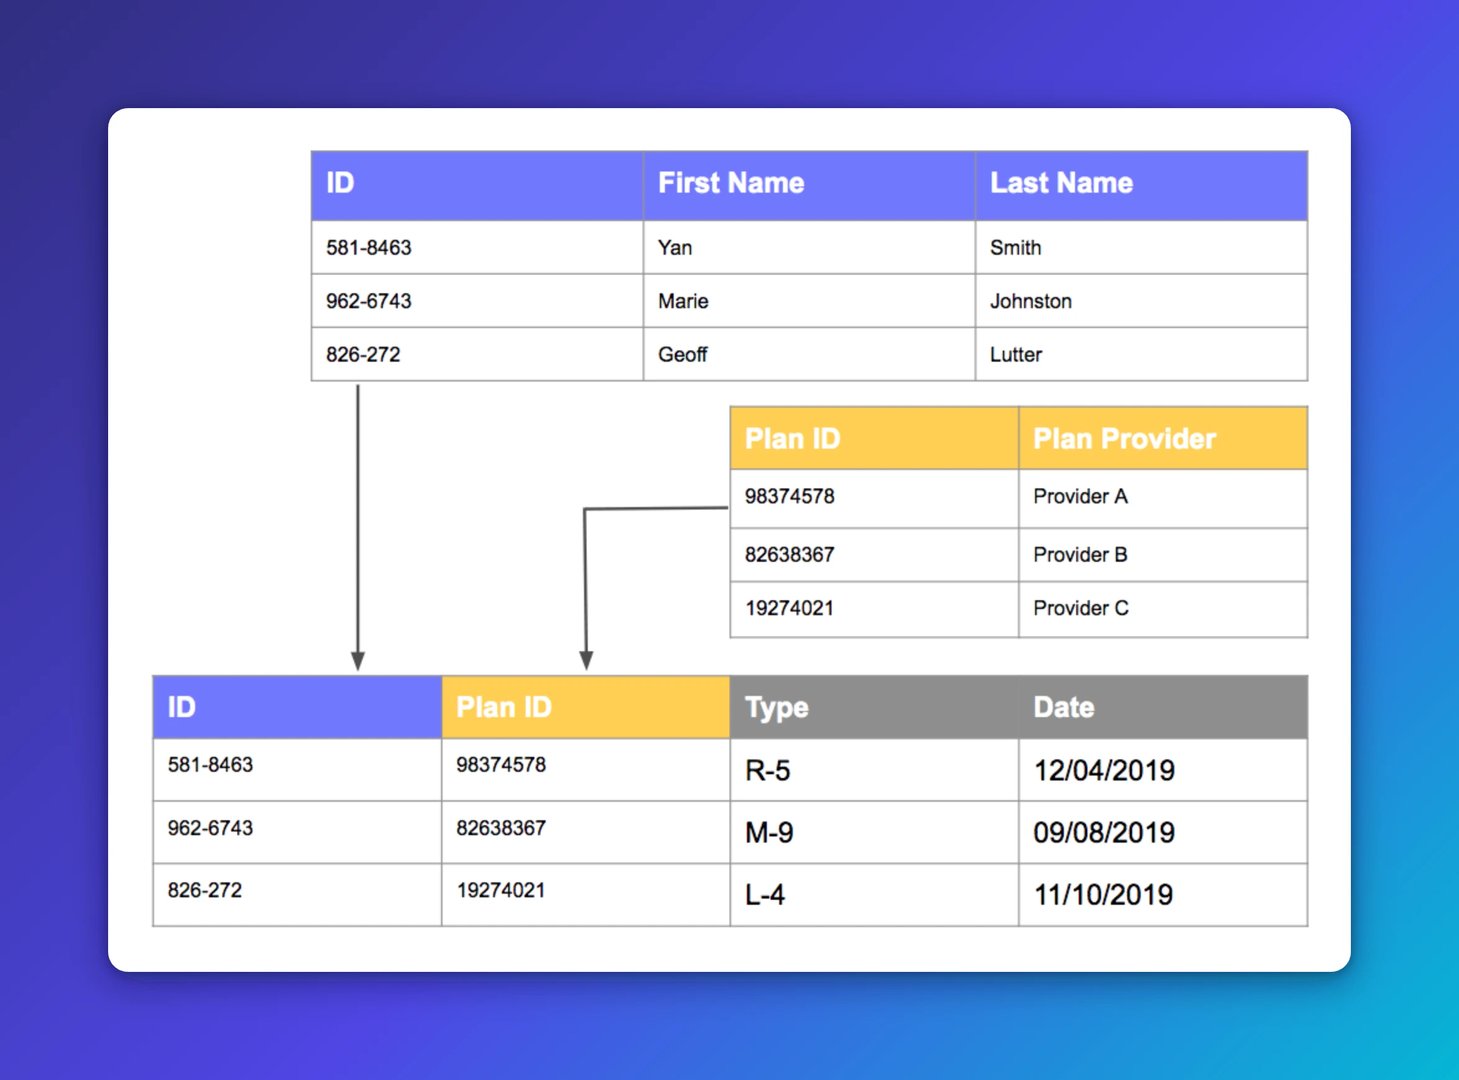
The relational model is the most widely used data modeling technique. Data is organized into tables (rows and columns), and those tables are linked through keys — shared identifiers that connect related records across the database.
Think of a well-organized spreadsheet where every sheet links to the others in a logical way. That's the essence of relational modeling. It's flexible, scalable, and supported by virtually every major database platform.
Relational models are used across industries: e-commerce platforms tracking products and orders, healthcare systems managing patient records, financial services logging transactions. If you're building or improving a database for the first time, relational modeling is usually the right starting point. It's also the approach most likely to give your team consistent, trustworthy numbers without requiring constant manual reconciliation.
Network model
The network model expands on the hierarchical approach by allowing records to have multiple parents, not just one. Data points connect to each other in a web-like structure, making it well-suited for complex, many-to-many relationships.
A supply chain is a good example: a single component might come from multiple suppliers, and those suppliers might serve multiple product lines. The network model can represent that complexity in a way the hierarchical model cannot.
The trade-off is navigational complexity. As the web of connections grows, querying and maintaining the model becomes harder. This technique is less common in modern applications, but it remains relevant for specialized use cases with intricate data relationships.
Object-oriented model
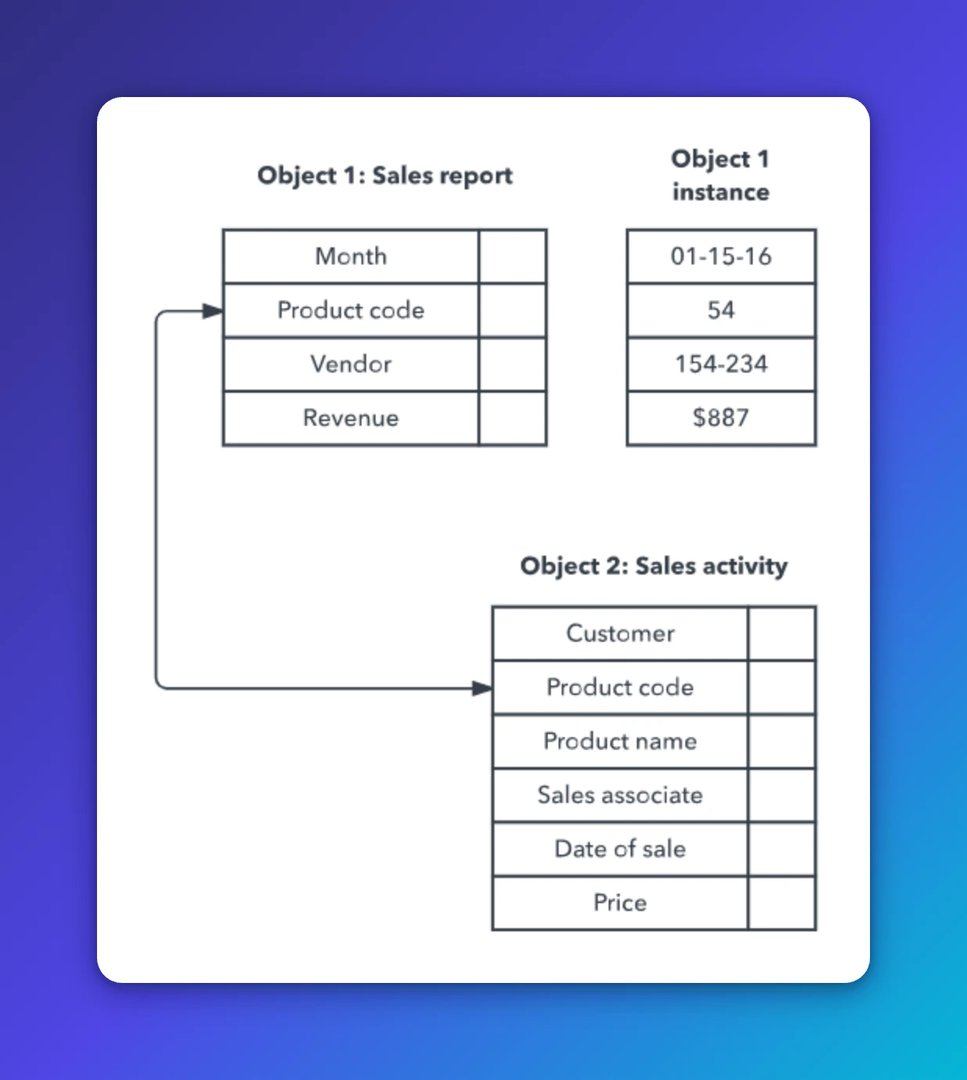
The object-oriented model represents data as objects, similar to how object-oriented programming languages like Python or Java work. Each object contains both data (attributes) and behaviour (methods), making it a self-contained unit.
This approach aligns naturally with how software developers think about systems. Objects can inherit properties from other objects, which reduces redundancy and makes the model easier to extend. It's particularly useful in complex software applications where data and logic are tightly coupled.
For non-technical teams, this model can feel abstract. But for companies building custom software or working closely with developers, it offers a clean way to model real-world entities and their interactions.
Entity-relationship model
The entity-relationship (ER) model is one of the most practical techniques for planning a database before you build it. Entities represent real-world objects (customers, products, employees), attributes describe their properties (name, price, role), and relationships show how entities connect.
Entity relationship diagrams make these connections visual. For a team planning a new database or auditing an existing one, an ER diagram is an excellent communication tool. It gives technical and non-technical stakeholders a shared view of how data fits together.
A university database, for example, might include students, courses, and instructors as entities. The relationships would show which students are enrolled in which courses and which instructors teach them.
Dimensional model
The dimensional model is purpose-built for analytics and reporting. It's the standard approach for data warehouses and business intelligence dashboards because it makes querying large datasets fast and intuitive.
The structure centres on two types of tables: fact tables (which store measurable data like revenue, units sold, or page views) and dimension tables (which provide context like time period, geography, product category, or customer segment). Together, they create a structure you can slice and filter from multiple angles.
A retail company might use a dimensional model to analyze sales revenue by month, by store location, and by product category — all in a single query. A SaaS company might use it to track subscription revenue by plan type, acquisition channel, and cohort.
If your goal is to build dashboards and reports that non-technical team members can use confidently, the dimensional model is often the best foundation. It's the structure that makes it possible for a founder or department head to open a dashboard and trust what they see, without needing to understand how the data was assembled.
How to build a data model: a four-step process
Data modeling follows a logical progression. Each stage builds on the last, moving from broad concepts to implementation-ready detail.
Step 1: Gather your requirements
Start by understanding what business questions the data needs to answer. Work with stakeholders across teams to identify the key entities (customers, products, transactions), the attributes that matter, and the relationships between them.
This stage is about discovery, not design. Ask: what decisions does this data need to support? Who will use it? How often does it need to be updated? The clearer your requirements, the better your model will be.
Create custom dashboards for you and your team.
Get started with KlipsStep 2: Build a conceptual model
A conceptual model captures the big picture without getting into technical detail. It identifies the main entities and their relationships at a high level, giving everyone a shared understanding of the data landscape.
Think of this as a sketch. For a retail business, a conceptual model might show that customers place orders, orders contain products, and products belong to categories. No column names, no data types — just the essential structure.
Step 3: Develop a logical model
The logical model adds detail to the conceptual sketch. Define each entity's attributes, assign data types, and specify how entities relate to each other. At this stage, you're still platform-agnostic: the goal is a complete, accurate representation of the data that any database system could implement.
A product entity in a logical model might include ProductID, ProductName, Price, and CategoryID. These definitions become the contract between business requirements and technical implementation.
Step 4: Create a physical model
The physical model translates the logical model into a specific database structure. This is where you define tables, columns, indexes, and constraints in the syntax of your chosen database platform.
For an e-commerce database, this might mean creating a Products table with columns like ProductID (primary key), ProductName, Price, and CategoryID (foreign key). Every decision at this stage affects performance, so involve your database administrator or a technically experienced team member.
Best practices for data modeling
Good data modeling habits save you from expensive rework later. These practices apply whether you're building your first model or improving an existing one.
Organize around facts, dimensions, filters, and order
Most business questions can be answered by structuring data around four elements: facts (what happened), dimensions (the context), filters (the time frame or segment), and order (how to rank or sort the results).
If you want to know which of your four regional offices generated the most revenue last year, your facts are total sales, your dimension is office location, your filter is the past 12 months, and your order is revenue from highest to lowest. Keeping this framework in mind helps you build models that answer real questions, not just store data.
Keep models simple and focused
A data model that tries to capture everything usually serves no one well. Focus on the data that directly supports your business decisions. Unnecessary complexity makes models harder to maintain, harder to query, and harder for non-technical users to understand.
Design for scale from the start
Business requirements change. New data sources appear. Teams grow. A model that can't accommodate change will need to be rebuilt sooner than you expect. Use consistent naming conventions, avoid hardcoding values, and structure your model so new entities and attributes can be added without disrupting what already works. Store your models in a version-controlled repository so changes are tracked and reversible.
Validate data accuracy at every stage
A data model is only as trustworthy as the data it contains. Build data quality validation checks into your process: verify that relationships are correctly defined, that key fields contain no nulls or duplicates, and that data flowing into the model matches its source. Regular audits keep your model aligned with reality and your team confident in the numbers they're acting on.
Check your work before moving forward
Data modeling mistakes compound. An error in your logical model becomes a structural flaw in your physical model, which then produces unreliable reports. Before advancing to the next stage, confirm that primary keys uniquely identify records, that foreign keys reference the right tables, and that your model answers the questions it was designed to answer.
Keep only the data you need
More data is not always better. Storing unnecessary data increases storage costs, slows query performance, and adds maintenance burden. If a dataset doesn't support a specific business question, leave it out or archive it separately.
Common challenges in data modeling
Even well-planned data models face obstacles. Knowing what to expect helps you address issues before they become problems.
Data quality: Garbage in, garbage out. If your source data contains errors, duplicates, or missing values, those problems will propagate through your model. Establish data validation and cleansing processes upstream, before data enters the model.
Changing requirements: Business needs evolve. A model built for last year's reporting requirements may not serve this year's. Build in flexibility, and plan for regular reviews to keep your models current.
Performance vs. normalization: Highly normalized models reduce redundancy but can slow down queries. Denormalized models query faster but are harder to maintain. Find the balance that fits your query patterns and update frequency.
Scalability: Start simple. Validate your initial model before adding complexity. Introducing more datasets gradually makes it easier to spot and fix inconsistencies early.
Cross-functional alignment: Different teams often use different terminology for the same concept. A marketing "lead" and a sales "prospect" might refer to the same person. Data modeling forces these definitions to be explicit, which reduces miscommunication and keeps everyone working from the same numbers.
Turn your data model into actionable insights
Data modeling techniques are the foundation of reliable business intelligence. Choosing the right technique, following a structured process, and applying consistent best practices means your data works for you, not against you.
For growing companies without a dedicated data team, this matters even more. A well-built data model means your dashboards reflect reality, your reports tell a consistent story, and your team makes faster, more confident decisions without waiting for someone to pull a number or paste figures into a spreadsheet and hope they add up.
Once your data model is in place, connect your data sources, build self-serve analytics dashboards your whole team can use, and turn structured data into business intelligence insights and goals that drive real results.
Published 2026-08-22




Most recent
- AUG 11Beyond simple sign-ups: how True Trials and Activation predict growth
- JUL 7Why business leaders miss important trends in their dashboards
- JUN 19The best chart for the job: Visualizing data for non-technical users
- JUN 95 tips to understand (and organize) your restaurant data
- MAY 26Think in Horizons, Not Seconds
- MAY 2010 Cloud BI Dashboard Tools for Small Businesses in 2026