
Dashboards and Reporting for SaaS Companies
Impress Investors. Align Teams. Trust Your Numbers.
Your SaaS company runs on CRM, billing, product analytics, and support tools. Klips pulls them into one view, applies clear metric definitions, and gives every team a dashboard that matches how they work. Less spreadsheet scramble, more investor-ready clarity.
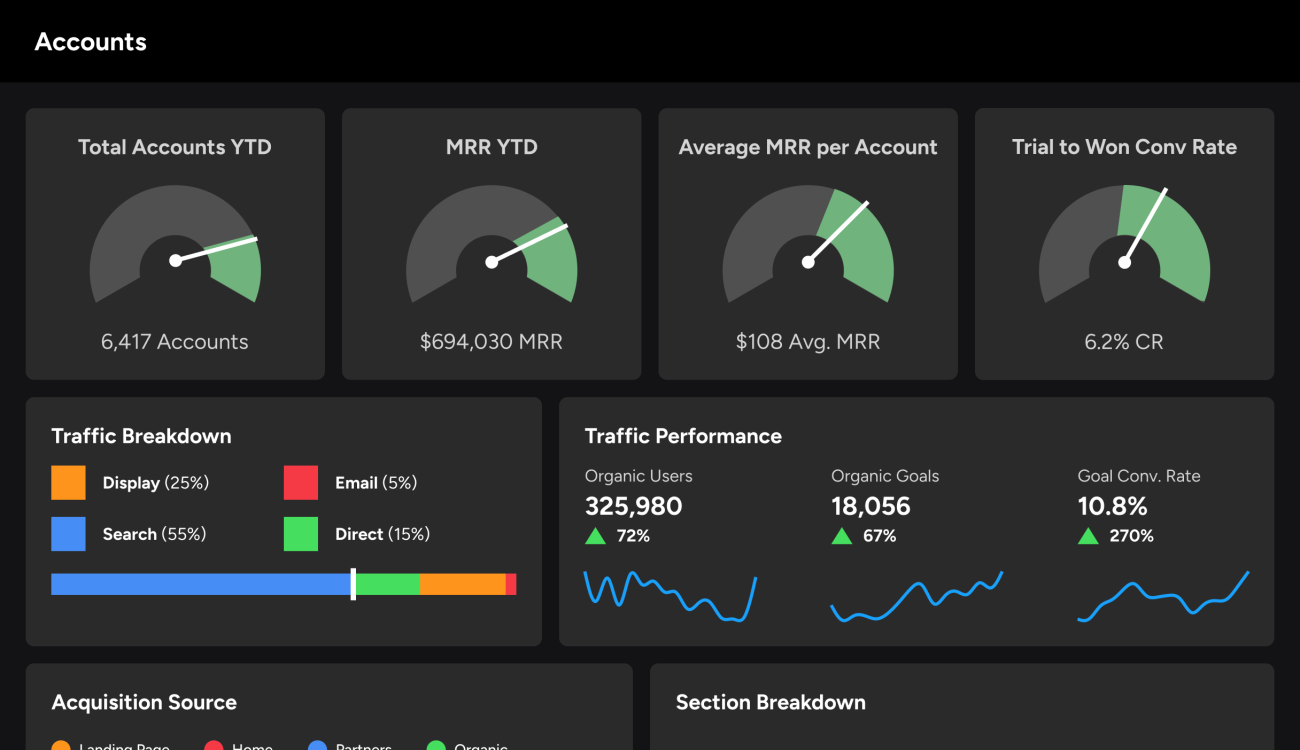
Unite your own SaaS data stack
Bring CRM, billing, product analytics, support, and your warehouse into one governed view so teams stop arguing and start acting.
- Tie pipeline to billing so ARR, MRR, and forecasts reflect reality.
- Blend usage and tickets to surface churn risk and expansion signals.
- Connect with built-in connectors, SQL, or APIs and set refresh schedules.
- Choose raw tables for power users or templates for fast starts.
Standardize the metrics investors expect
Use one playbook for SaaS metrics so updates match board and benchmark expectations.
- Build Klips for ARR, MRR, churn, NRR, gross margin, and payback.
- Cohort tables show retention, contraction, and expansion by signup month and plan.
- Track CAC and LTV with cost mappings and clear attribution assumptions.
- Add benchmark lines for Rule of 40 and NRR to see where you stand.
Role-based dashboards that drive action
Give each function a live view that answers daily questions without hunting through tabs.
- Exec: growth rate, runway, ARR, NRR, and cash burn on one screen.
- Finance: CAC, LTV, margin, revenue recognition views, and forecasts.
- Sales: pipeline, win rate, coverage, and rep activity with drill-ins.
- CS and Product: activation, DAU/WAU/MAU, PQLs, feature adoption, and NPS.
Customer story
Jobber
Real-Time Performance Visibility
Read the full story
How it works
- Connect your sources. Use built-in connectors, secure SQL, and APIs to pull CRM, billing, product, support, and warehouse data into Klips. Pick refresh intervals so dashboards stay current.
- Define the KPIs. Create shared formulas for ARR, MRR, churn, NRR, CAC, LTV, payback, and cohorts. Lock names and logic so every report matches the same playbook.
- Build and share. Assemble views for execs, finance, sales, CS, and product. Share by link, TV mode, mobile web, embeds, PDFs, or scheduled emails. Control access with users, groups, roles, and SSO.
“Klipfolio excels at presenting live data streams, enabling companies to track KPIs and metrics instantly. This immediacy helps leaders respond swiftly to changing conditions without delay.” Research.com, May 2025.
What you get: faster board decks, fewer spreadsheet rebuilds, and a trustworthy view of growth, retention, and runway. Dashboards look great out of the box and can be tuned with themes, layouts, and variables when you need more control.
Ready to see Klips in your stack? Sign up today.