
Dashboards for Hospitals & Health Clinics
From EHR to ER — Connected, Clear, and Current.
Run patient flow, quality, and revenue cycle dashboards from one place. Connect EHR, LIS, RIS/PACS, scheduling, and finance data. Give clinicians and administrators real-time views that reduce wait times, raise satisfaction, and strengthen funding.
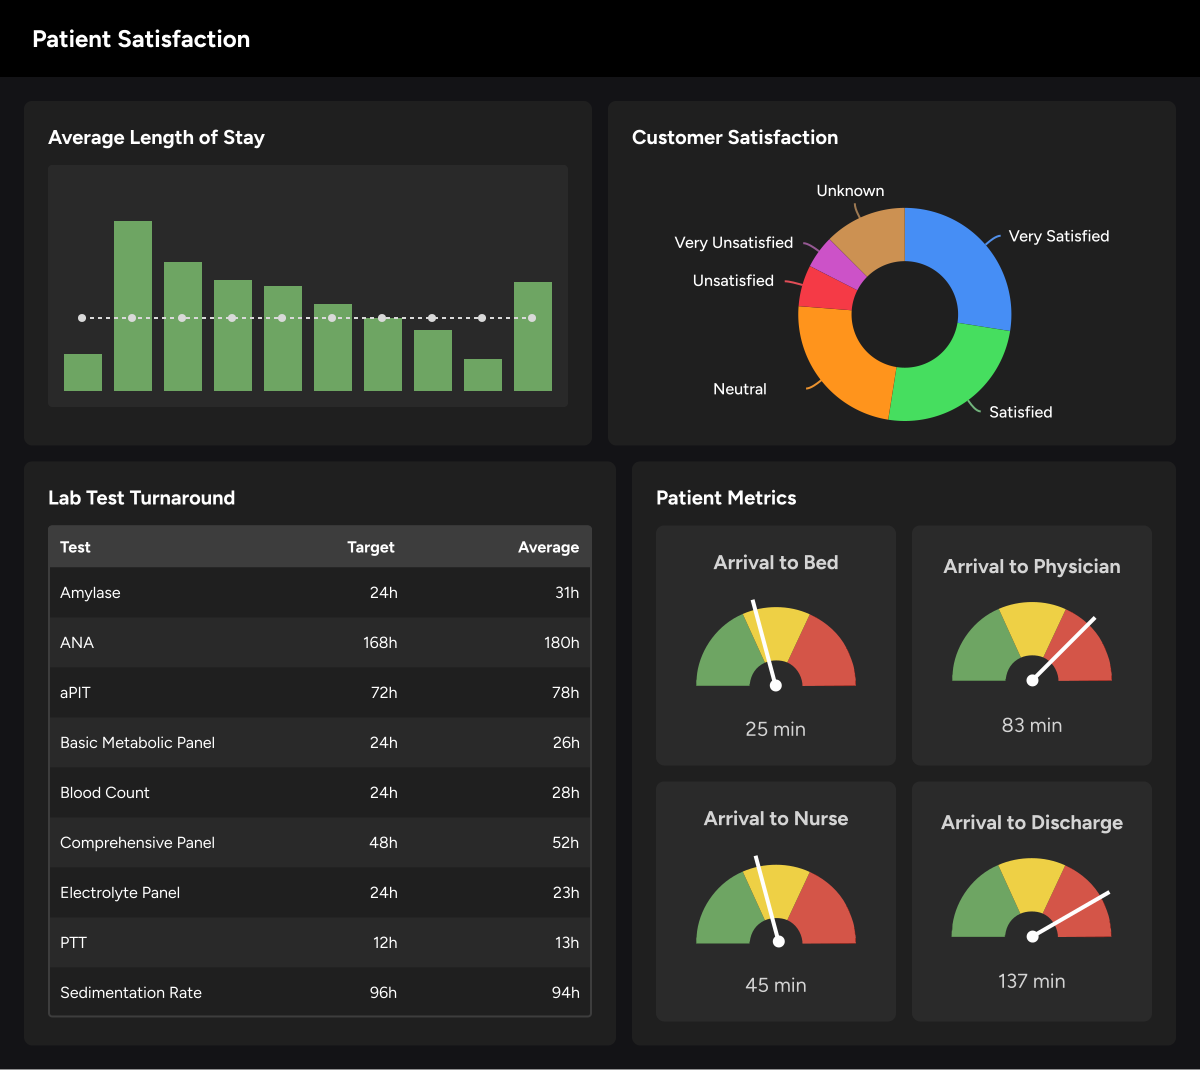
Connect clinical, operational, and financial data
Create a repeatable model that accepts feeds from clinical and admin systems, files, databases, and APIs, so every unit sees the same definitions.
- Connect the stack: EHR exports, LIS, RIS/PACS, scheduling, finance, SQL, files
- Clean once, reuse: Shared models and templates you can clone by site or unit
- Fresh by default: Automatic and scheduled refresh windows
- Consistent outputs: Census, patient flow, quality, and finance packs
Real-time patient flow and quality
Give frontline teams live visibility into capacity and care quality so they can reduce delays and address risks sooner.
- ED and beds: Triage to disposition times, wait times, bed occupancy
- Discharge readiness: Barriers, predicted discharges, unit handoffs
- Quality signals: Readmissions, infection control, medication errors
- Escalation cues: Threshold alerts and colour states for quick action
Revenue cycle and funding clarity
Link encounters, claims, and payments to see where revenue gets stuck, then tie improvements to funding outcomes.
- Claims and denials: Submission lag, denial rate, top denial codes
- Payer mix and AR: Days in AR, aging buckets, cash collections
- Cost and value: Cost per case alongside outcomes and LOS
- Grant support: KPIs that back applications and performance reports
Customer story
Lexington Podiatry
Patient Experience Optimization
Read the full story
Real-time visibility changes the daily rhythm on the floor. Charge nurses see beds opening and move patients faster. Clinicians spot delays and fix them before surveys capture the issue. Administrators track denials by payer and code, then clear the backlog with targeted worklists. Quality teams use one set of definitions for readmissions, infections, and med errors, which makes improvement efforts stick.
Klips fits small and mid-sized providers that need flexible dashboards without heavy IT. Connect almost any source, model calculations with familiar formulas, and present clean views on web, mobile, and wall displays. Control access by role and unit, and share by scheduled email, PDF, or secure links. You get a single place to monitor patient flow, quality, and revenue cycle, with the clarity to act now and the evidence to fund what works.