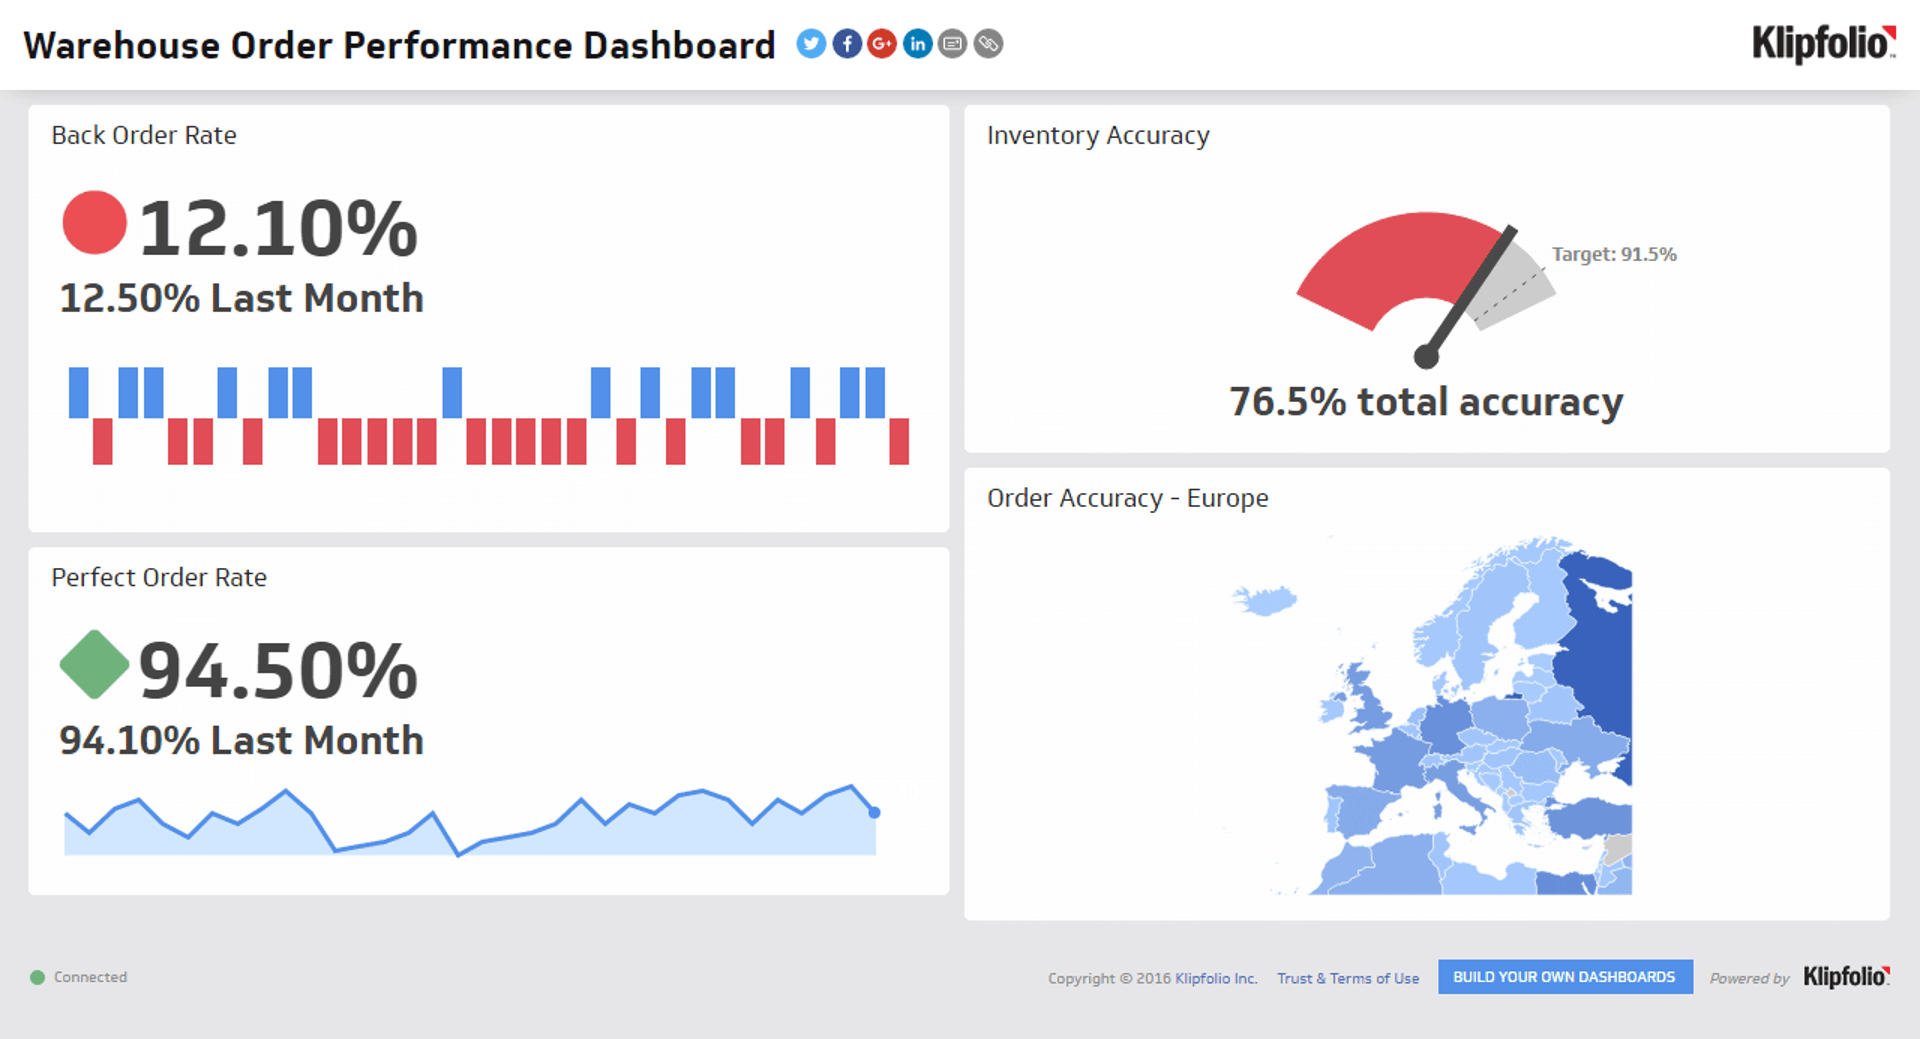
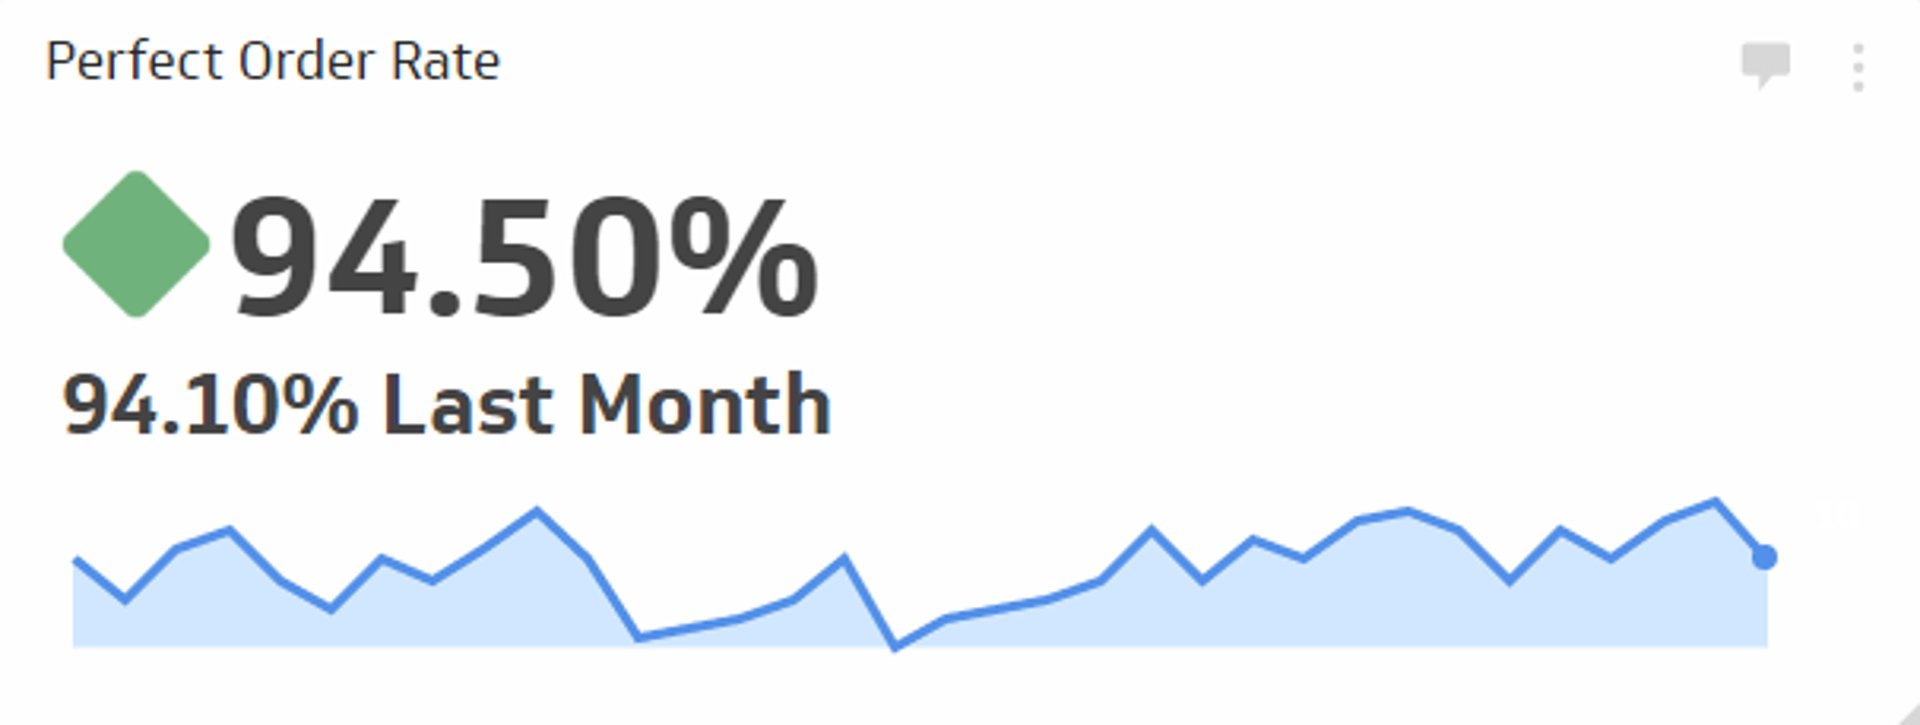
Perfect Order Rate
Measures the percentage of orders delivered on time, complete, undamaged, and with accurate documentation.
What is Perfect Order Rate?
Perfect Order Rate is the percentage of orders delivered on time, complete, undamaged, and with accurate documentation.
It measures how well your fulfillment process performs across every stage, from picking and packing to final delivery. A high Perfect Order Rate signals that your warehouse, logistics, and documentation teams are working together. A low rate reveals where incidents, such as damaged goods, incomplete shipments, or invoicing errors, are slipping through and costing you customers.
How to calculate Perfect Order Rate
Perfect Order Rate is calculated by multiplying the rates of each fulfillment component, then expressing the result as a percentage.
The standard formula combines four sub-metrics:
Perfect Order Rate = (On-Time Delivery Rate × Complete Order Rate × Damage-Free Rate × Accurate Documentation Rate) × 100
Each component is calculated separately:
- On-Time Delivery Rate: Orders delivered on time / Total orders
- Complete Order Rate: Orders shipped in full / Total orders
- Damage-Free Rate: (Total orders – Damaged orders) / Total orders
- Accurate Documentation Rate: (Total orders – Orders with documentation errors) / Total orders
Multiply all four rates together, then multiply by 100 to get your Perfect Order Rate as a percentage.
Example calculation
Suppose your team processes 1,000 orders in a month:
- 950 delivered on time -> 0.95
- 970 shipped in full -> 0.97
- 980 arrived undamaged -> 0.98
- 990 had accurate documentation -> 0.99
Perfect Order Rate = 0.95 × 0.97 × 0.98 × 0.99 × 100 = 89.3%
Even when each individual component looks strong, the combined rate shows the true picture. Four components at 95% to 99% each still produce a rate below 90%. That gap is why supply chain quality teams track Perfect Order Rate as a whole rather than relying on individual sub-metrics alone.
What is a good Perfect Order Rate?
Industry benchmarks vary by sector, but most supply chain leaders target a Perfect Order Rate of 90% or higher. Top-performing organizations often reach 95% to 98%.
A rate below 90% typically signals systemic issues in one or more fulfillment components. Even a rate in the low 90s may be worth investigating if your competitors are consistently hitting 96% or above.
Use your rate as a baseline, then track it over time to measure improvement rather than comparing it to a single industry number.
Why Perfect Order Rate matters
Perfect Order Rate is one of the most comprehensive logistics performance indicators available because it captures the entire order fulfillment cycle in a single number.
Here is why it matters:
- Customer retention: Orders that arrive late, incomplete, damaged, or with incorrect invoices erode trust. A high Perfect Order Rate correlates directly with repeat purchases and lower churn.
- Cost control: Each failed order generates costs, including returns processing, re-shipments, credit notes, and customer service time. Improving your rate reduces these hidden expenses.
- Operational visibility: Because the metric combines four sub-components, a drop in your overall rate immediately points you toward the specific area causing problems, whether that is carrier performance, warehouse accuracy, or documentation workflows.
- Supplier and partner accountability: Perfect Order Rate gives you a shared standard to evaluate third-party logistics providers, carriers, and warehouse partners.
What affects Perfect Order Rate?
Each of the four components can be influenced by different parts of your operation:
On-Time Delivery Rate
Carrier reliability, route planning, warehouse processing speed, and peak-season capacity all affect whether orders arrive on schedule. Delays at any point in the chain reduce this component.
Complete Order Rate
Stockouts, picking errors, and poor inventory visibility lead to partial shipments. Improving order picking and packing accuracy and maintaining real-time inventory data directly raises this component.
Damage-Free Rate
Packaging quality, handling procedures, and carrier practices determine how many orders arrive intact. Fragile or high-value products require additional protective measures.
Accurate Documentation Rate
Billing errors, incorrect shipping labels, and missing customs paperwork all count against this component. Automating documentation generation reduces human error and improves consistency.
How to improve Perfect Order Rate
Improving your Perfect Order Rate requires targeted action on whichever component is dragging your overall score down. Start by calculating each sub-metric separately to identify your weakest link.
Common improvement strategies:
- Audit carrier performance regularly. Track on-time delivery by carrier and route. Replace or renegotiate with underperforming partners.
- Invest in warehouse technology. Barcode scanning, pick-to-light systems, and warehouse management software reduce picking errors and improve complete order rates.
- Standardize packaging. Develop packaging guidelines based on product type and shipping distance to reduce damage rates.
- Automate documentation. Use order management systems that generate invoices, packing slips, and shipping labels automatically to reduce manual errors.
- Set component-level targets. Rather than only tracking the combined rate, assign ownership and targets for each sub-metric to the relevant team.
Create custom dashboards for you and your team.
Get started with KlipsPerfect Order Rate vs. related metrics
Perfect Order Rate is a composite metric. Its sub-components are also tracked independently in many supply chain operations:
- On-Time Delivery Rate focuses specifically on timing and is often used to evaluate carrier contracts.
- Complete Order Rate measures fulfillment completeness and is closely tied to inventory management.
- Damage-Free Rate reflects packaging and handling quality.
- Accurate Documentation Rate captures billing and paperwork accuracy.
Tracking these individually alongside the combined Perfect Order Rate gives you both a high-level view and the diagnostic detail needed to act quickly when performance drops.