Forecasted Contact Load to Actual Contact Load
Compare the number of contacts your team predicted against the contacts actually received to measure forecasting accuracy and support smarter staffing decisions.
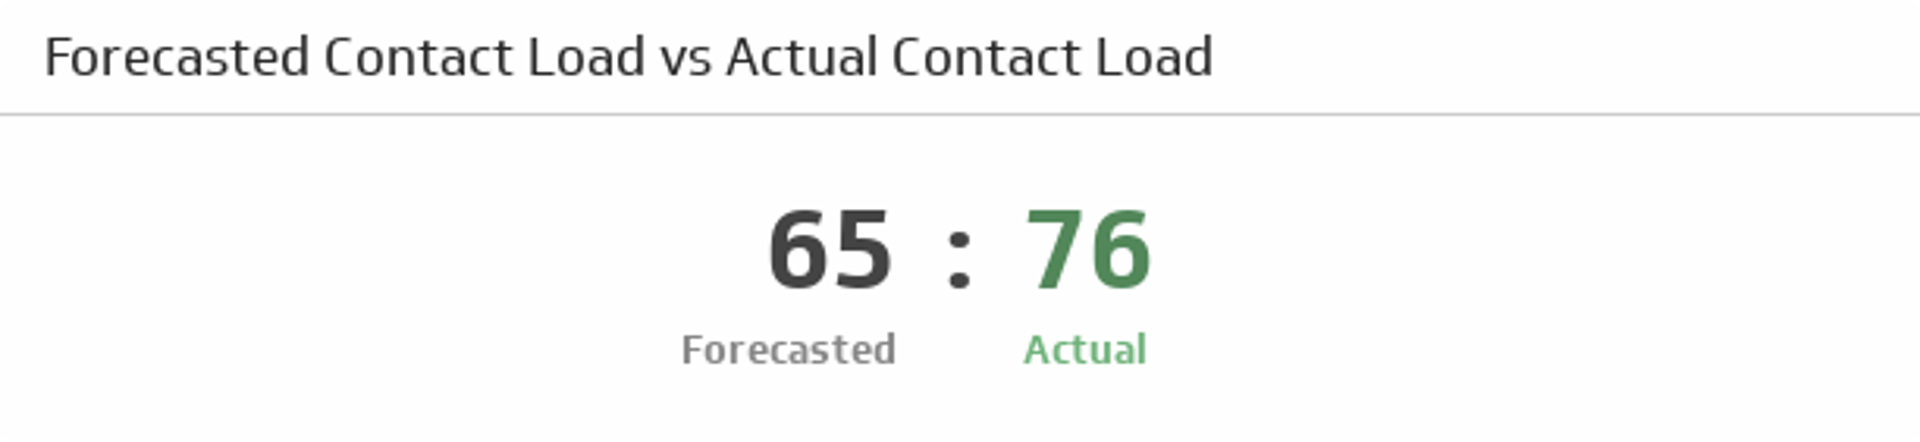
Forecasted Contact Load to Actual Contact Load compares the number of contacts your team predicted against the contacts actually received during a reporting period. This metric shows how accurately your team forecasts demand, and whether your staffing decisions are grounded in reality.
When forecasts align with reality, you staff appropriately, manage workload, and meet service levels. When they diverge, you've identified a gap worth investigating before it costs you.
Why this metric matters
Accurate contact forecasting is the foundation of effective call centre planning. Overestimate contact volume and you'll overstaff, wasting labour costs. Underestimate and you'll face long wait times, agent burnout, and missed revenue.
Beyond those operational costs, poor forecasting means your team is constantly reacting rather than planning. You're waiting for a number to go wrong, then scrambling to explain it, rather than knowing in advance what's coming and acting accordingly.
Tracking this metric helps you:
- Refine staffing models by understanding forecast accuracy over time, not just in the moment.
- Identify seasonal trends that affect contact volume patterns before they catch you off guard.
- Improve resource allocation based on actual demand versus predictions, so headcount decisions are grounded in evidence.
- Reduce operational waste by aligning team capacity with real contact load, not assumptions.
How to calculate it
The formula compares your forecasted contact numbers against actual contacts received within the same period:
Actual Contact Load = Total contacts at end of period - Total contacts at start of period

Forecasting Accuracy (%) = (Actual Contact Load / Forecasted Contact Load) × 100
Example:
- Forecasted contact load for January: 5,000 contacts.
- Actual contacts received in January: 4,750 contacts.
- Forecasting accuracy: (4,750 / 5,000) × 100 = 95%.
An accuracy rate of 90–110% is generally considered healthy. Rates outside this range suggest systemic forecasting issues worth investigating.
Reporting frequency
Monthly is standard for most centres. High-volume operations often track weekly or daily to catch forecast drift early, before it affects staffing decisions.
Typical KPI targets
- Target range: 90–110% accuracy, allowing for natural variation.
- Example: If you forecast 75 contacts, hitting 68–83 actual contacts is acceptable. Below 68 or above 83 signals a forecasting problem.
Who should track this
- Call centre managers overseeing staffing and capacity planning.
- Workforce management teams responsible for scheduling and resource forecasting.
- Operations leaders monitoring overall centre efficiency and cost control.
If you're accountable for service levels or headcount decisions, this number belongs in your regular review.
Variations and related metrics
- Forecasted vs. Actual Call Volume — Measures call count instead of contact count.
- Forecasting Accuracy by Channel — Breaks down accuracy by inbound, outbound, email, or chat.
- Forecast Bias — Identifies whether your team consistently over- or underestimates, rather than fluctuating randomly.
- Average Handle Time — Affects how many contacts an agent can handle per shift, which feeds directly into forecast inputs.
- Call Volume — The raw contact load your centre receives.
- Service Level — Depends on accurate contact forecasting to set realistic answer-time targets.
How to improve forecasting accuracy
- Use historical data — Analyse 12–24 months of contact patterns to identify seasonal peaks and troughs before they arrive.
- Account for external factors — Marketing campaigns, product launches, or industry events can spike contact volume in ways historical data won't predict.
- Segment by channel — Inbound, outbound, email, and chat often follow different patterns. Forecast each separately rather than lumping them together.
- Review and adjust weekly — Compare actual-to-forecast early in the month and adjust staffing before the gap compounds.
- Involve agents — Front-line staff often spot emerging trends, such as a new product issue driving repeat contacts, before the data shows it.
- Use forecasting software — Tools with machine learning detect patterns faster than manual spreadsheets and reduce the risk of human bias skewing your numbers.
The goal isn't a perfect forecast every time. It's a reliable one, so your team can plan with confidence rather than scramble after the fact.
Create custom dashboards for you and your team.
Get started with KlipsTrack this in Klips
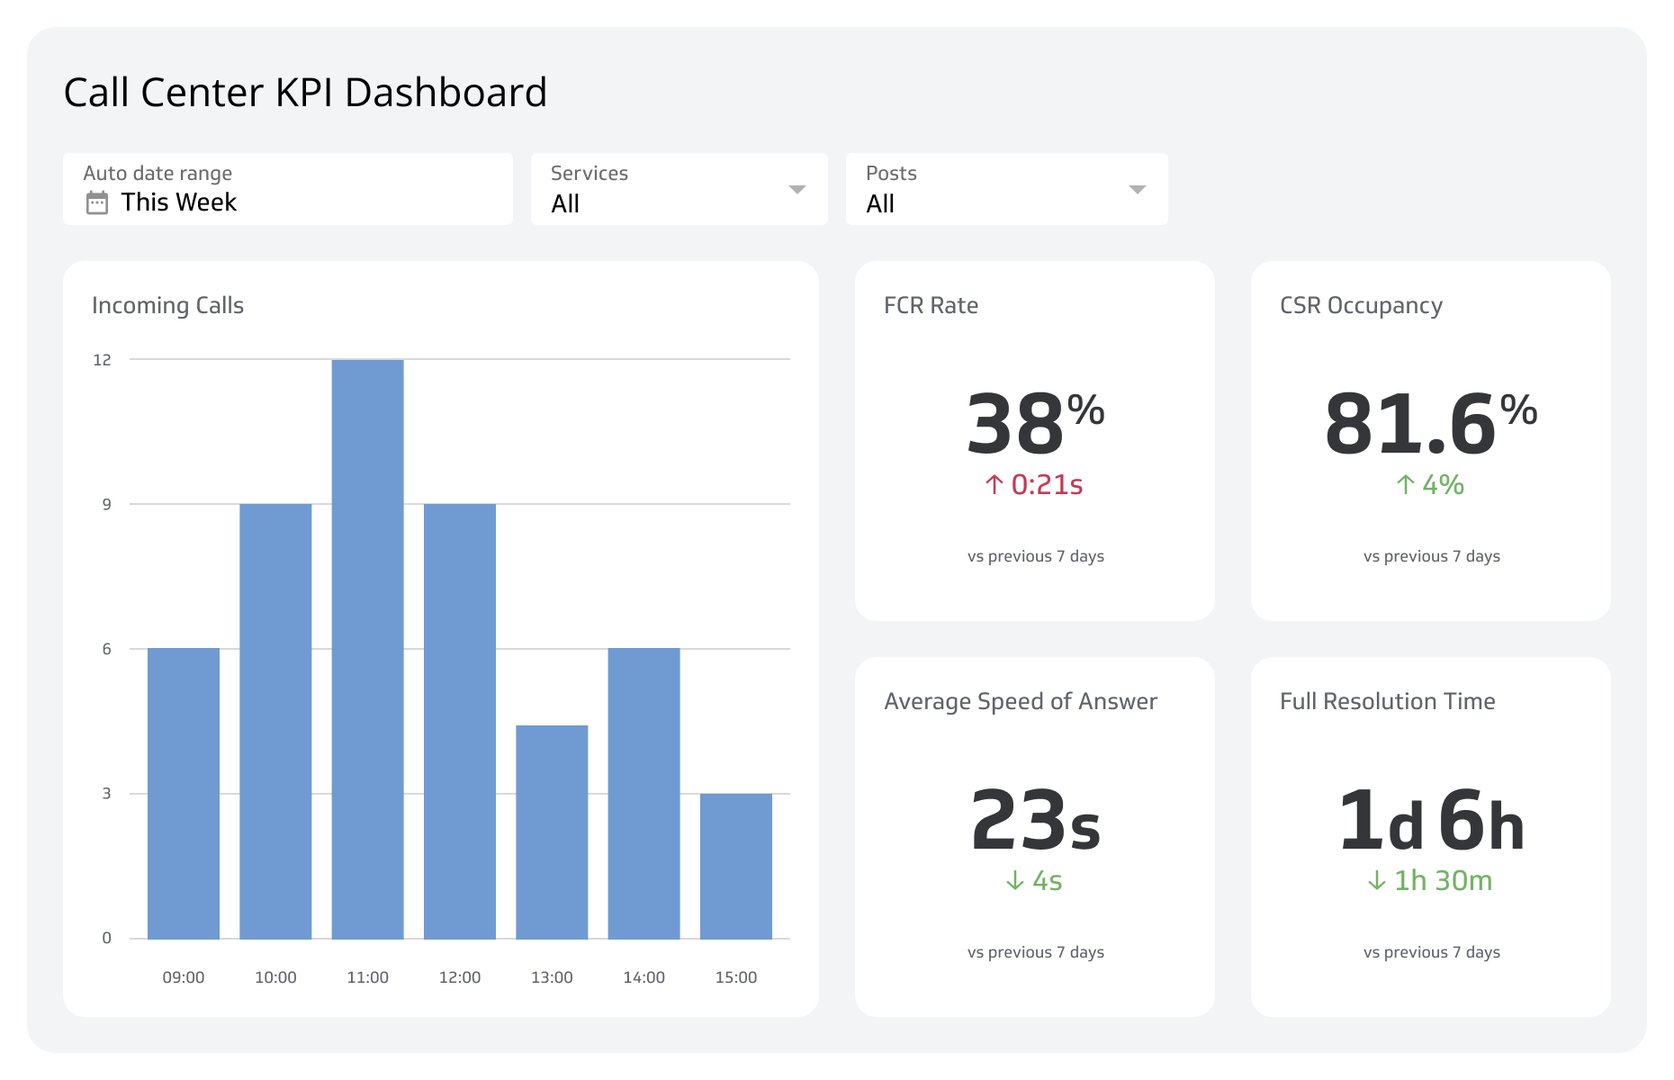
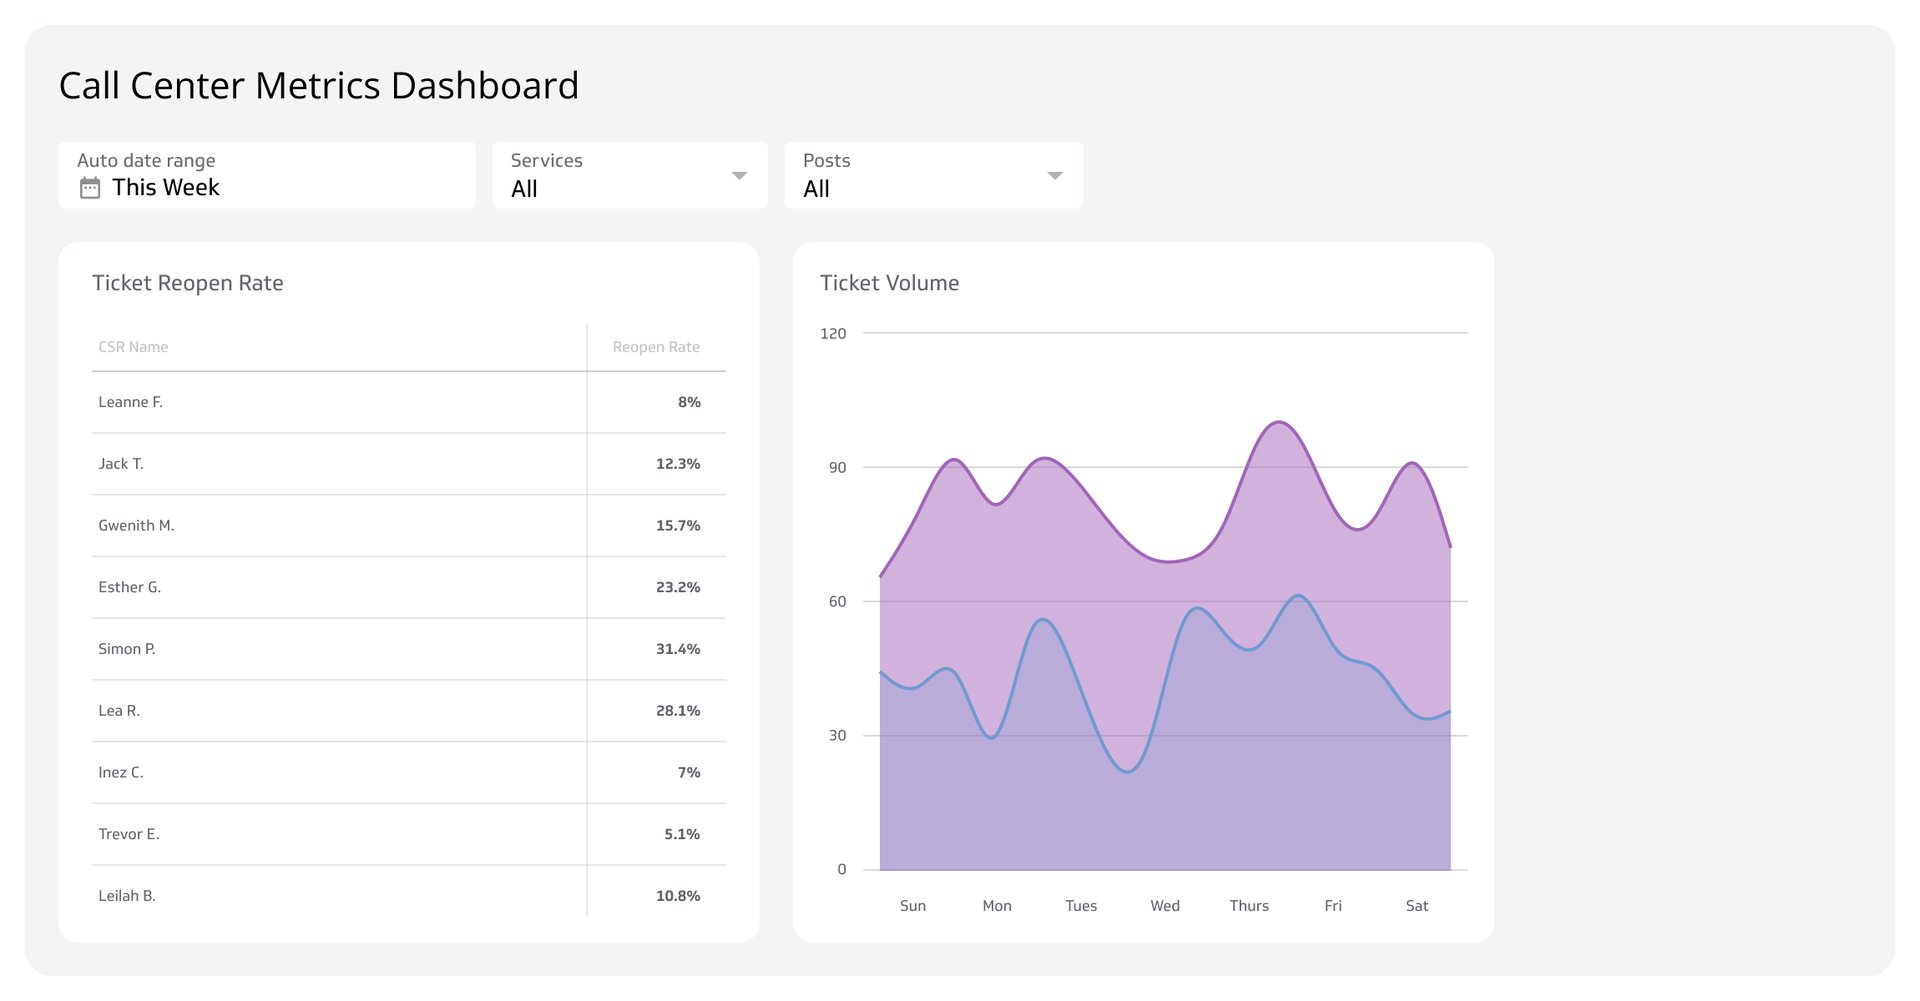
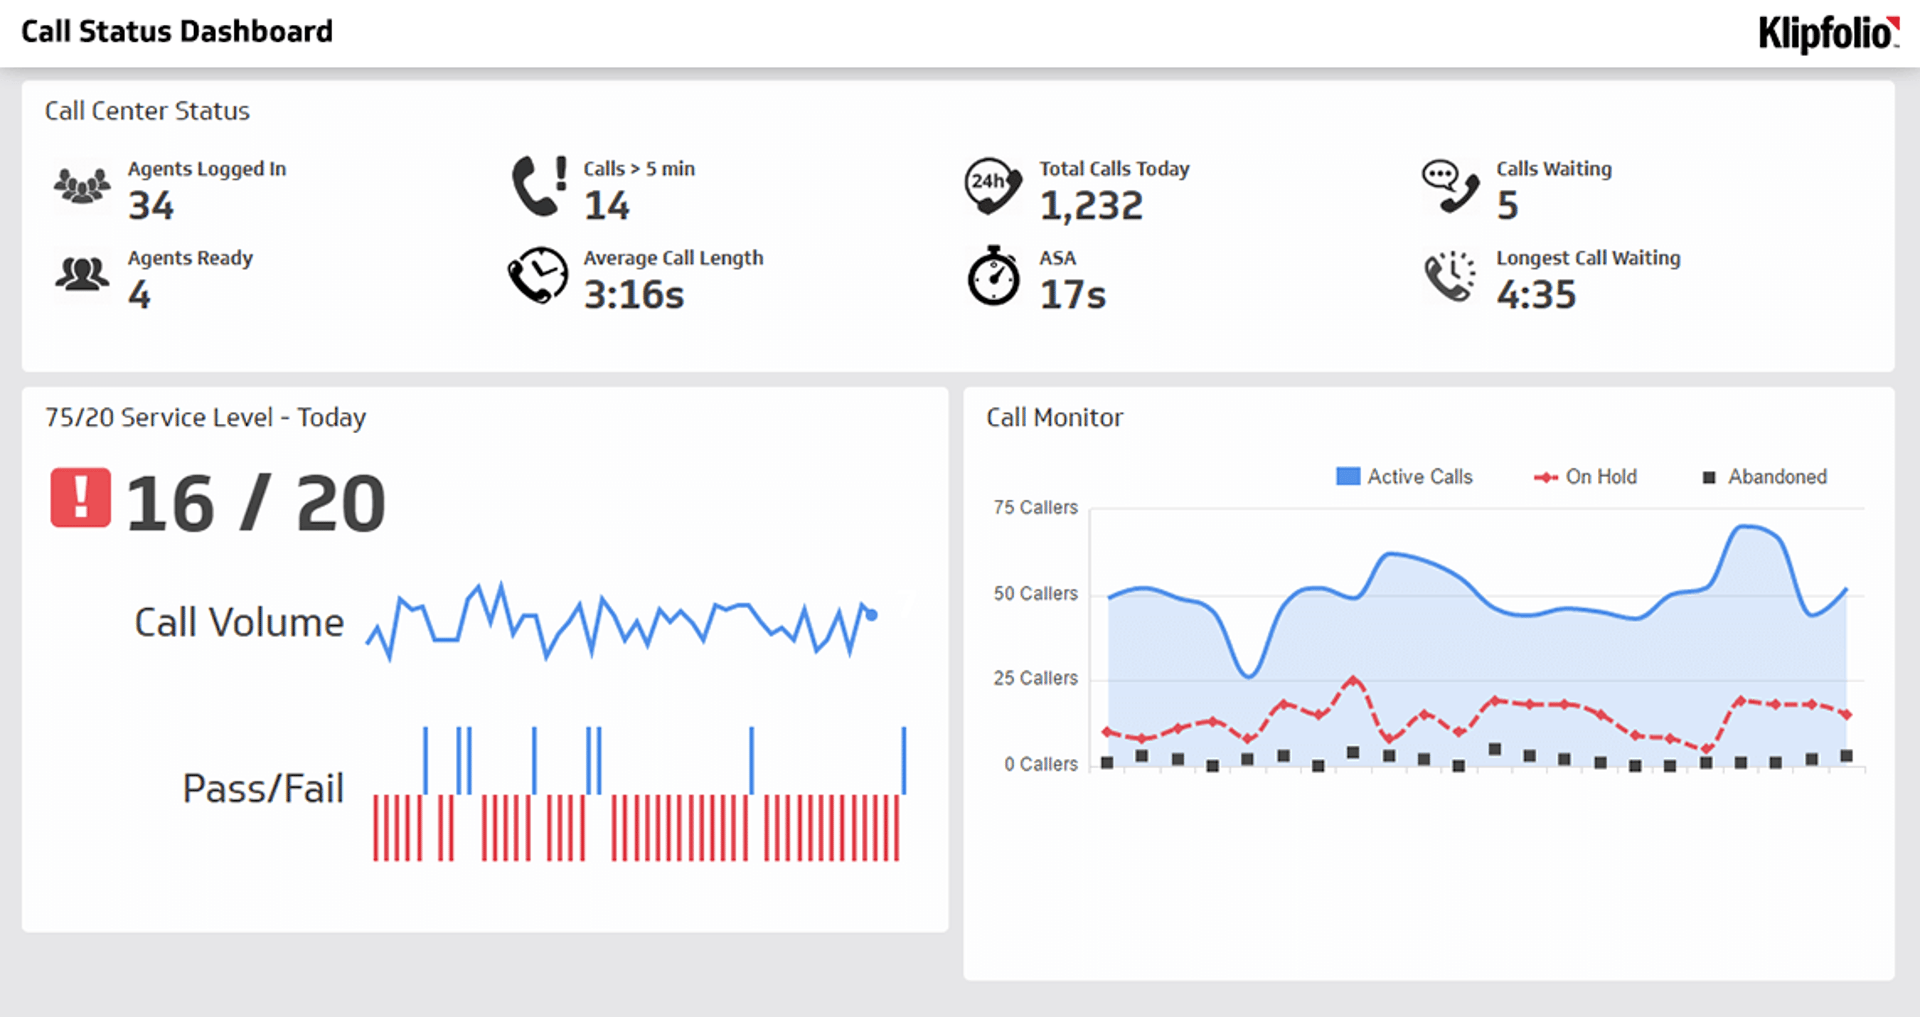
Klips dashboards let you visualize forecasted versus actual contact load in real time, so you're not waiting until month-end to discover a gap. Set up automated alerts when actual contacts drift beyond your target range, and share real-time dashboards with your team so everyone stays aligned on capacity.
Use 100+ connectors to pull contact data directly from your call centre platform. No manual updates, no copy-pasting numbers into a spreadsheet, and no explaining your data structure from scratch every time you need an answer.