QuickBooks
Connect QuickBooks Online to Klipfolio and turn your accounting data into live, shareable dashboards. Track Profit and Loss, Cash Flow, Accounts Receivable, and more — updated automatically, no manual exports required.
Tracking your finances shouldn't mean exporting spreadsheets and piecing together reports by hand. Connect QuickBooks Online to Klipfolio and get a live dashboard that keeps your whole team aligned on the numbers that matter.
How to connect QuickBooks to Klipfolio
This integration uses OAuth, so no API key is required. Complexity: Moderate.
- In the left navigation sidebar, click the 3-dot menu beside Data Sources and select +New data source.
- On the Where is your data? page, select QuickBooks.
- Choose a pre-built data source or click Create a custom QuickBooks data source.
- Click Connect an account, enter your QuickBooks credentials, and click Allow Access to authorize Klipfolio.
- Enter your QuickBooks Company ID when prompted. (Find it under Billing and Subscription in your QuickBooks Account and Settings.)
- Click Get data, confirm the results look right, and click Continue.
- Name your data source, set a refresh schedule (every 4, 12, or 24 hours), and click Save.
View the step-by-step setup guide
Top reasons to use Klipfolio for QuickBooks dashboards
Connect QuickBooks to Klipfolio and you get more than a chart — you get a single source of financial truth your team can act on.
See your finances in real time. Dashboards refresh automatically on a schedule you set, so your Profit and Loss, Cash Flow, and Accounts Receivable data are always current — no manual exports required.
Combine QuickBooks with your other tools. Blend financial data with metrics from Salesforce, Google Sheets, HubSpot, and 100+ other sources to build dashboards that show the full picture.
Share with anyone, your way. Distribute dashboards via secure links, scheduled PDF emails, embedded views, or TV mode — so stakeholders get the right data without needing a Klipfolio login.
Start fast with pre-built templates. Use pre-built QuickBooks data sources and Klip templates to get a working dashboard in minutes, then customize from there.
Go deeper with custom queries. When pre-built data sources don't cover what you need, write your own queries against the QuickBooks API and pull exactly the data you want.
What Klipfolio adds to QuickBooks
| What you do in QuickBooks | What Klipfolio adds |
|---|---|
| Export reports manually as CSV or PDF | Automated dashboards that refresh on a set schedule |
| View one company's data at a time | Combine multiple QuickBooks companies or blend with other data sources |
| Share static reports by email | Distribute live dashboards via links, embeds, or scheduled emails |
| Review built-in QuickBooks charts | Build custom visualizations with 30+ chart types and your own branding |
Stop piecing together financial reports by hand. Start building QuickBooks dashboards that update themselves.
View the step-by-step setup guide
Before you build, get familiar with the metrics worth tracking. The QuickBooks metrics guide covers the top finance KPIs, best practices for building finance dashboards, and how to get the most from your QuickBooks data in Klipfolio.
Use pre-built QuickBooks metrics
Assemble a QuickBooks dashboard by selecting pre-built metrics from the Klip Gallery.
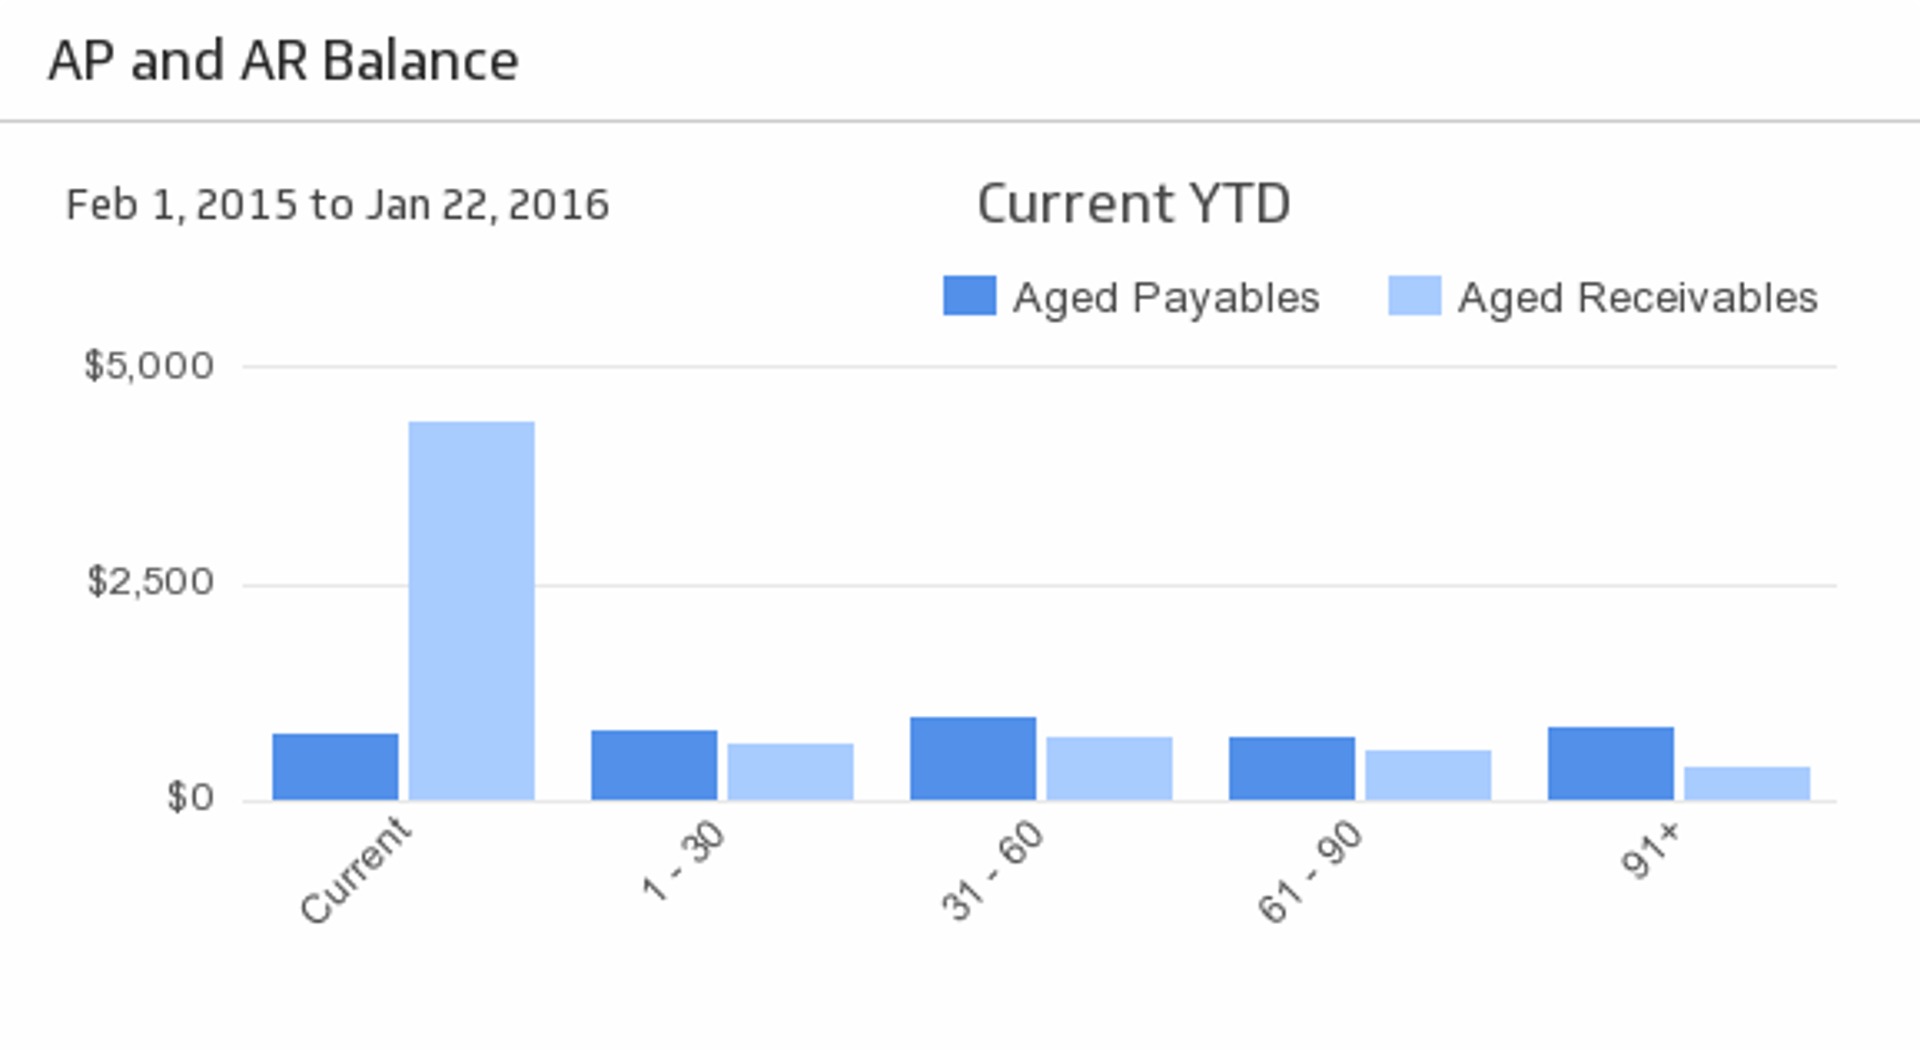
AP and AR Balance
See your Accounts Payable and Accounts Receivable at-a-glance during the time period of your choice.
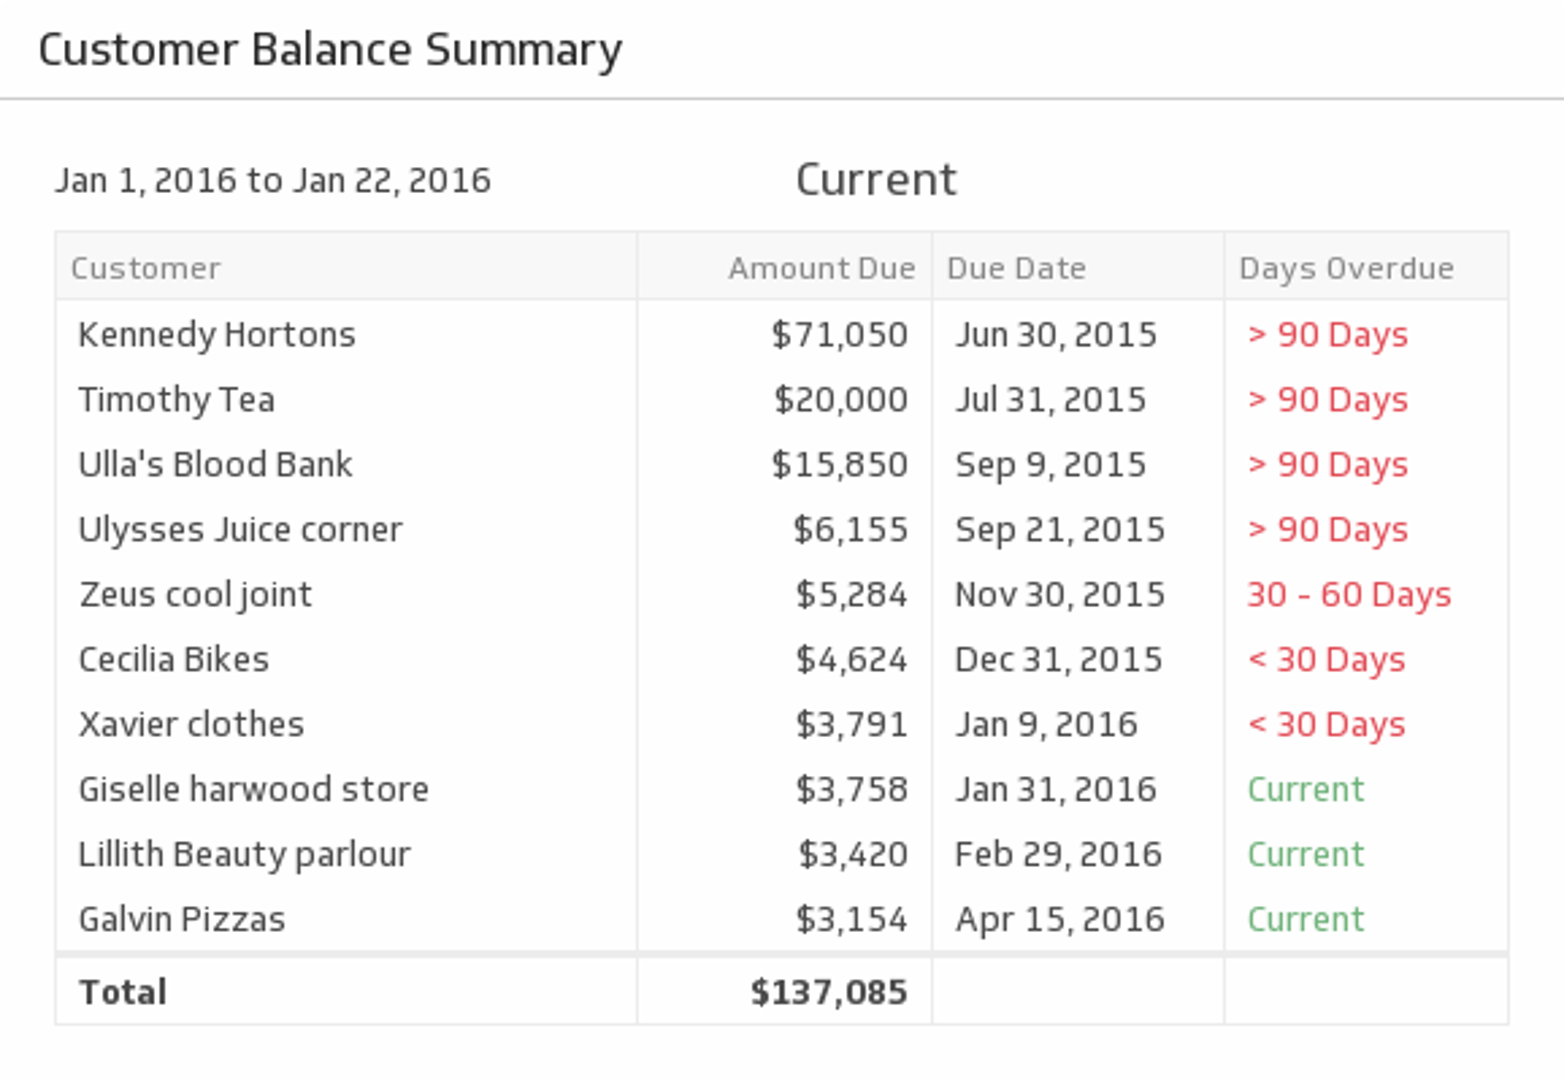
UsesCustomer Balance Summary
Cash-flow can make or break a venture. See which customers are current and which ones owe you money during the time period of your choice.
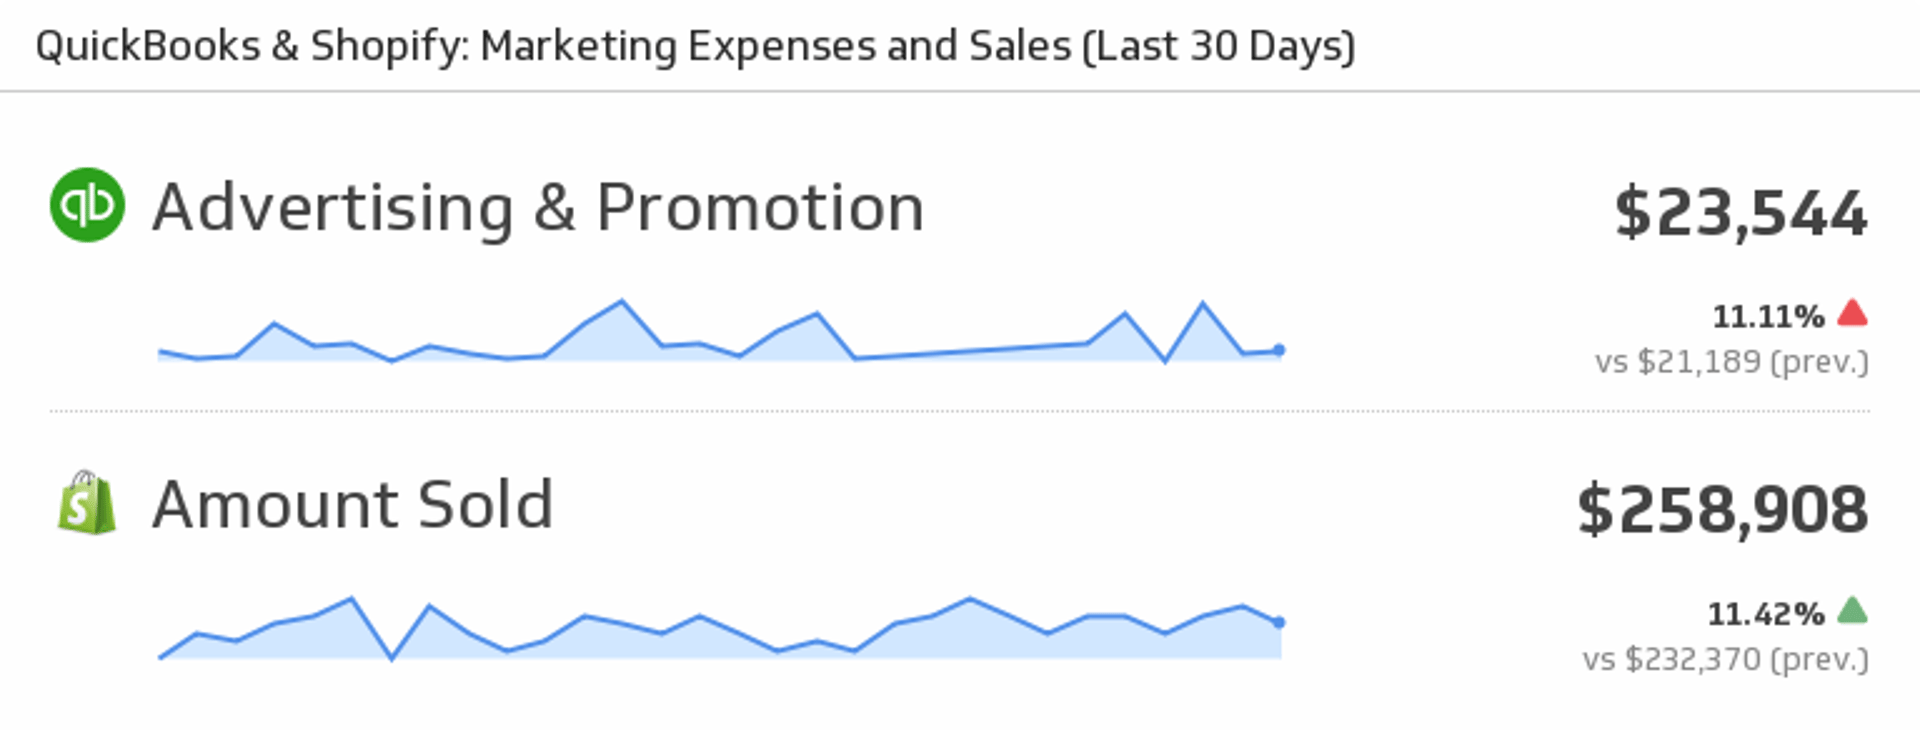
UsesMarketing Expenses and Sales
Mash up your QuickBooks and Shopify data to see your Marketing Expenses and Sales for the last 30 days.
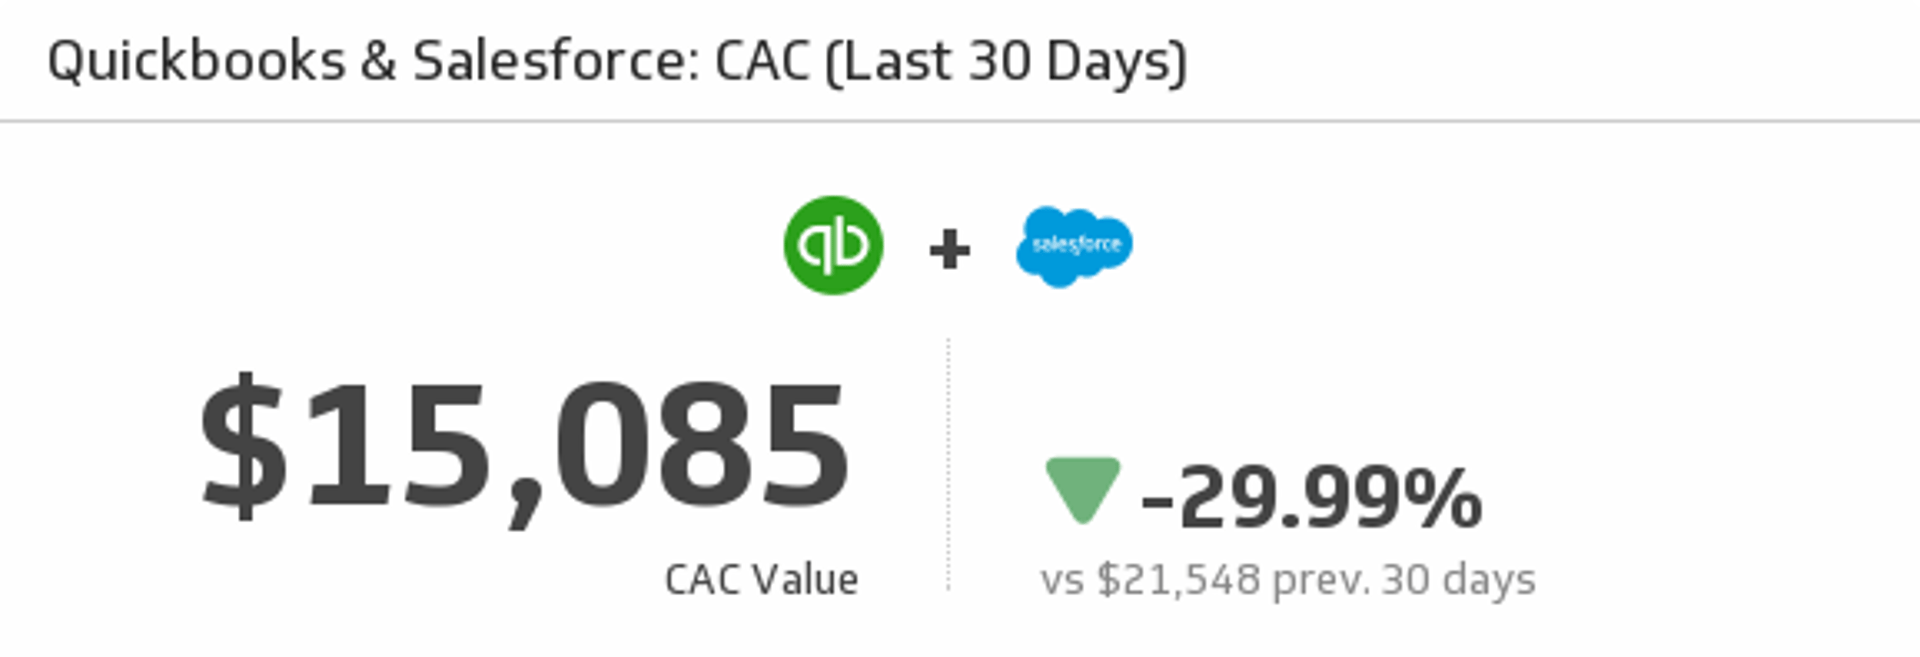
UsesQuickBooks and Salesforce CAC (Last 30 Days)
Mash up your QuickBooks and Salesforce data to measure your Customer Acquisition Cost over the last 30 days.
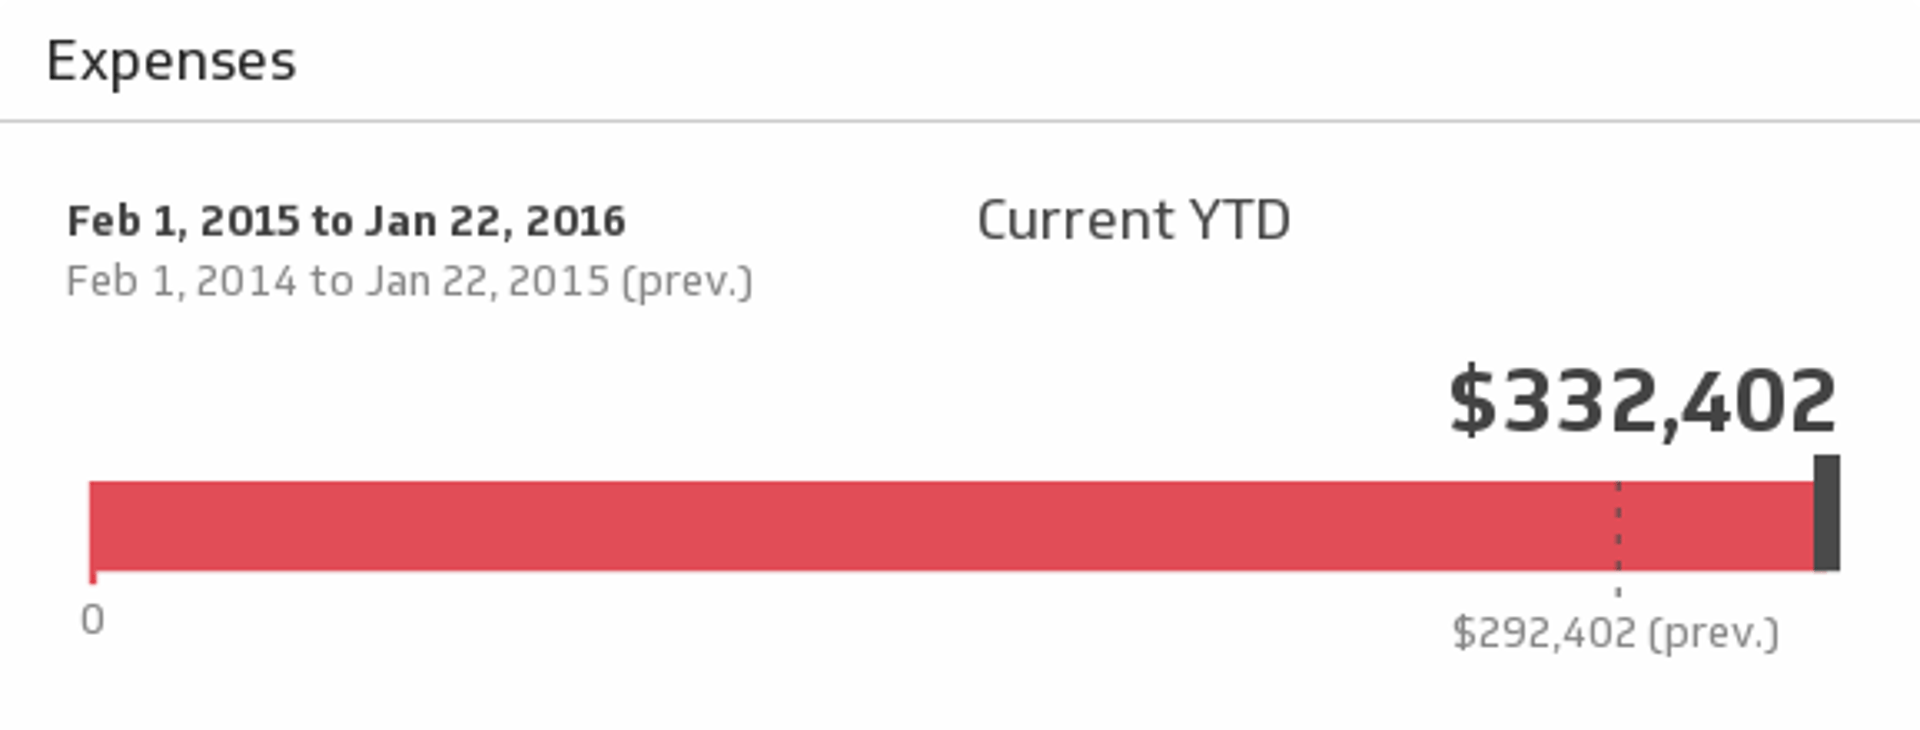
UsesQuickBooks Expenses
You have to spend money to make money! Monitor your expenses for the time period of your choice and compare it to the previous period.
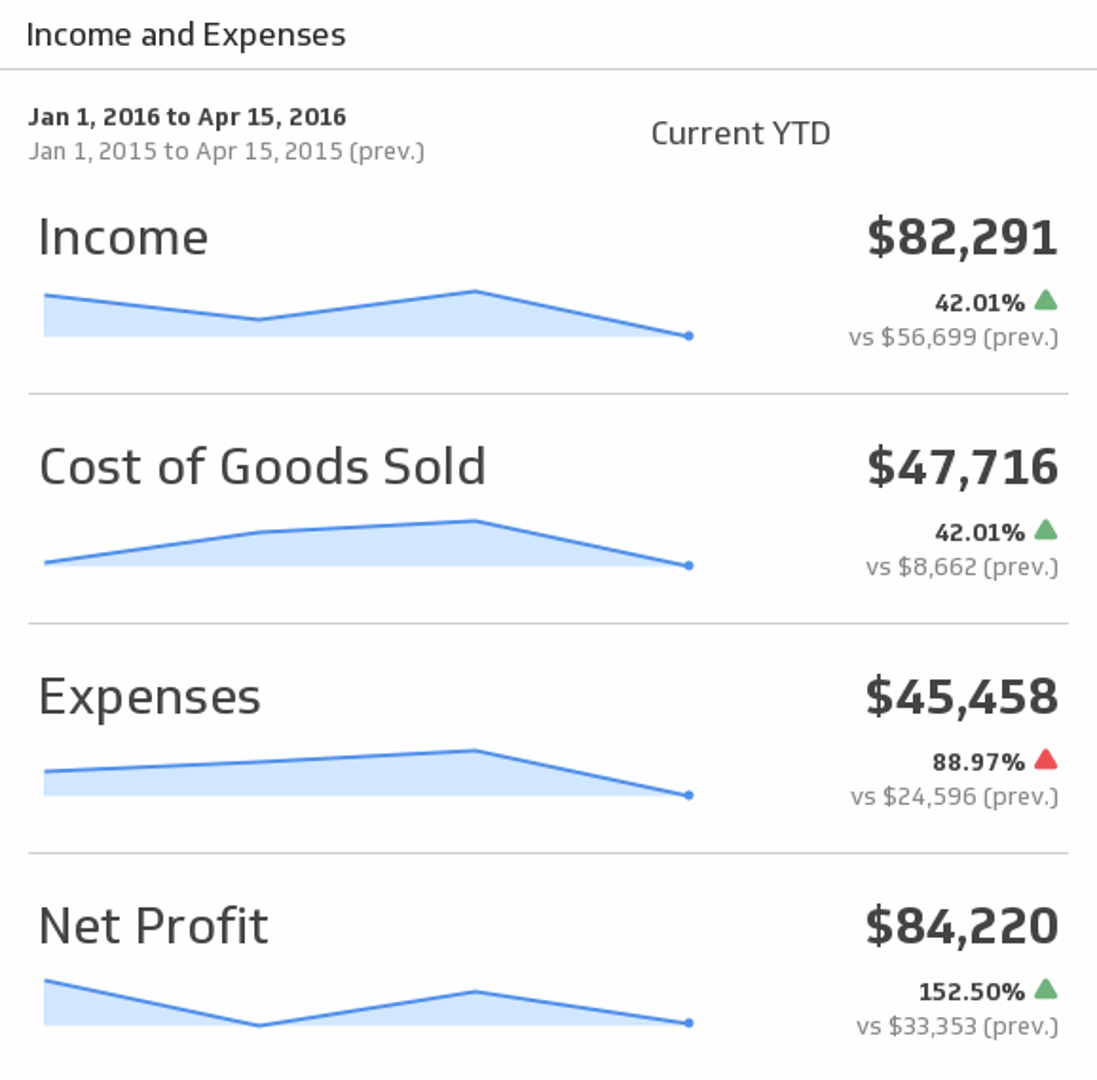
UsesQuickBooks Income and Expenses
Bring your key accounting puzzle pieces - Income, Expenses, and Profit - together to help you make actionable decisions. Choose the time period of your choice from the drop-down menu, and compare to the previous period.
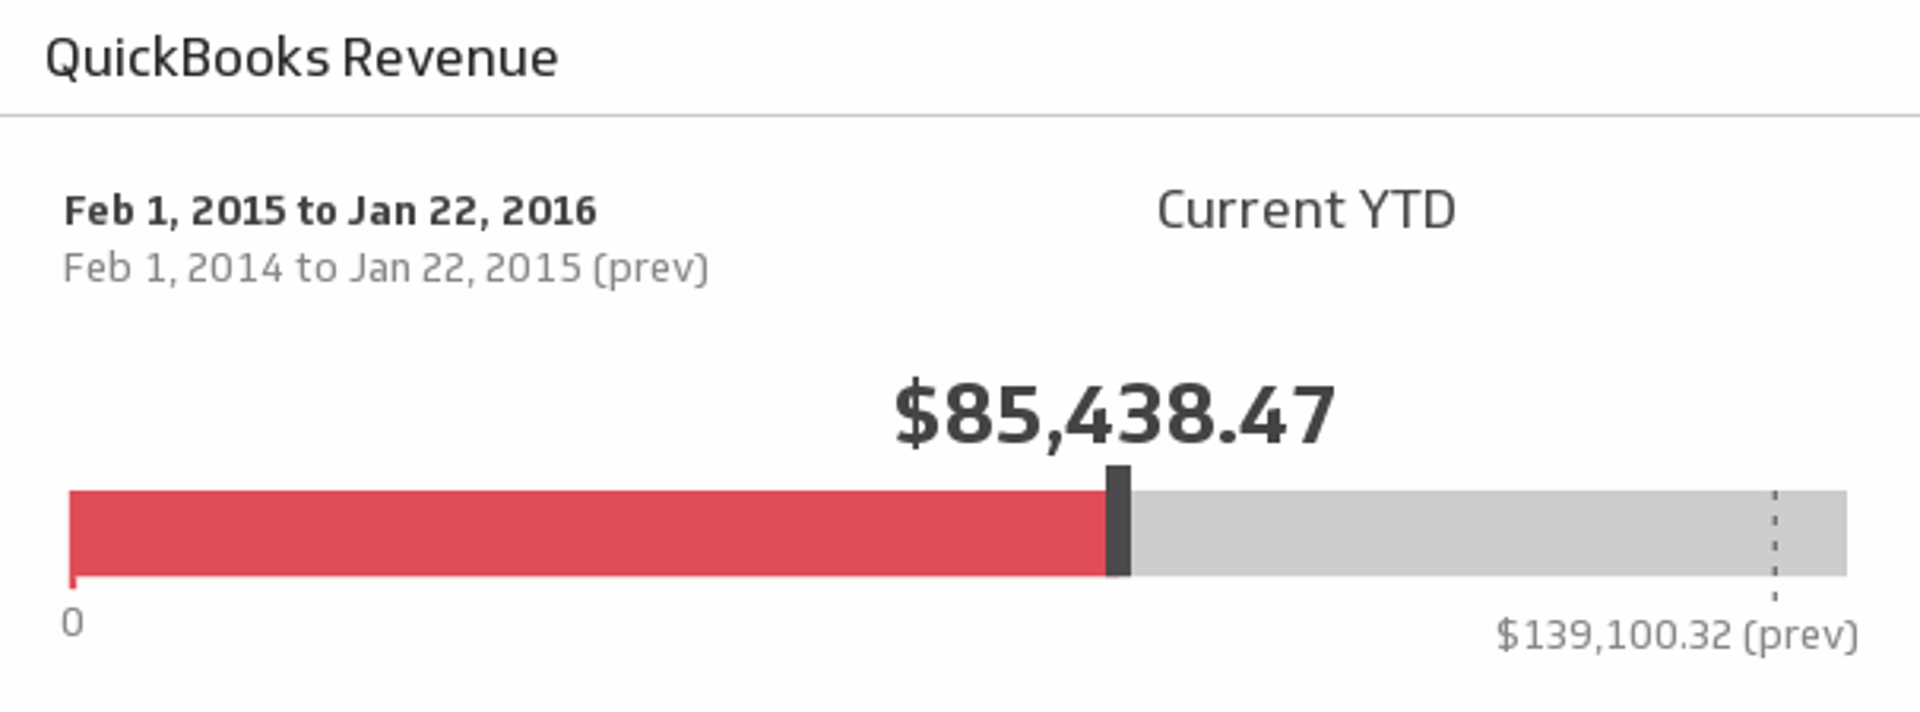
UsesQuickBooks Revenue
Ensure the financial health of your business is in tip-top shape with this simple, real-time report on revenue for the time period of your choice.
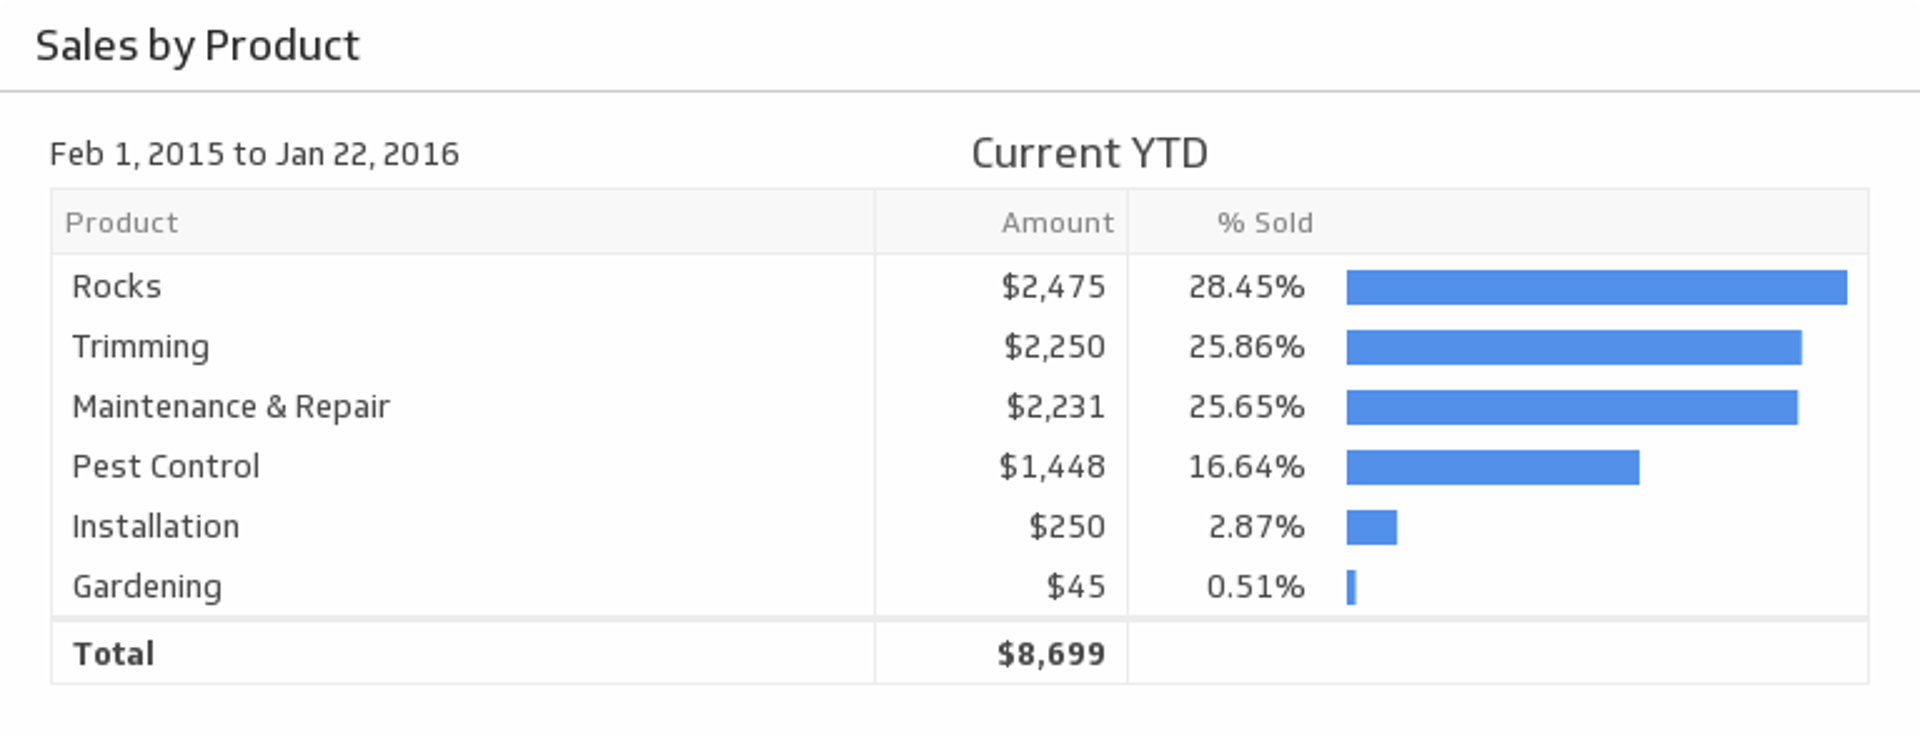
UsesSales by Product
Make sure your products are profitable by monitoring each of their sales metrics during the time period of your choice.
UsesTop 10 Customers by Income
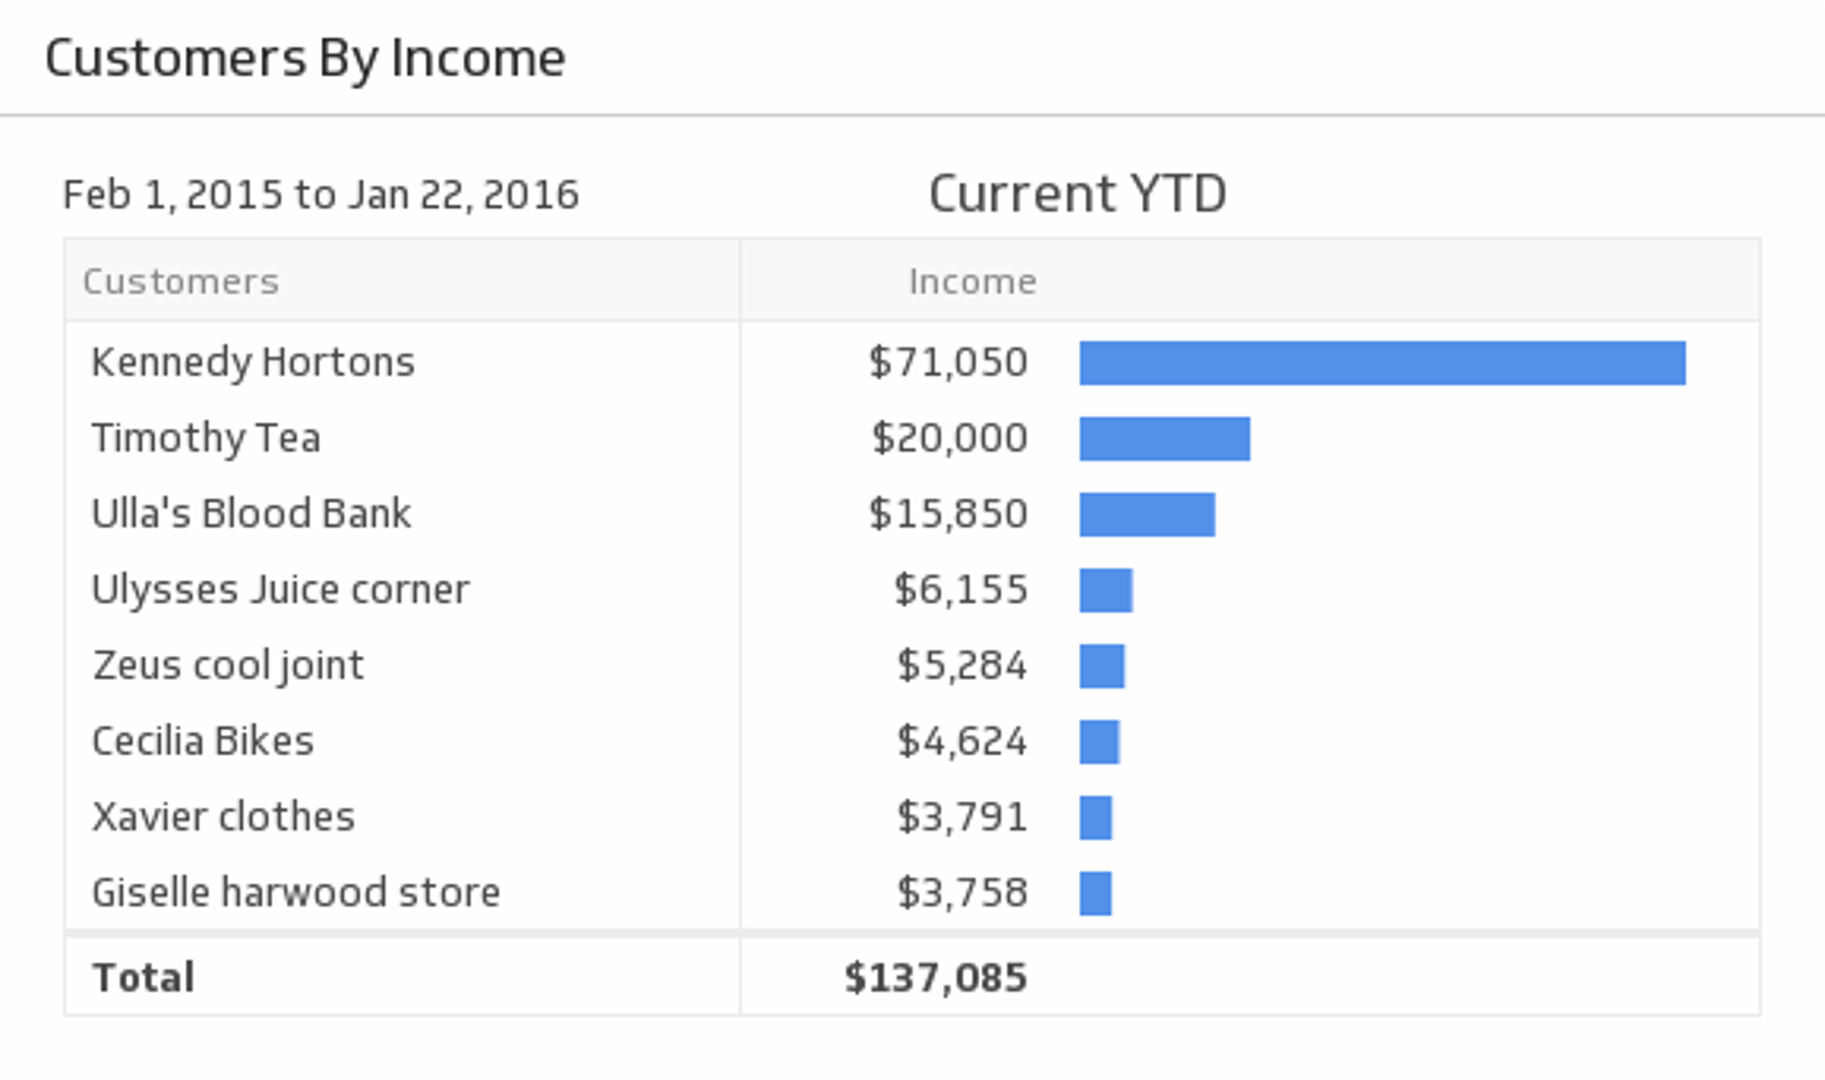
Gain a steady flow of profitable clients by monitoring your top 10 income-earning customers during the time period of your choice.
UsesVendor Expenses
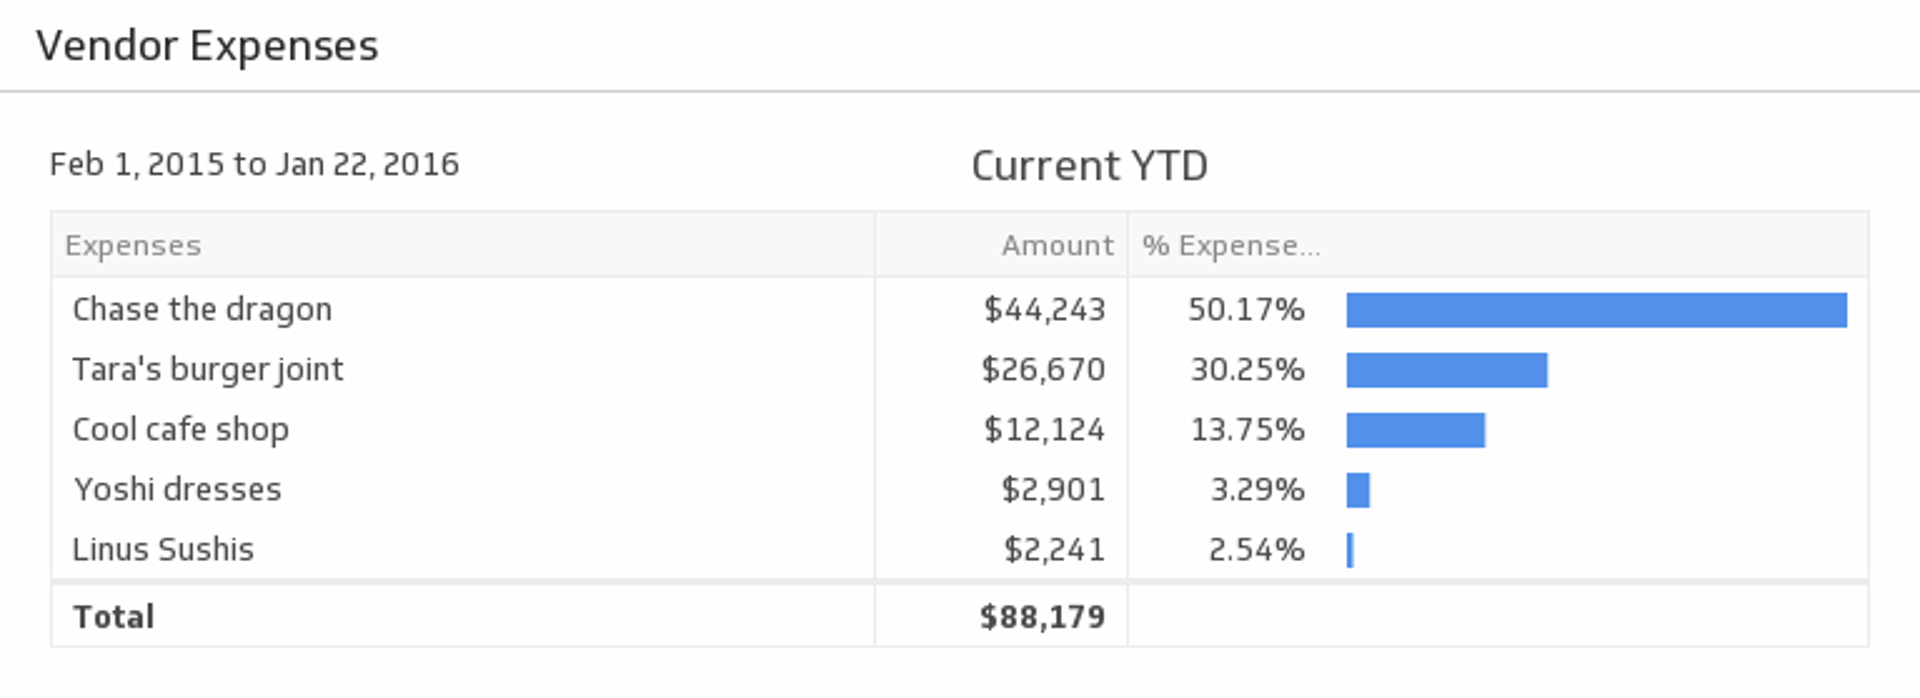
Monitor your vendor expenses on an ongoing basis. Delve into individual vendor expenses and see the total for the time period of your choice.
Uses