Pingdom
Connect Pingdom to Klipfolio Klips and display your website uptime, response times, and error data in a live dashboard. Use pre-built Klips or build a custom Pingdom dashboard from scratch.
Tracking down website issues after the fact wastes time your team doesn't have. Connect Pingdom to Klipfolio Klips and get uptime, response times, and error data in a live dashboard your whole team can see.
How to connect Pingdom to Klipfolio
Connecting Pingdom uses Basic HTTP Authentication (your Pingdom username and password). Follow the steps below to get your dashboard running.
- Log in to Klipfolio and navigate to the Service Connectors page.
- Select Pingdom from the connector list.
- Choose a pre-built data source or select Create a custom Pingdom data source to build your own.
- Enter your Pingdom Username and Password, then click Continue.
- Review the returned data, optionally enable Model your data, then click Continue.
- Name your data source, set a refresh schedule, and click Save.
View the step-by-step setup guide
Top reasons to use Klipfolio for Pingdom dashboards
Klipfolio goes beyond what you can see inside Pingdom's native interface.
Live uptime visibility across your entire stack. Pull uptime, response time, and error data into a single dashboard that refreshes automatically — no manual exports required.
Combine Pingdom with other data sources. Merge website performance data with metrics from Google Analytics 4, HubSpot, or any other connected service to see the full picture in one place.
Share monitoring data your way. Distribute dashboards via TV mode, public links, scheduled PDF emails, or embedded views — so the right people always have access.
Custom alerts and thresholds. Build Klips that highlight anomalies visually, so performance issues stand out before they become outages.
Pre-built Klips to get started fast. Browse ready-made Pingdom visualizations in the Klip Gallery and connect your data in minutes.
What Klipfolio adds to your Pingdom workflow
| What you do in Pingdom | What Klipfolio adds |
|---|---|
| Check uptime status manually in the Pingdom interface | Automated dashboard that updates on a schedule you set |
| Export performance reports as CSV | Live visualizations with no file handling required |
| Monitor one service at a time | Unified view combining Pingdom with all your other data sources |
| Share screenshots or static reports | Shareable dashboards via link, embed, TV mode, or scheduled email |
Stop piecing together performance reports manually. Start monitoring your websites and infrastructure in real time with a Pingdom dashboard built in Klipfolio.
Use pre-built Pingdom metrics
Assemble a Pingdom dashboard by selecting pre-built metrics from the Klip Gallery.
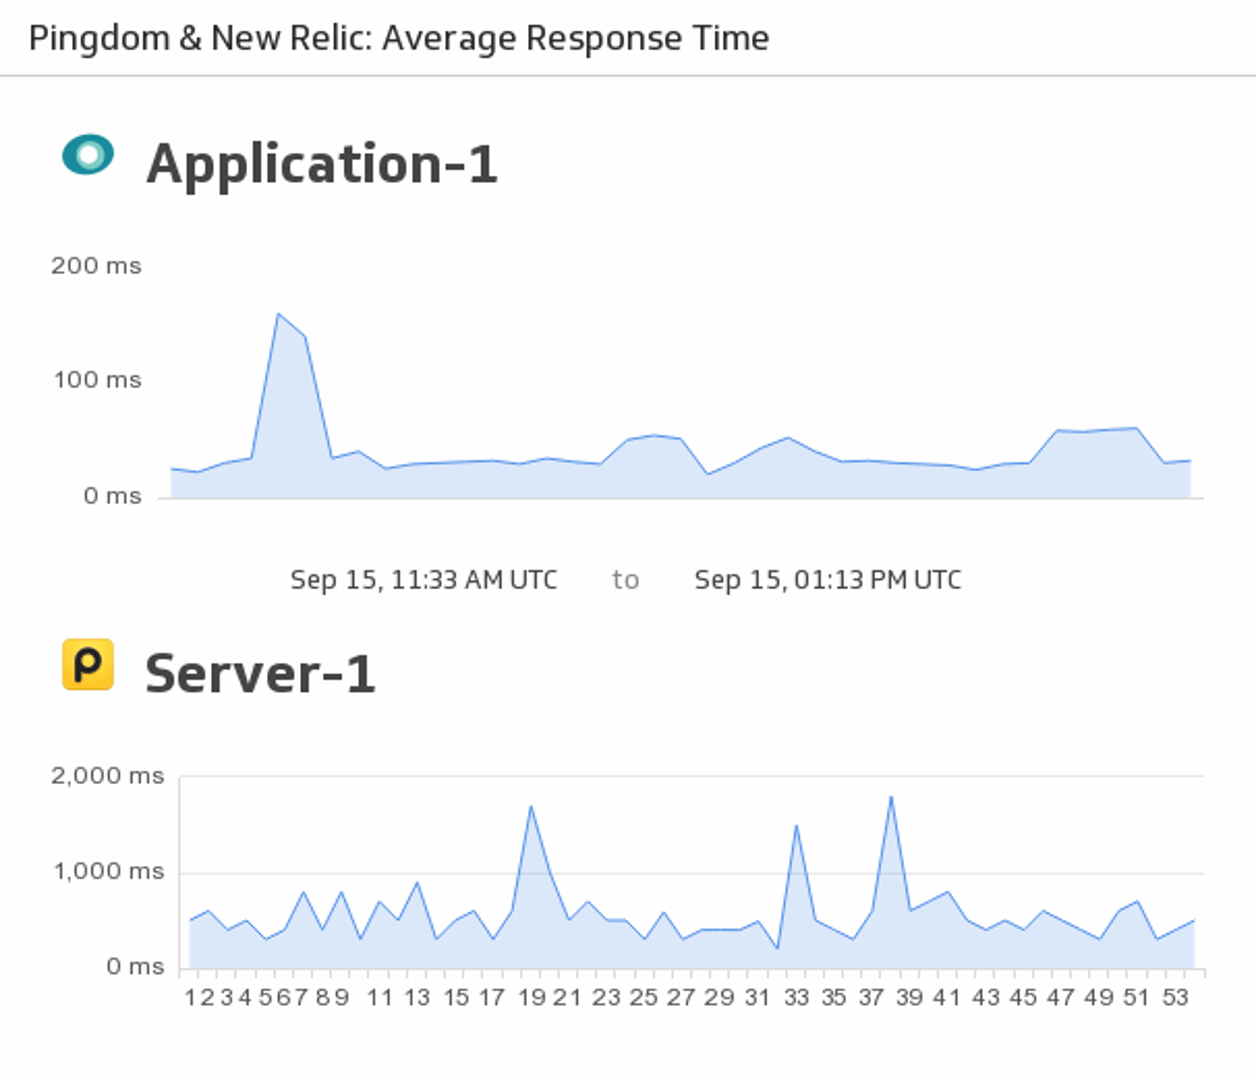
Average Response Time
Make sure to stay on top of your server and application response time by merging your New Relic and Pingdom data to monitor responsiveness in real-time.
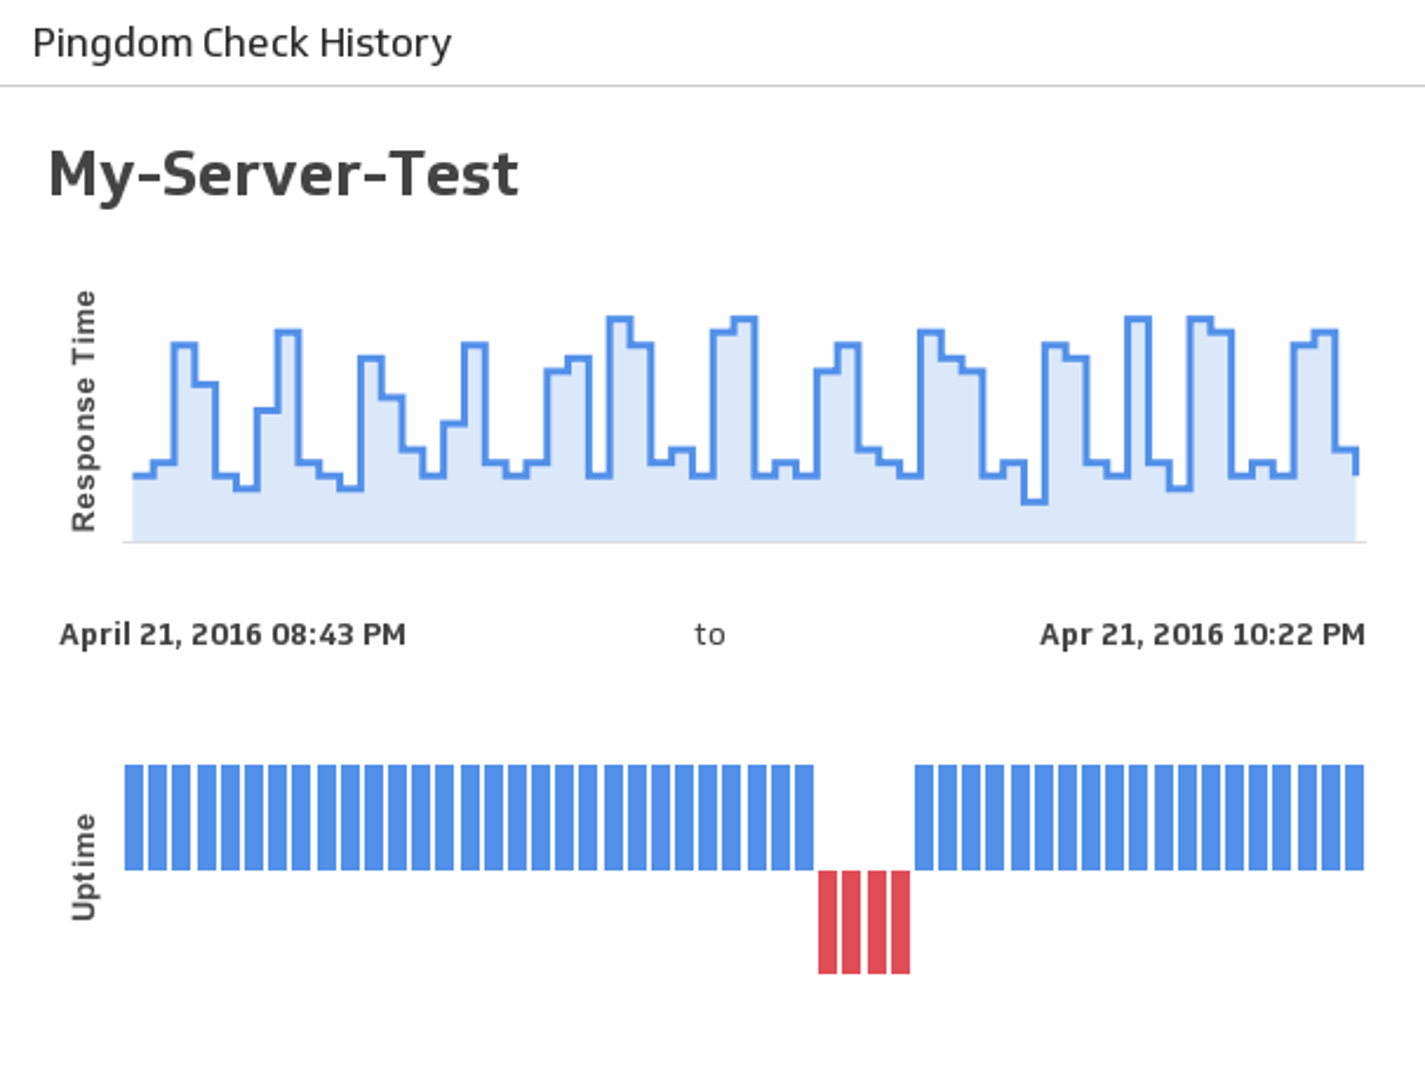
UsesCheck History
See historical uptime and response times for a server of your choice.
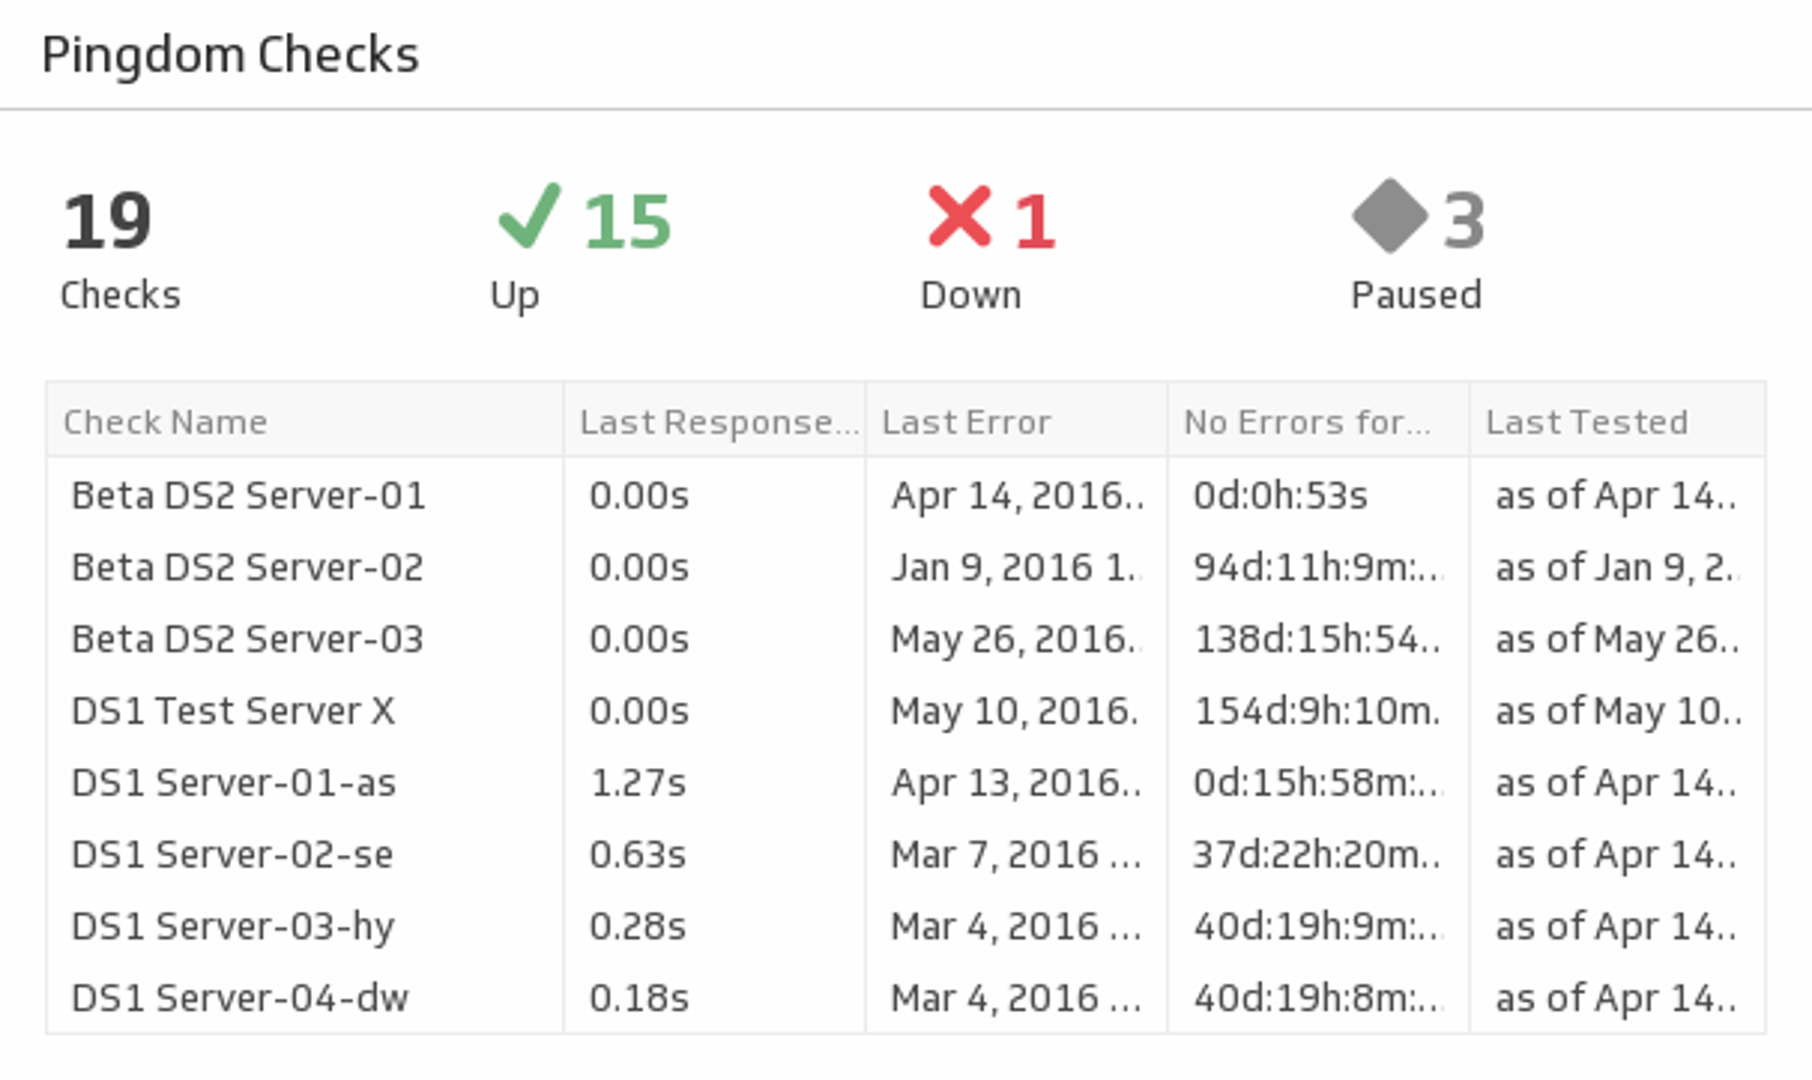
UsesChecks Summary
See stats for your services including statuses, response times and error times.
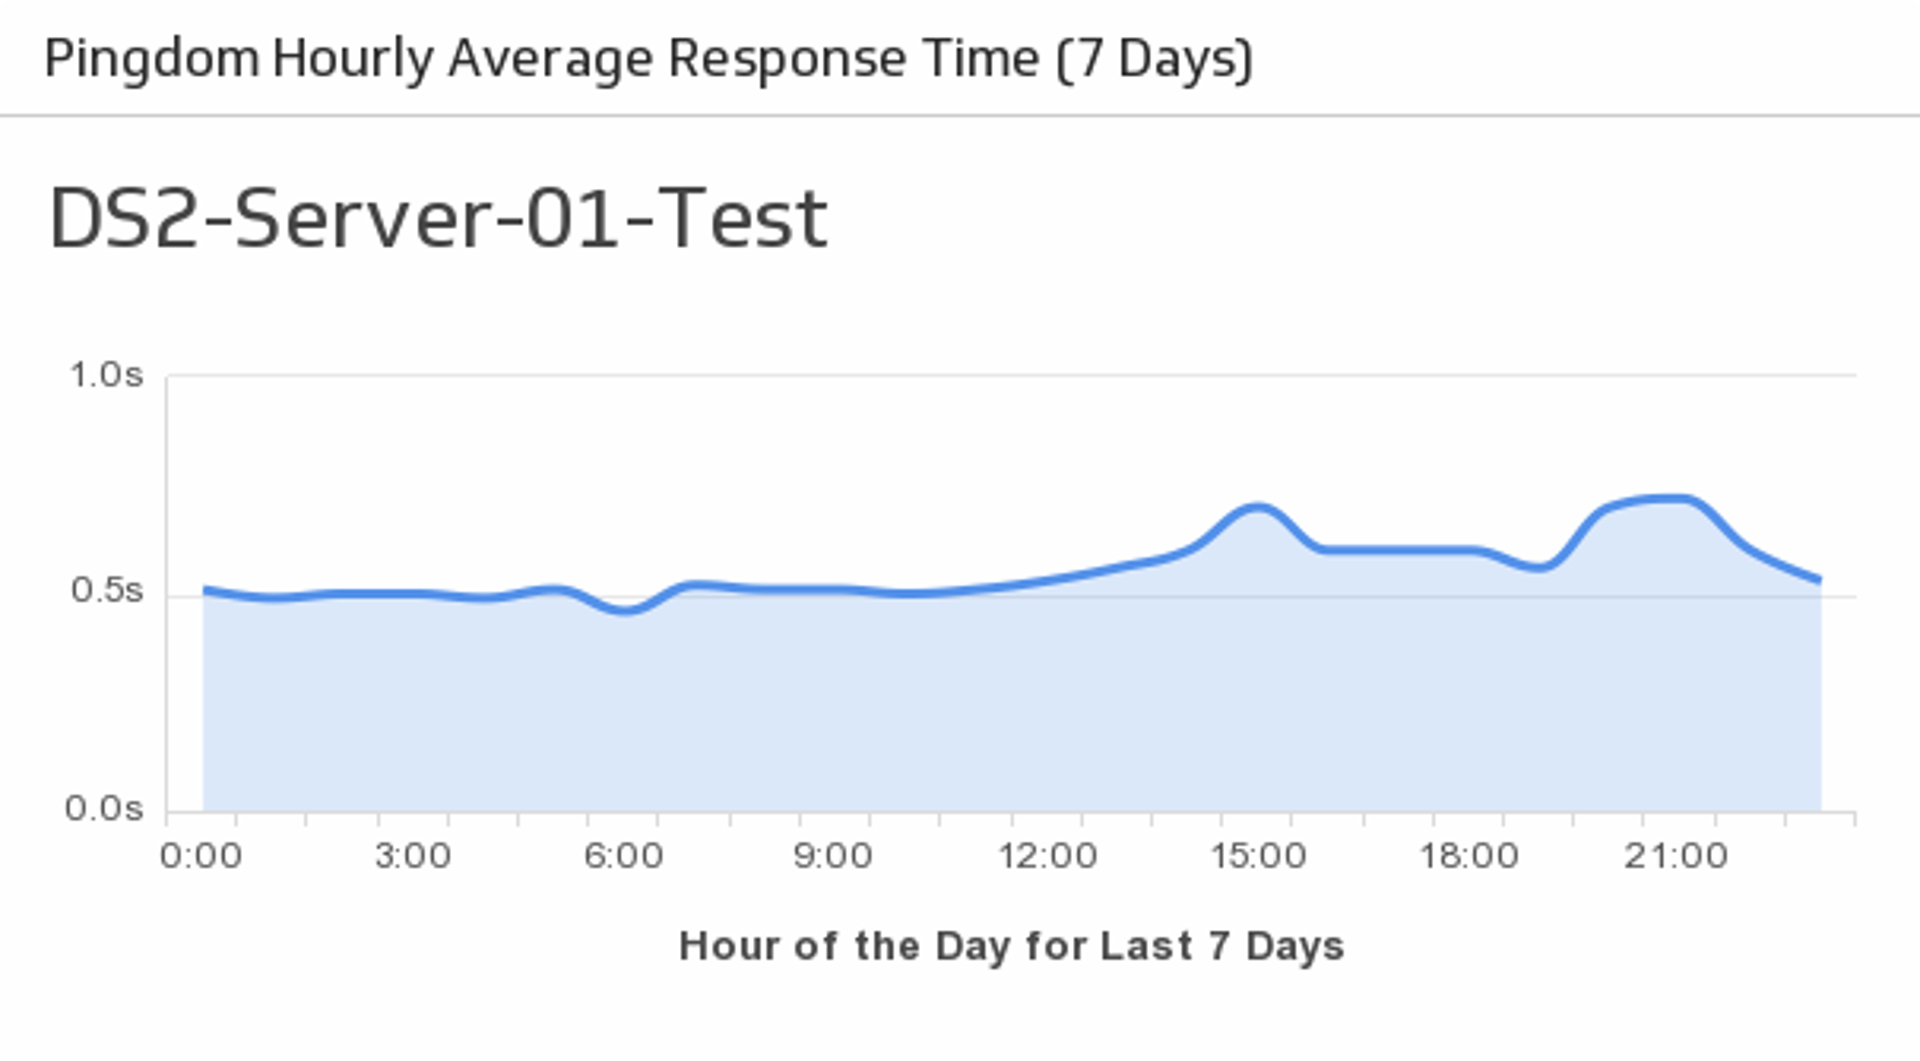
UsesHourly Average Response Time
Monitor the average response times for your specified server over the past week.
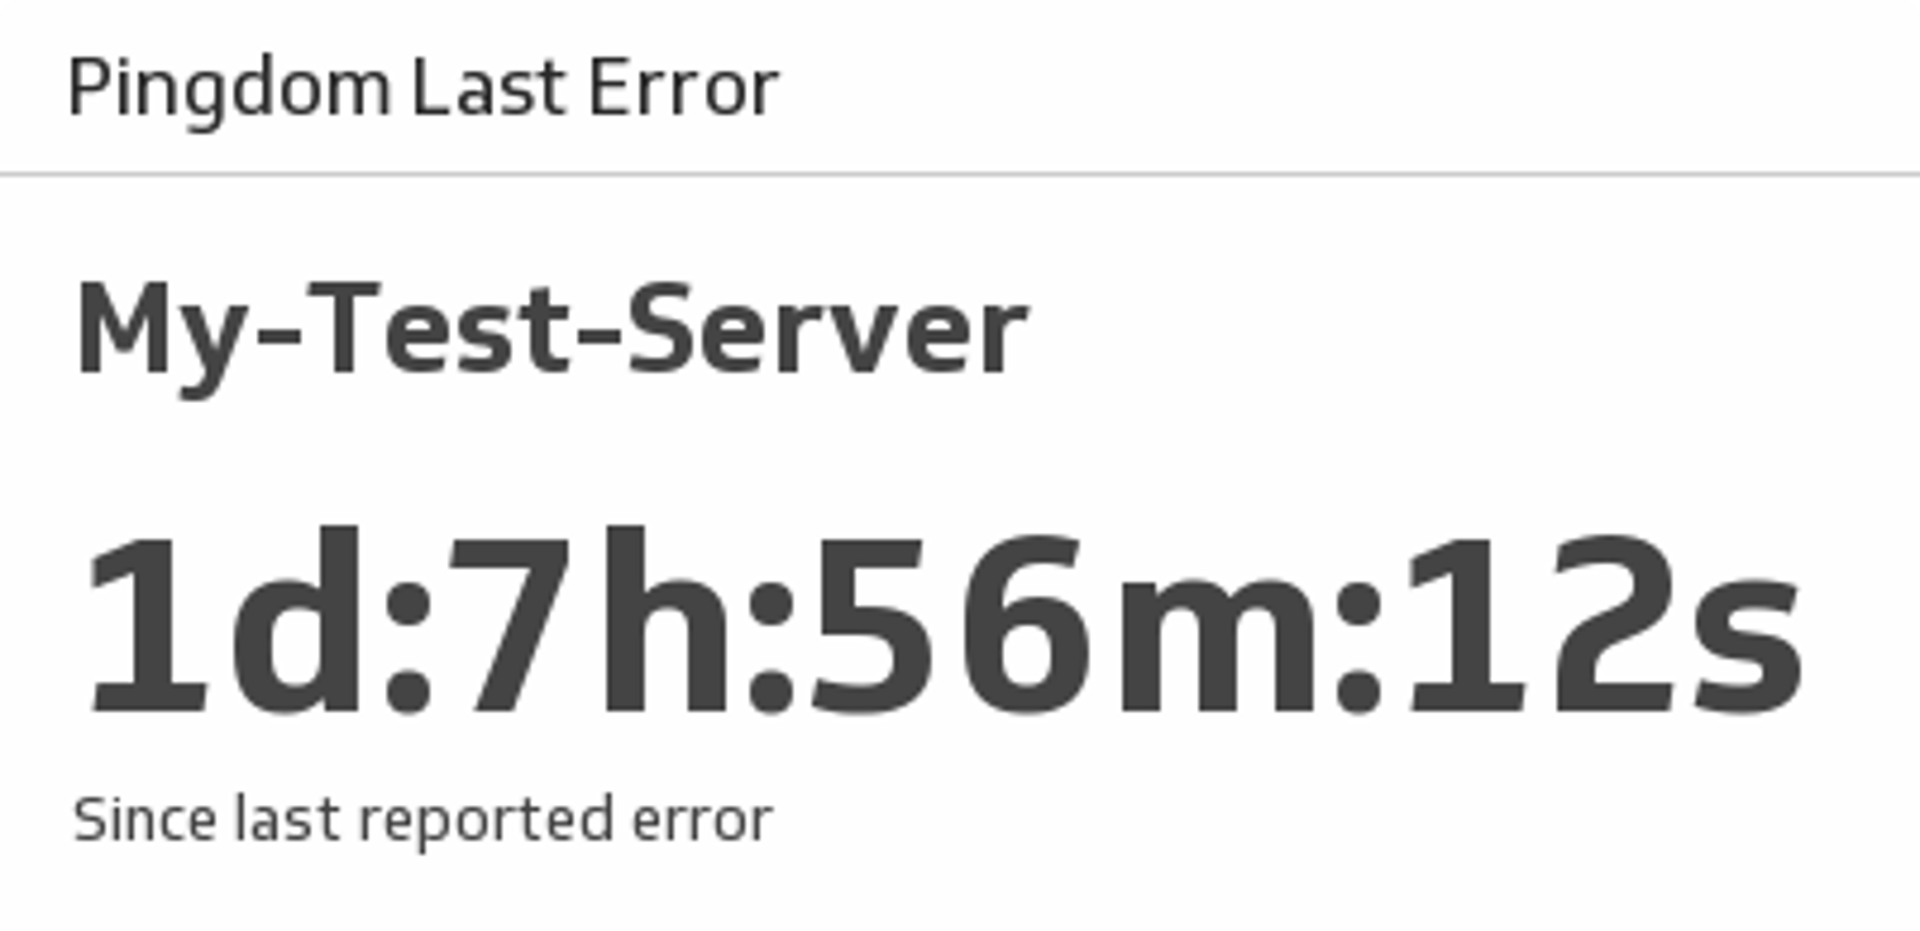
UsesLast Error
See the amount of time that has passed since your last Pingdom error.
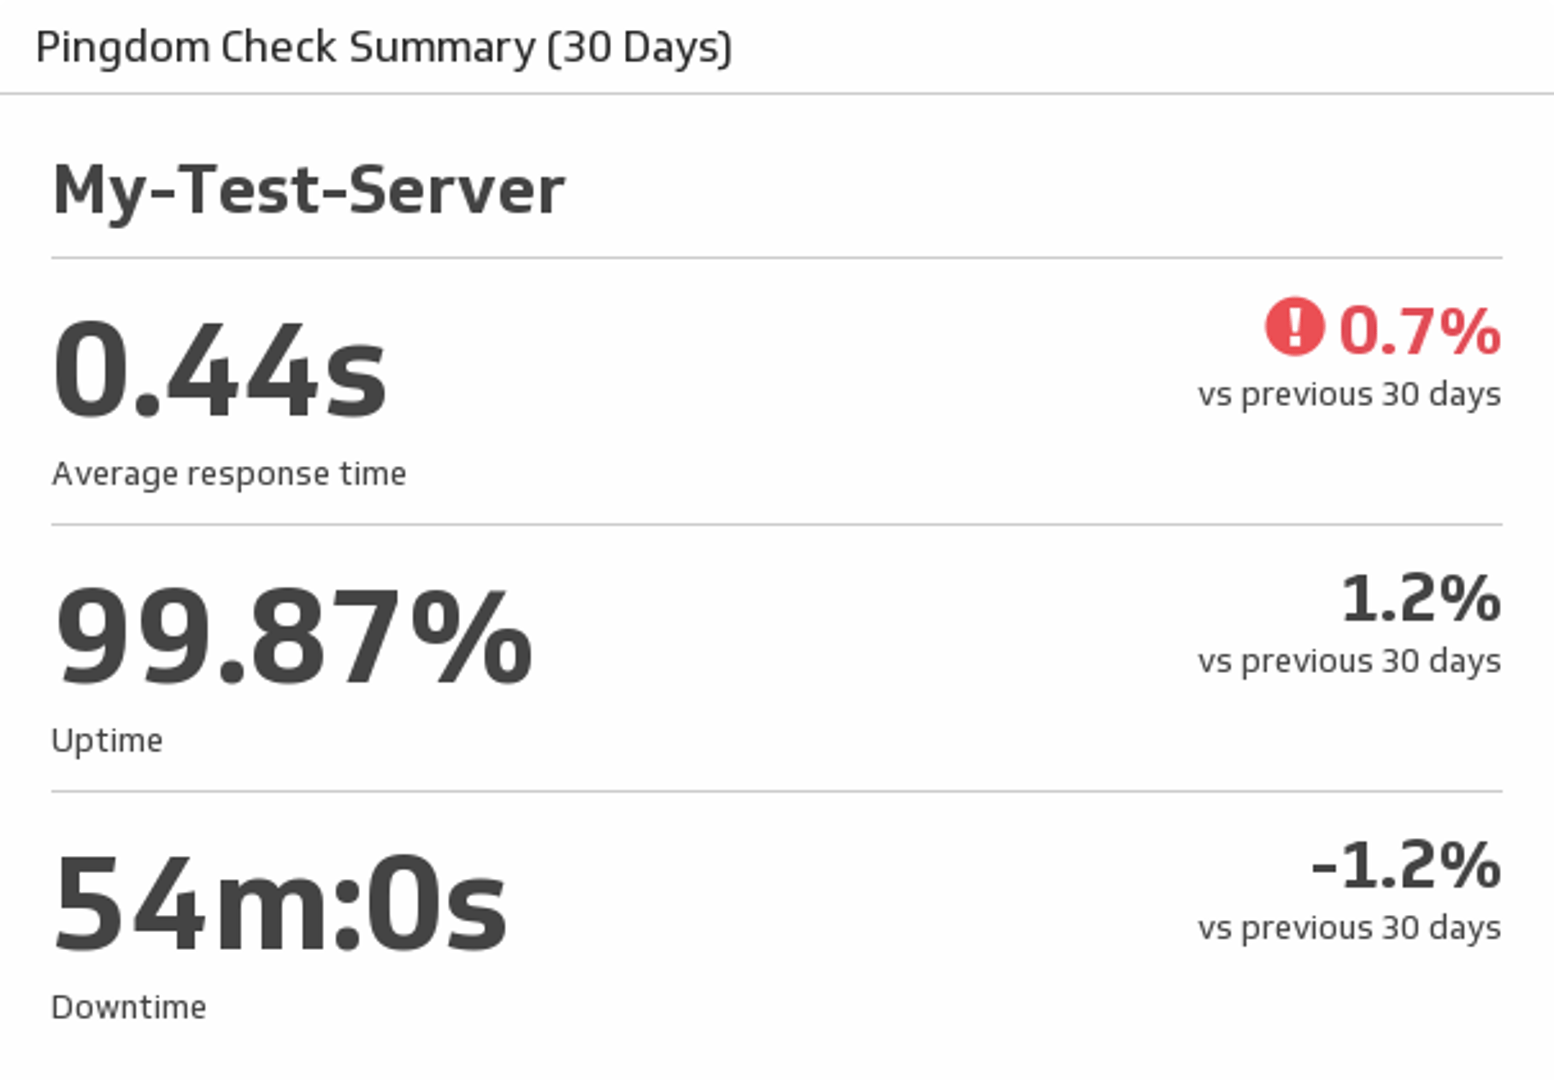
UsesServer Overview
See average response time, uptime and downtime for a specified Pingdom server.
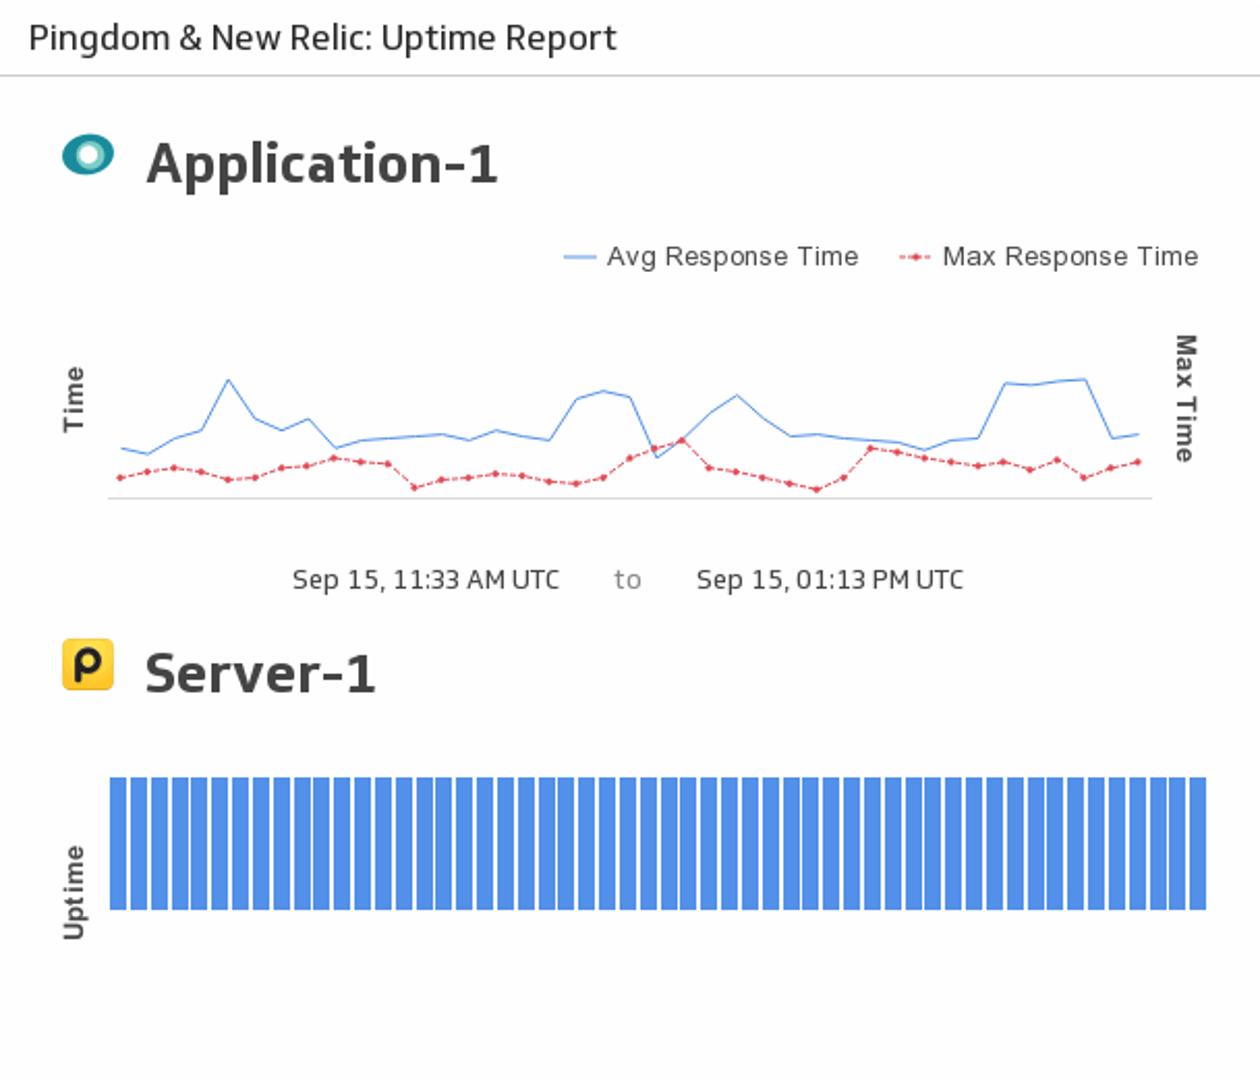
UsesUptime Report
Monitor the uptime of your chosen server using New Relic and Pingdom.
Uses