New Relic
A platform for DevOps and tech teams, New Relic is a software analytics company that gives users the ability to measure and monitor infrastructure and app performance.
Tracking down your New Relic metrics across scattered reports wastes time your team doesn't have. Connect New Relic to Klipfolio and get application performance, uptime, error rates, and response times on a single live dashboard — updated automatically.
How to connect New Relic to Klipfolio
You'll need your New Relic API Key and App ID before you start.
Find your API Key:
- Log in to New Relic.
- Click your account name, select Account settings, then click API keys under Integrations.
- Select Show key.
Find your App ID:
- Log in to New Relic.
- Select your application from the home screen.
- Check the URL in your browser's address bar. The second number sequence is your App ID. For example, in
https://rpm.newrelic.com/accounts/1234/applications/123456, your App ID is123456.
Connect in Klipfolio:
- Go to the Service Connectors page and select New Relic.
- Choose a pre-built data source or click Create a custom New Relic data source.
- Enter your App ID and API Key in the required fields.
- Click Get data, confirm the data looks right, then click Continue.
- Name your data source, set a refresh schedule, and click Save.
View the step-by-step setup guide
Top reasons to use Klipfolio for New Relic dashboards
See all your performance metrics in one place. Pull application uptime, response times, Apdex scores, and error rates into a single dashboard — no more switching between New Relic views.
Combine New Relic data with other sources. Blend app performance data with business metrics from tools like Google Analytics 4, HubSpot, or your own database to get the full picture.
Share dashboards across your team. Distribute live dashboards via TV mode, public links, scheduled PDF emails, or embedded views — so engineering and leadership stay aligned.
Start fast with pre-built Klips. Use pre-built visualizations from the Klip Gallery to get a working New Relic dashboard in minutes, then customize as needed.
Refresh on your schedule. Set data refresh rates from 1 minute to 24 hours depending on how closely you need to monitor your application.
What Klipfolio adds to your New Relic workflow
| What you do in New Relic | What Klipfolio adds |
|---|---|
| View performance data inside the New Relic interface | Live dashboards accessible to your whole team, anywhere |
| Manually export reports for stakeholder updates | Automated, scheduled PDF or email reports |
| Monitor one application at a time | Combine multiple apps and data sources in a single view |
| Use New Relic's built-in charts | Custom visualizations with 30+ chart types and branded layouts |
Stop rebuilding the same performance reports every week. Start sharing dashboards that update themselves.
Use pre-built New Relic metrics
Assemble a New Relic dashboard by selecting pre-built metrics from the Klip Gallery.
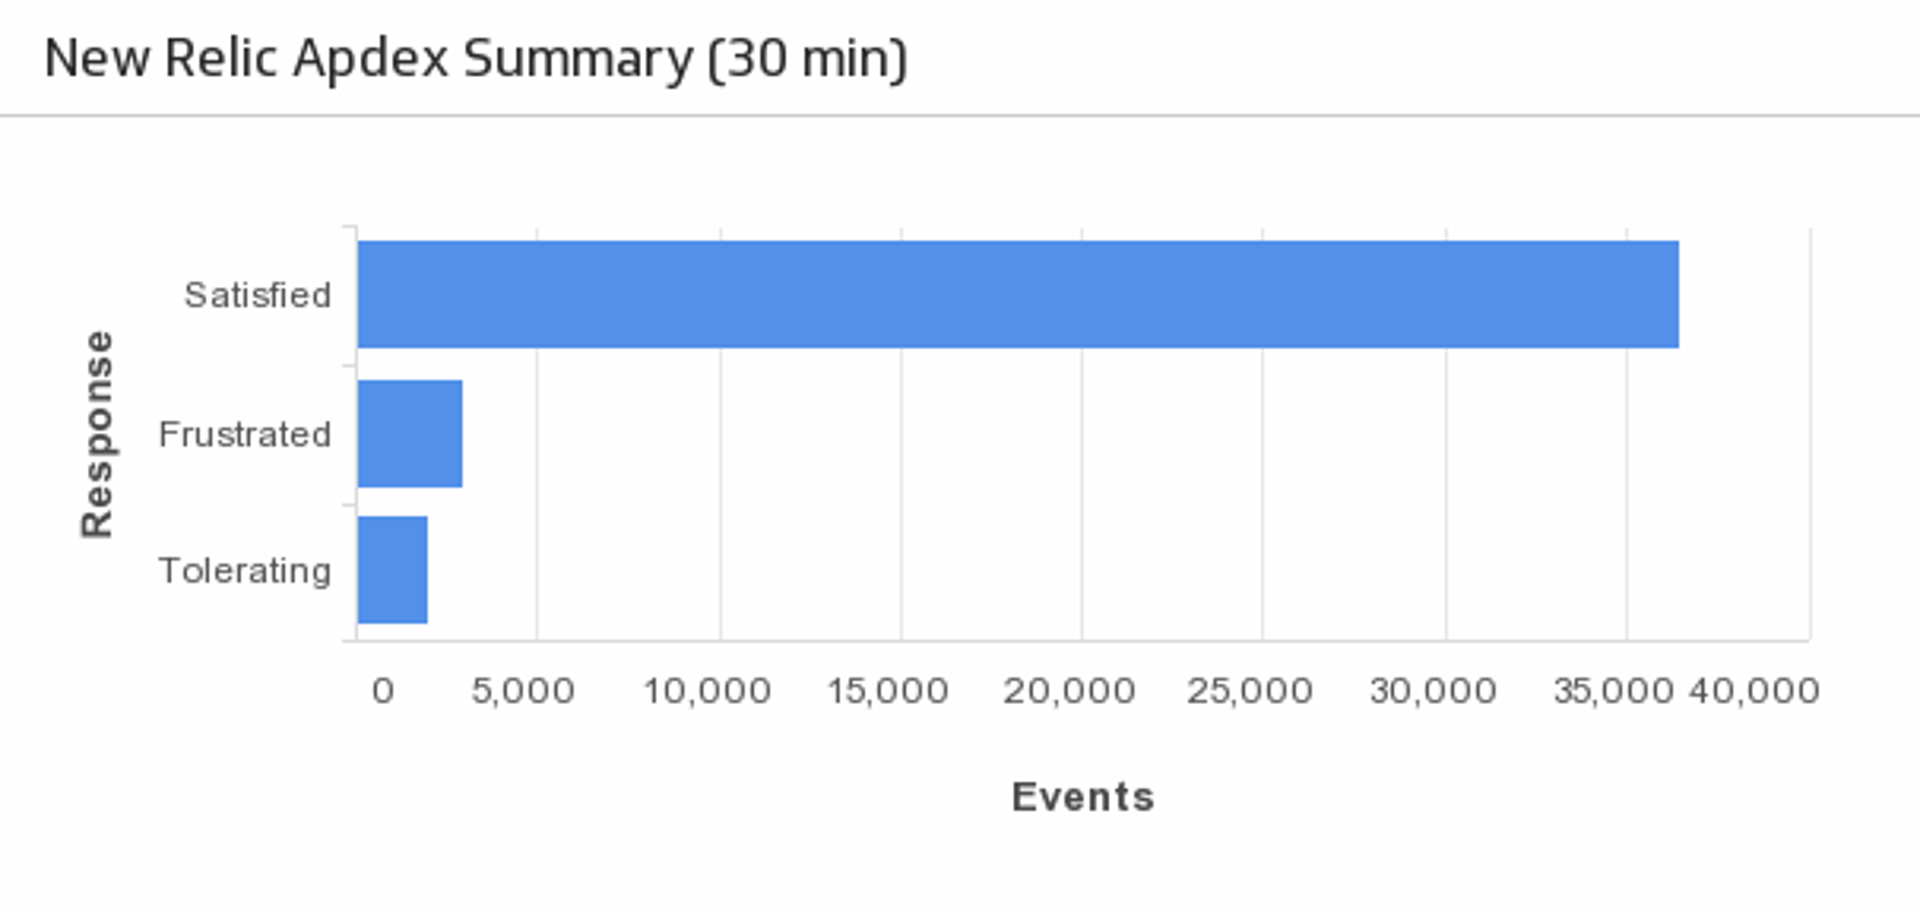
Apdex Summary
Displays a summary of application performance for the last 30 minutes.
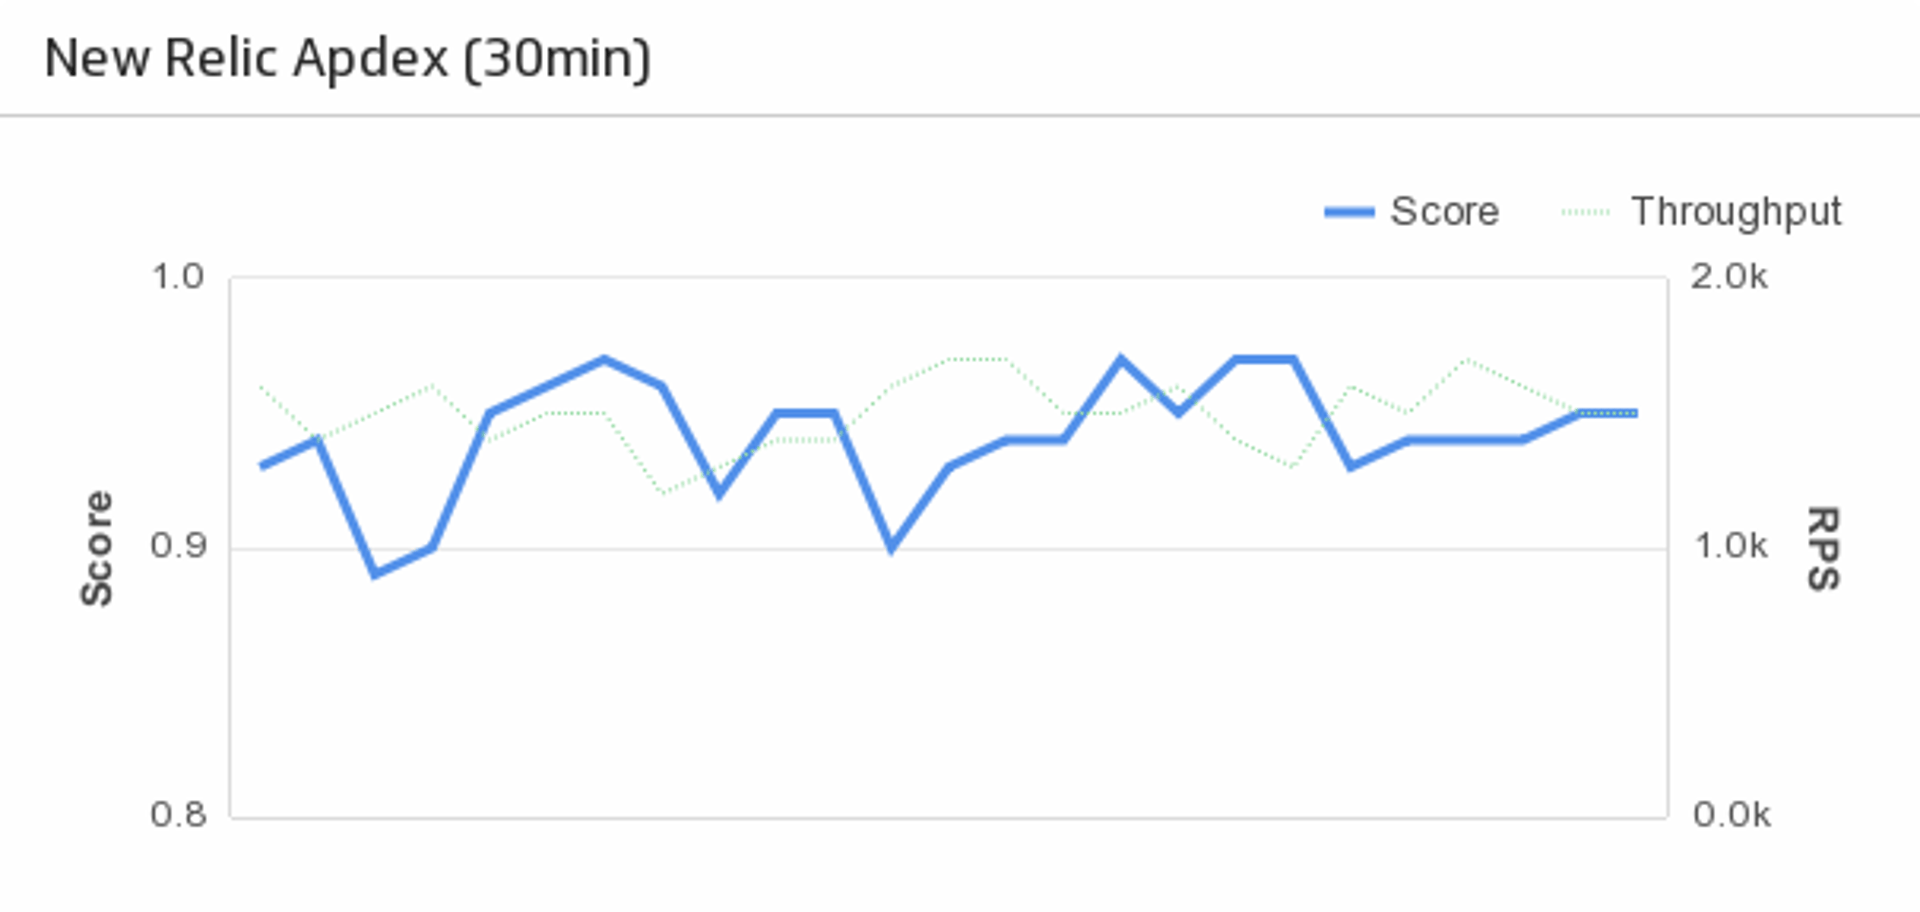
UsesApplication Apdex
Displays application apdex score and throughput for the last 30 minutes.
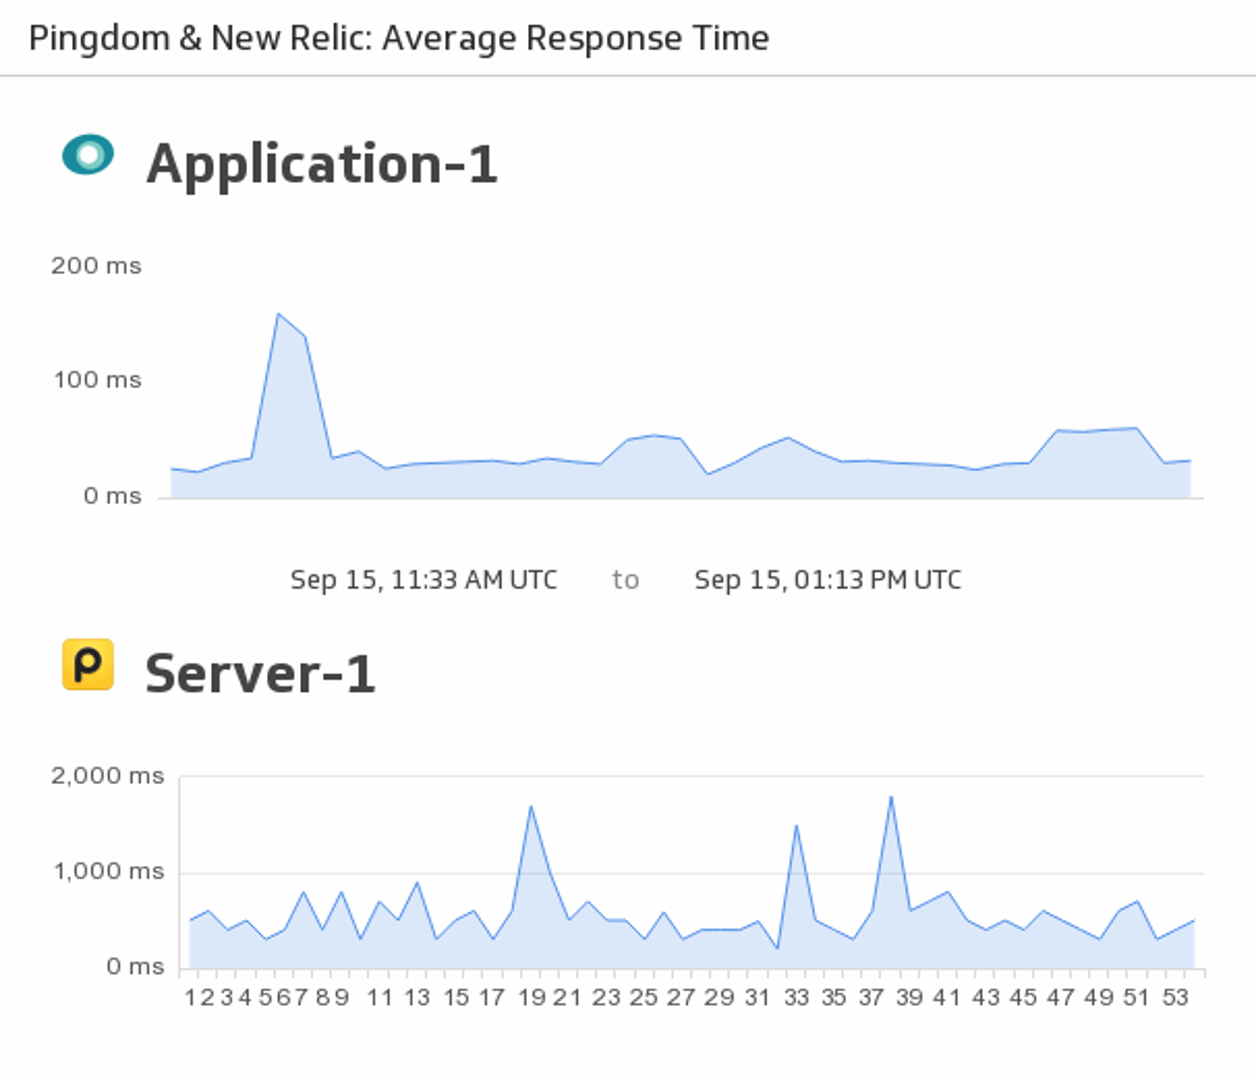
UsesAverage Response Time
Make sure to stay on top of your server and application response time by merging your New Relic and Pingdom data to monitor responsiveness in real-time.
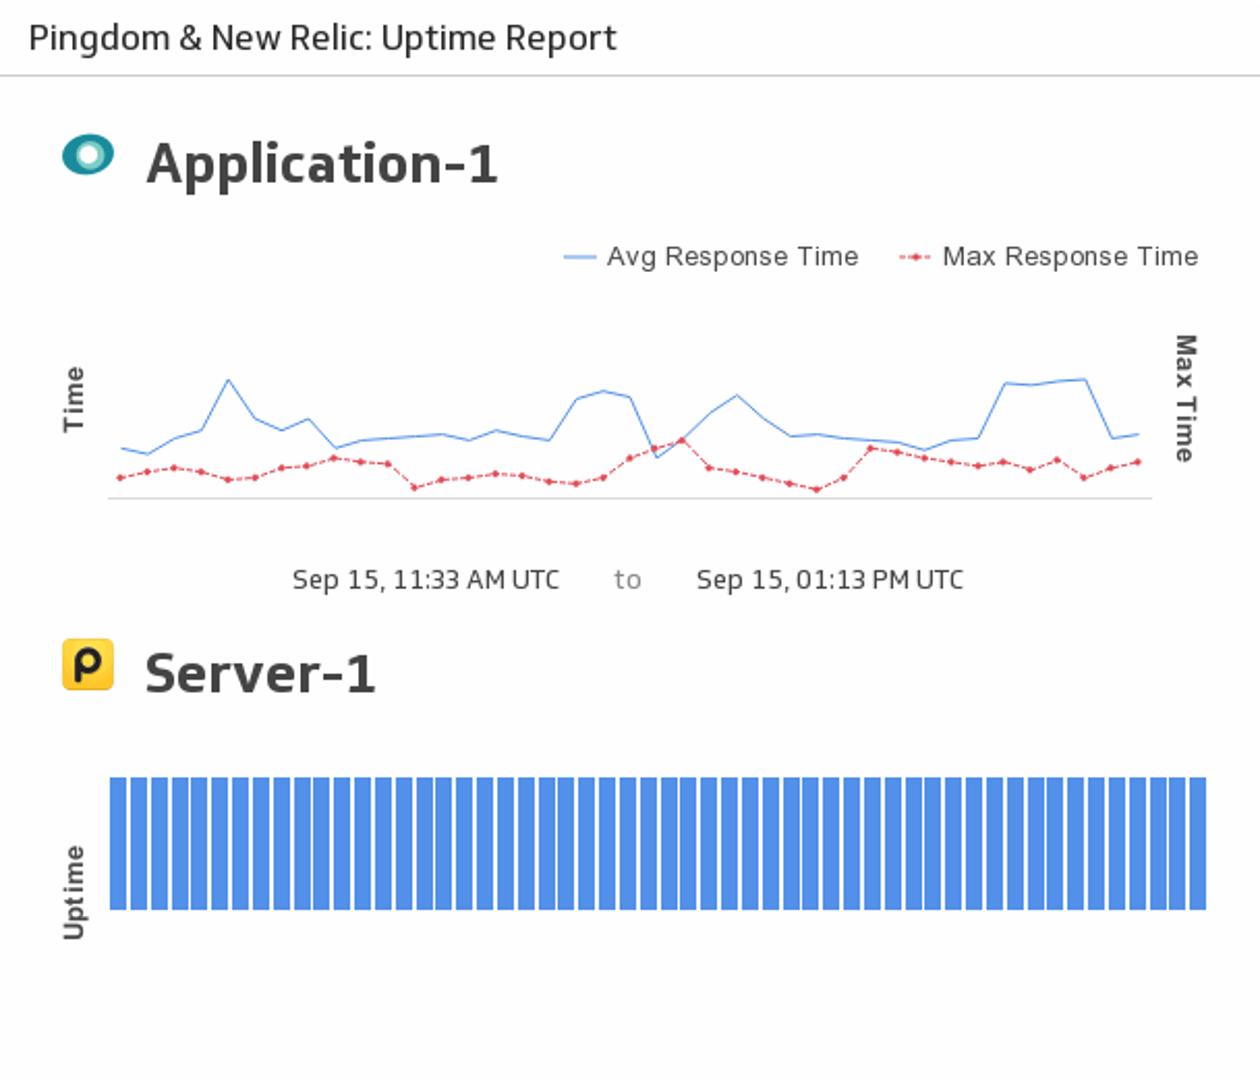
UsesUptime Report
Monitor the uptime of your chosen server using New Relic and Pingdom.
Uses