Excel
Connect your Excel spreadsheets to Klipfolio Klips and build live dashboards that update automatically. Combine Excel data with 100+ other sources, visualize KPIs, and share with your team via TV mode, public links, or scheduled reports.
Manually exporting spreadsheets for every report is slow, error-prone, and impossible to share in real time. Connect your Excel files to Klipfolio Klips and turn static data into live dashboards your whole team can see.
How to connect Excel to Klipfolio
- Sign in to your Klipfolio account.
- Upload your Excel file directly, or connect via Google Drive, OneDrive, Dropbox, SharePoint, or Box to automate future updates.
- Select your data in the Klip Editor — choose a column or row header (e.g., A:A) to capture an unlimited range that updates automatically as new rows are added.
- Build your Klip by choosing a visualization type, applying formulas, and configuring any filters or indicators.
View the step-by-step setup guide
Top reasons to use Klipfolio for Excel dashboards
Real-time data without manual exports. Once your spreadsheet is connected, dashboards refresh automatically — no more emailing updated files or copy-pasting numbers.
Combine Excel with 100+ other data sources. Blend spreadsheet data with metrics from web services, SQL databases, and cloud apps in a single dashboard.
Custom visualizations beyond the grid. Use the Klip Editor to build charts, gauges, and scorecards that make your data easier to read and act on.
TV mode for team visibility. Display your Excel dashboards on office screens to promote a data-driven culture without relying on reports that go unread.
Broad distribution options. Share dashboards via public links, embedded views, scheduled PDF emails, or role-based access — your data reaches the right people, your way.
What Excel does vs. what Klipfolio adds
| What you do in Excel | What Klipfolio adds |
|---|---|
| Manually export and share files | Automated dashboards that update on a schedule |
| Analyse data in rows and columns | Visual Klips: charts, scorecards, and gauges |
| Work in a single file or tab | Combine Excel with 100+ connected data sources |
| Email spreadsheet attachments | Share via TV mode, public links, or embedded views |
Stop sending spreadsheet attachments. Start sharing dashboards that update themselves.
Use pre-built Excel metrics
Assemble a Excel dashboard by selecting pre-built metrics from the Klip Gallery.
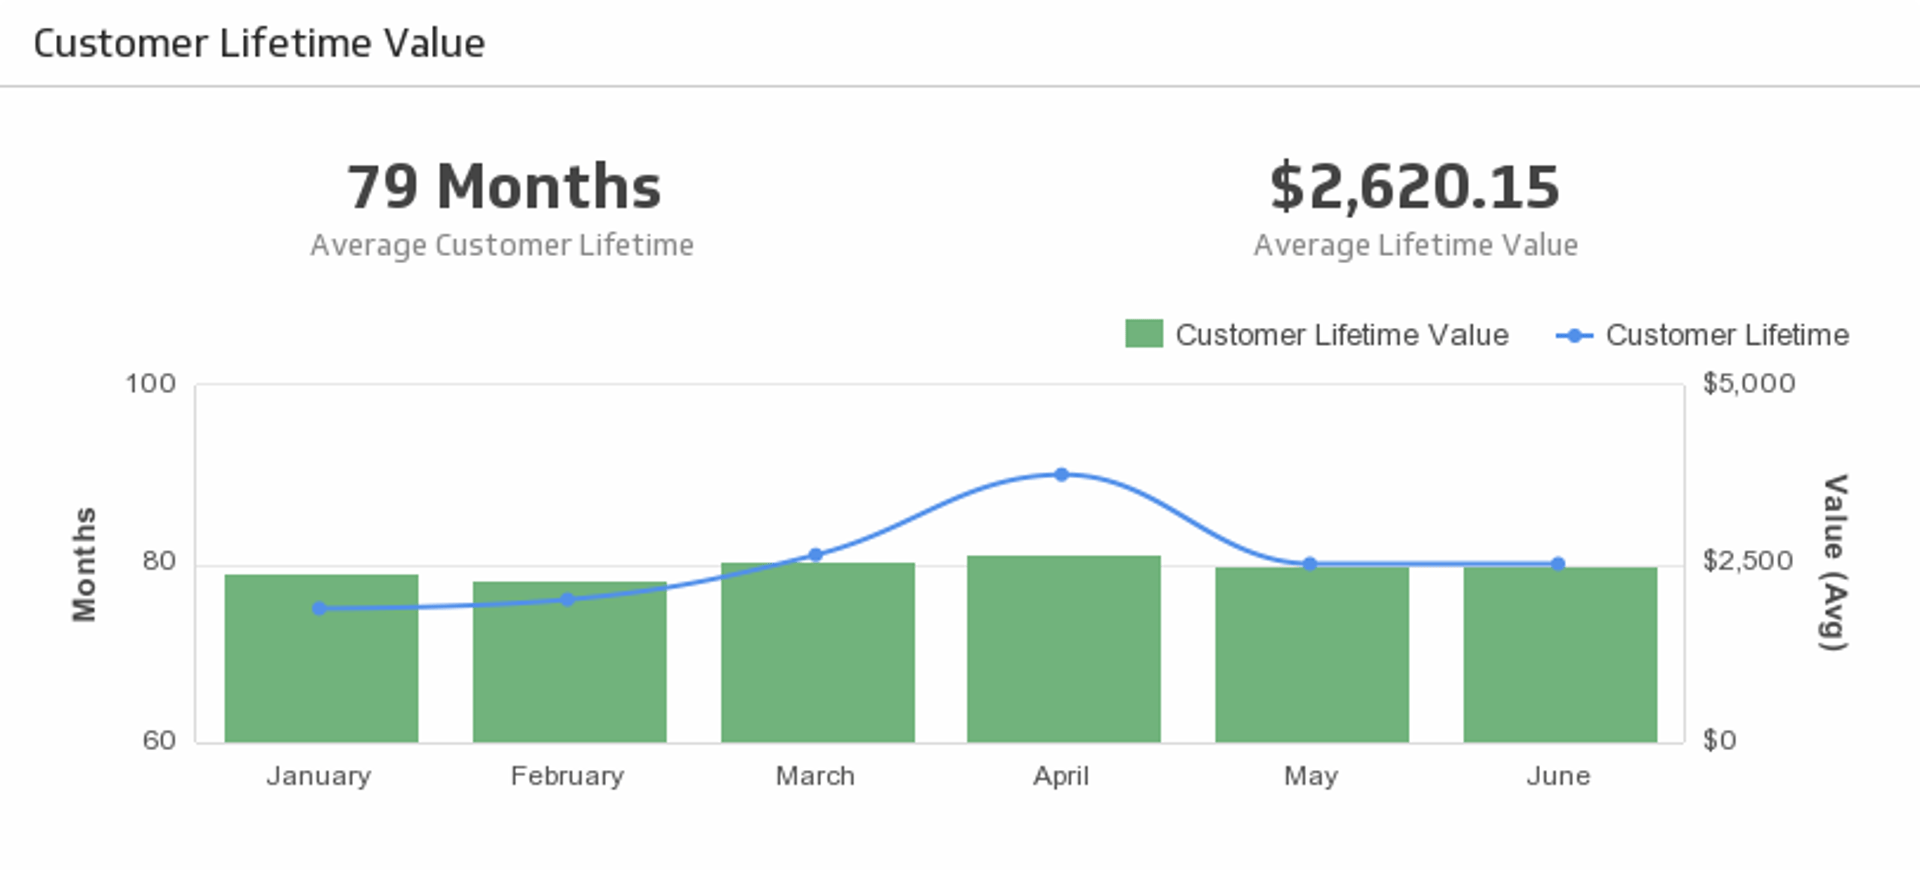
Customer Lifetime Value
The longer customers stick with you, the more valuable they are. Monitor Customer Lifetime Value, and at the same time, compare with the historical trend.
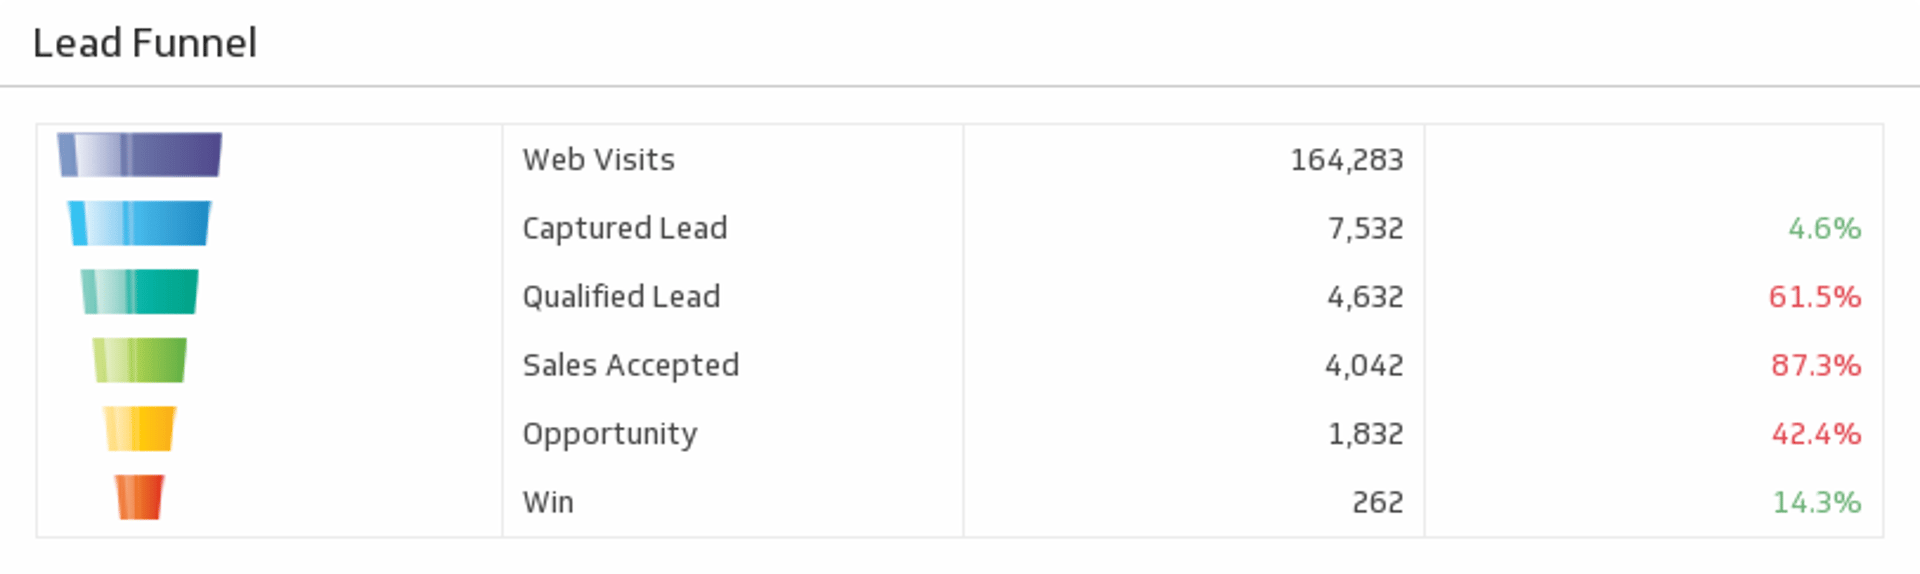
UsesSample: Lead Funnel
Measure the volume throughout each stage of your funnel, and focus in on the stages that matter most to you to improve your processes.
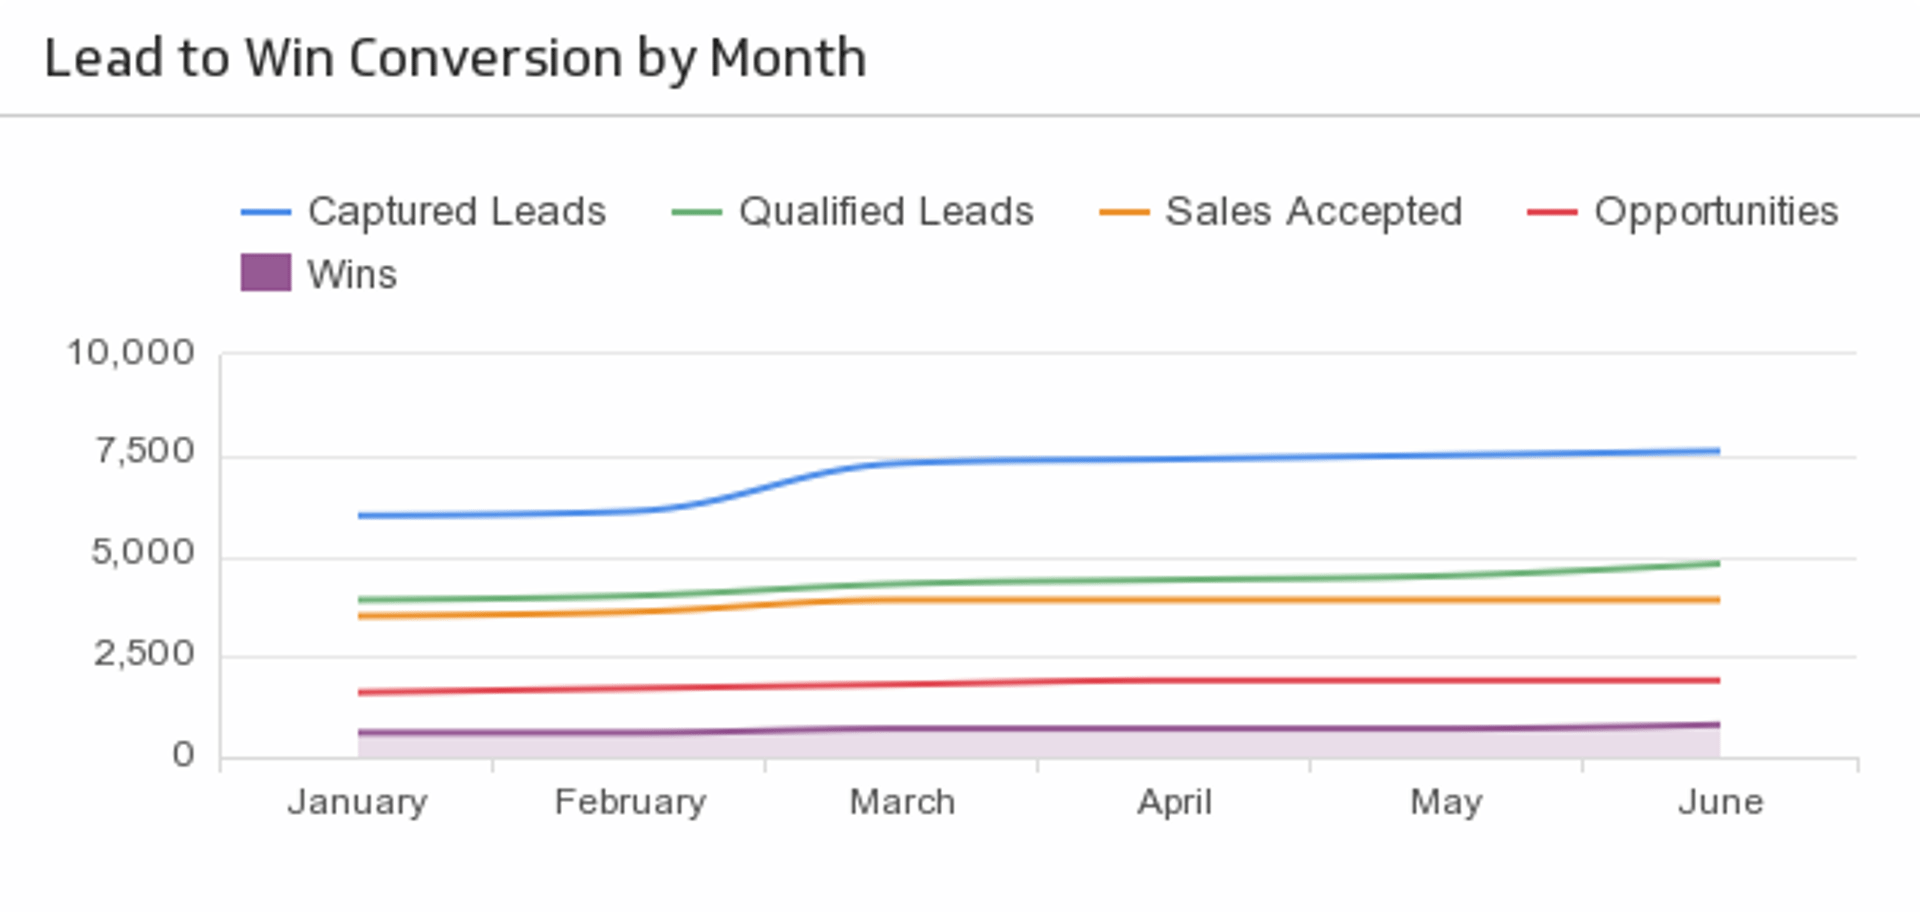
UsesSample: Lead to Win Conversion
Use a line chart to track your lead to win conversion rate over time.
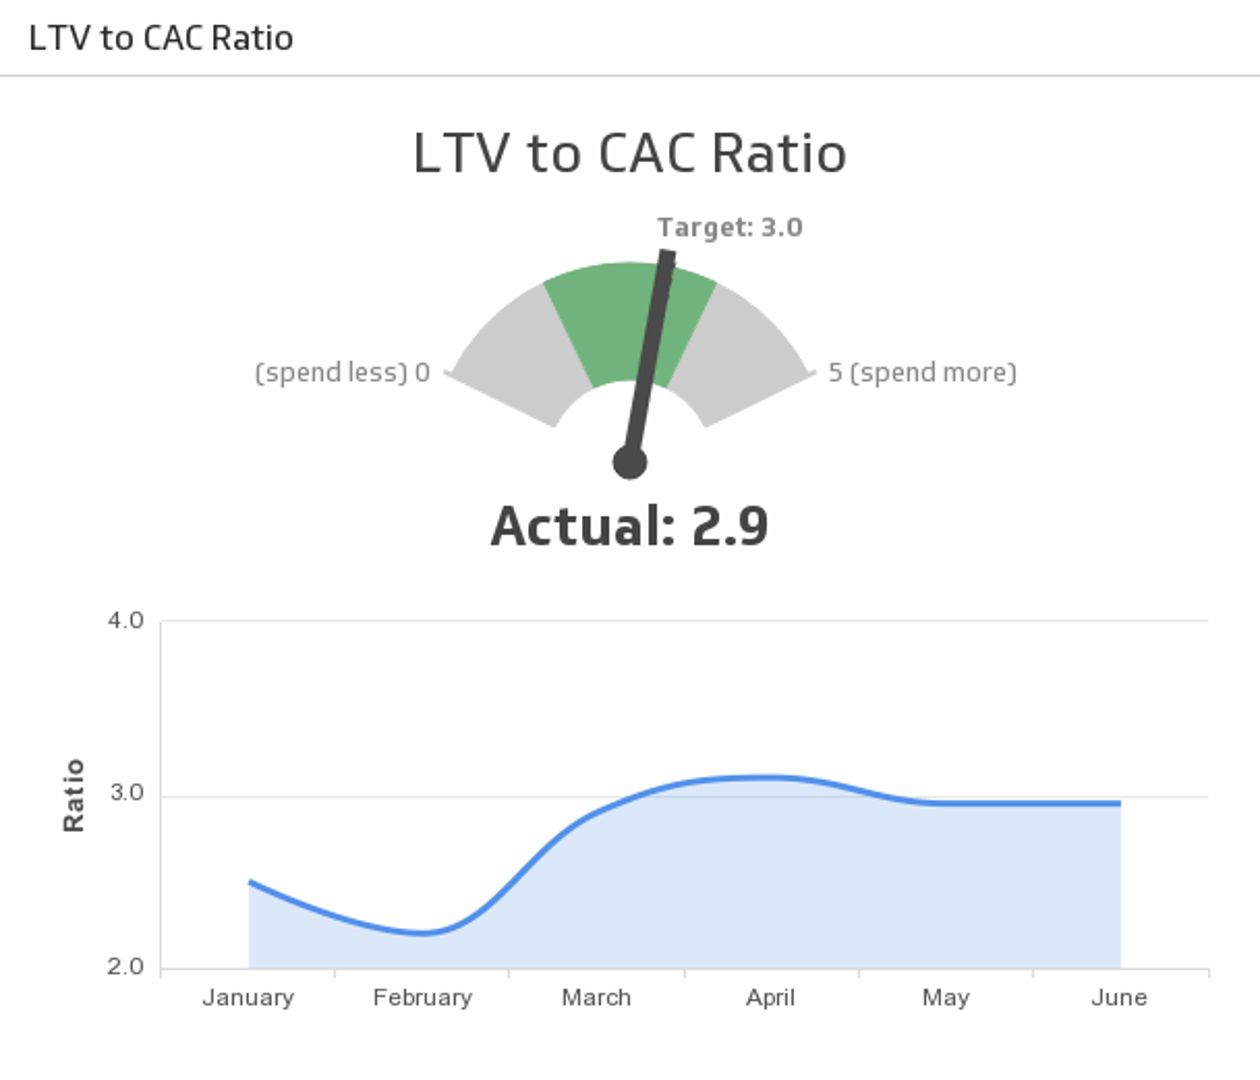
UsesSample: LTV to CAC Ratio
Ensure your marketing spend is optimized. Track the ratio between the lifetime value of a customer and the cost of acquiring that customer (LTV to CAC) against the historical trend.
UsesSample: Monthly Account Retention Rate
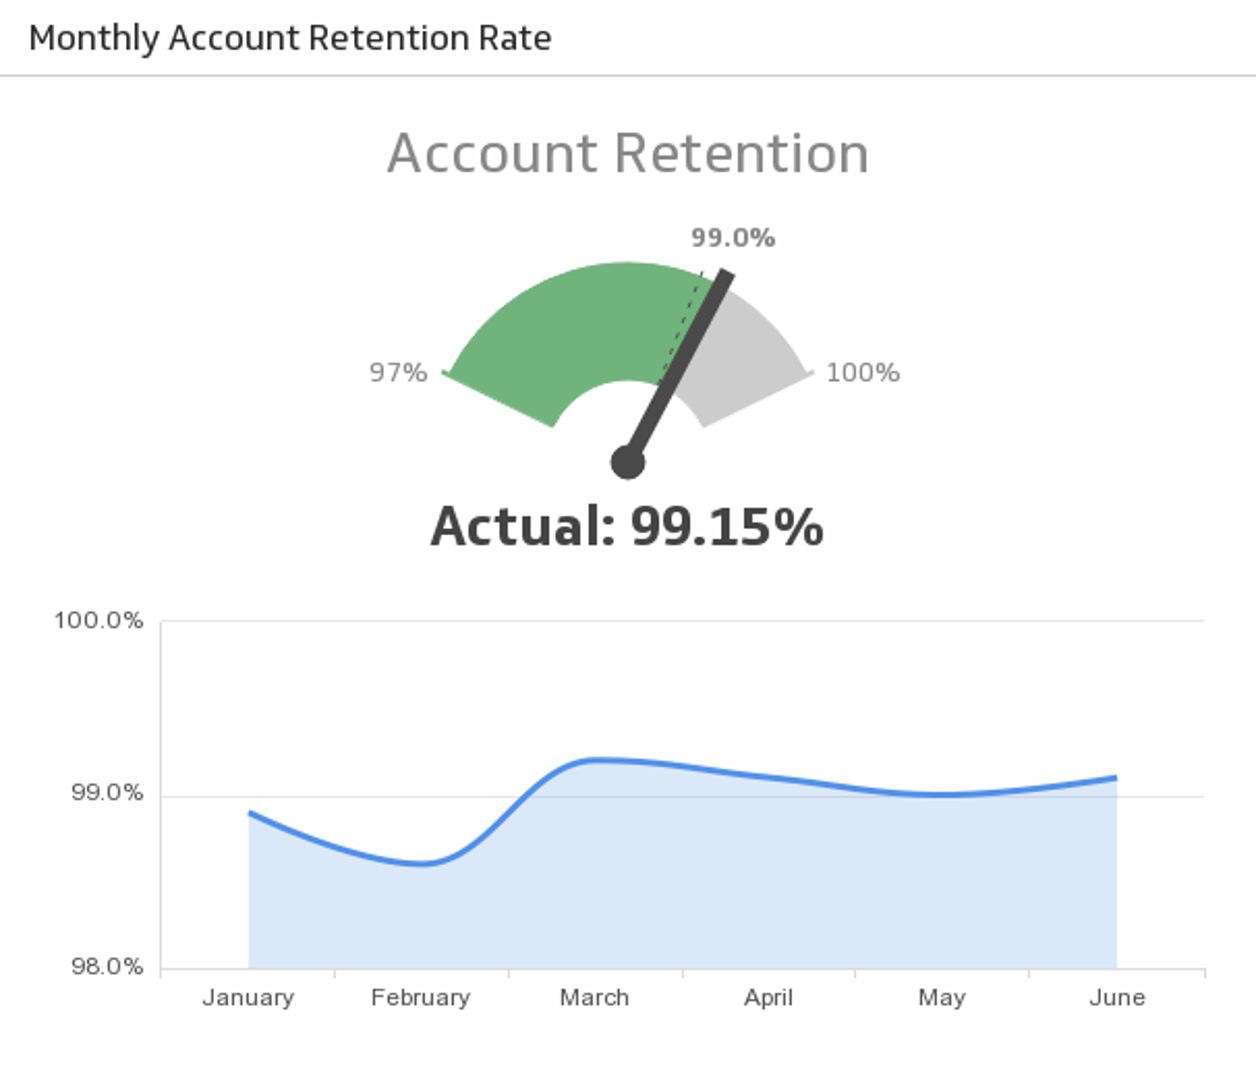
Reach your Monthly Account Retention Rate target and compare it to the trend.
UsesSample: MRR Retention / Expansion Rate
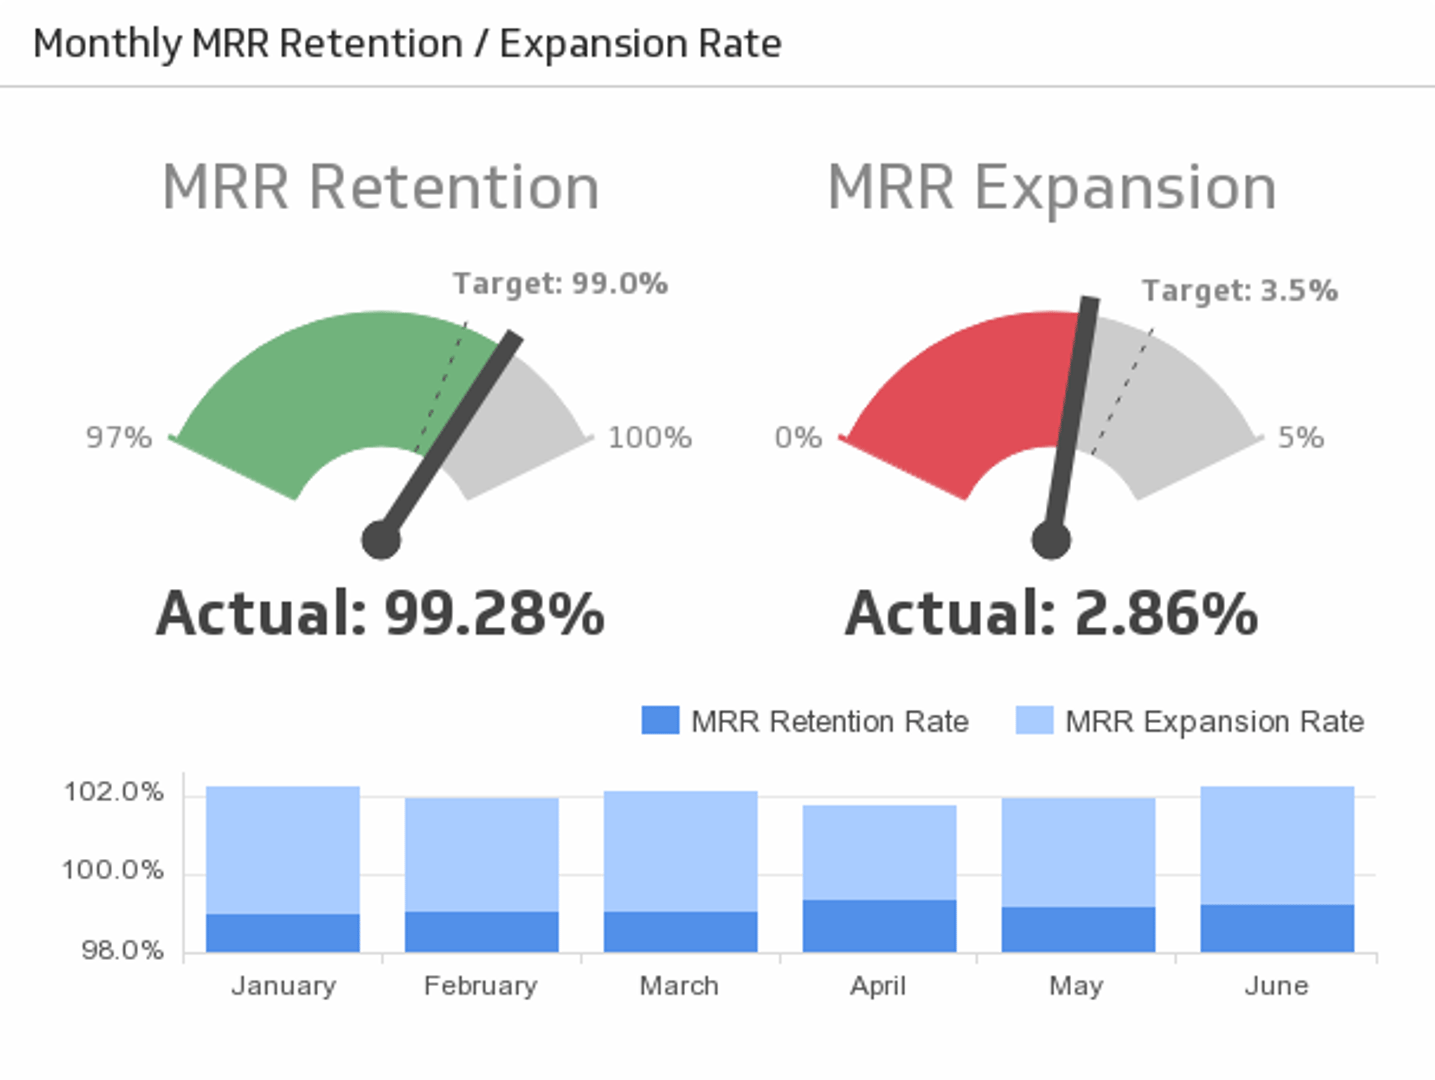
Monthly Recurring Revenue (MRR) is a central facet to many businesses. Track how effective your organization is at retaining and growing expected monthly revenue.
UsesSample: Qualified Lead to Win Conversion Rate
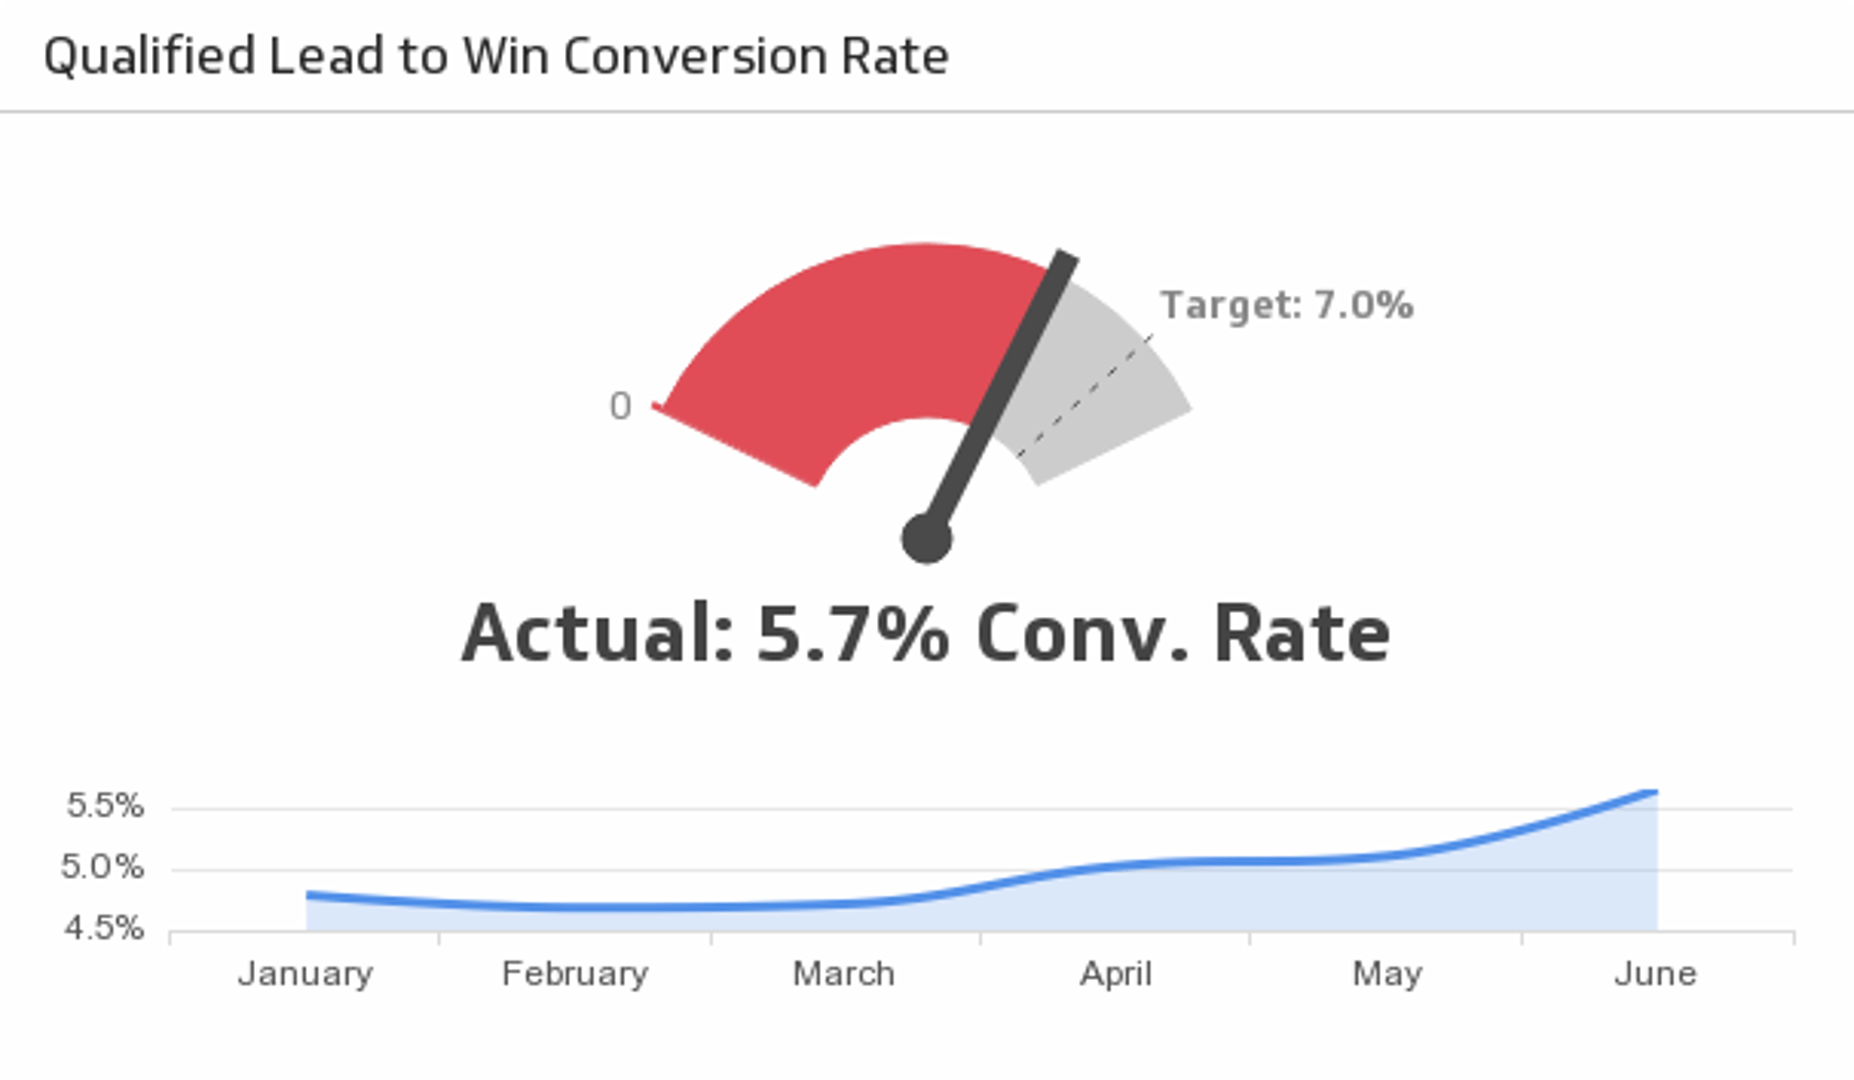
Reach your lead to win conversion rate target and compare it to the trend.
UsesSample: Retention and Expansion by Month
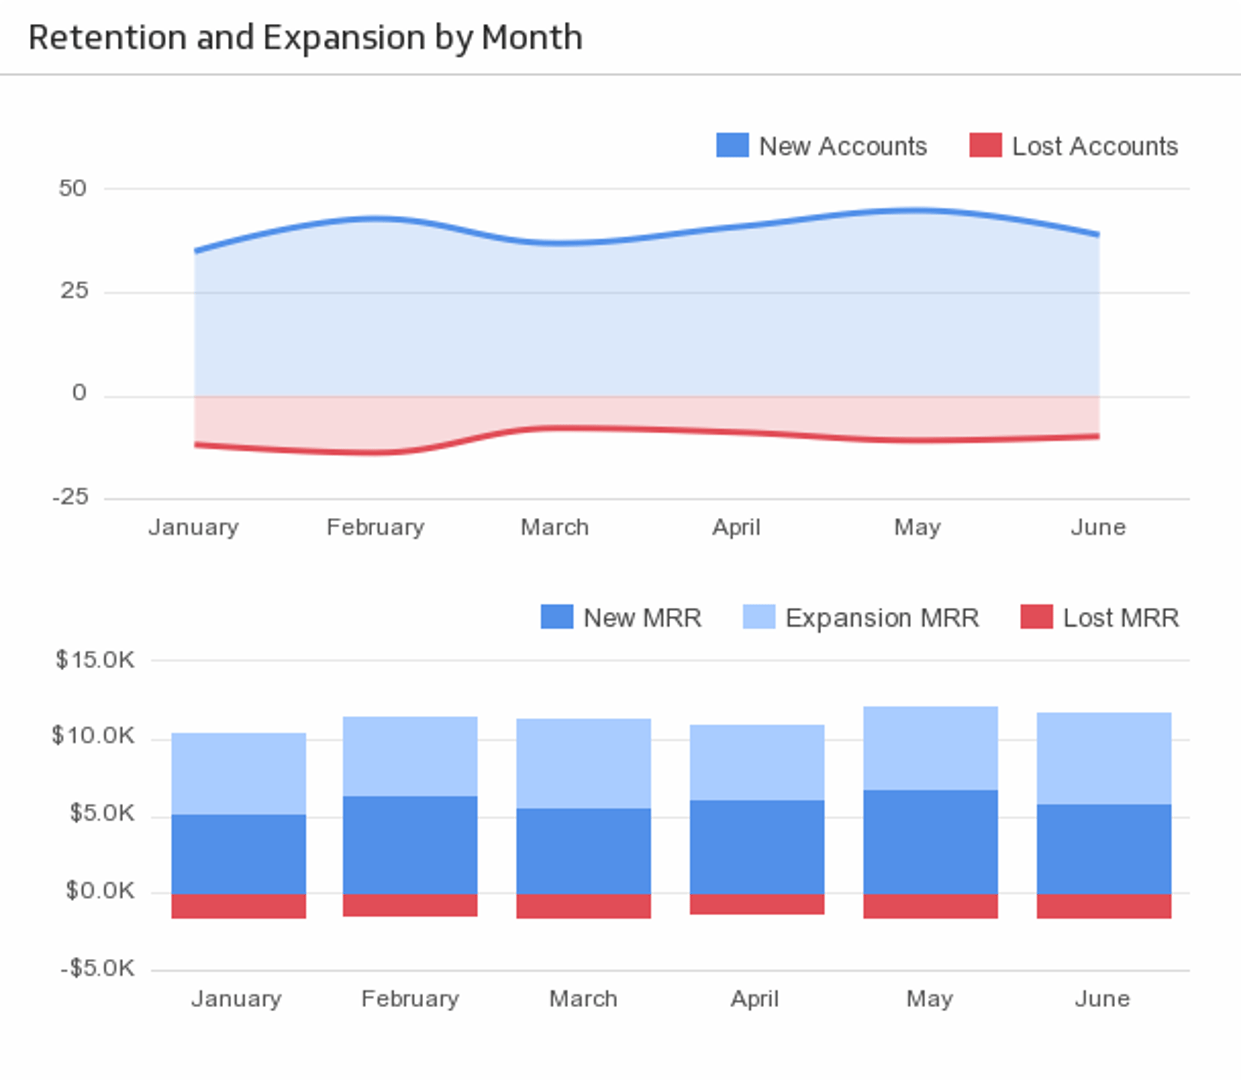
Monitor business retention and expansion on a month-to-month basis, and keep the pulse of your business in check.
Uses