
Business Dashboard
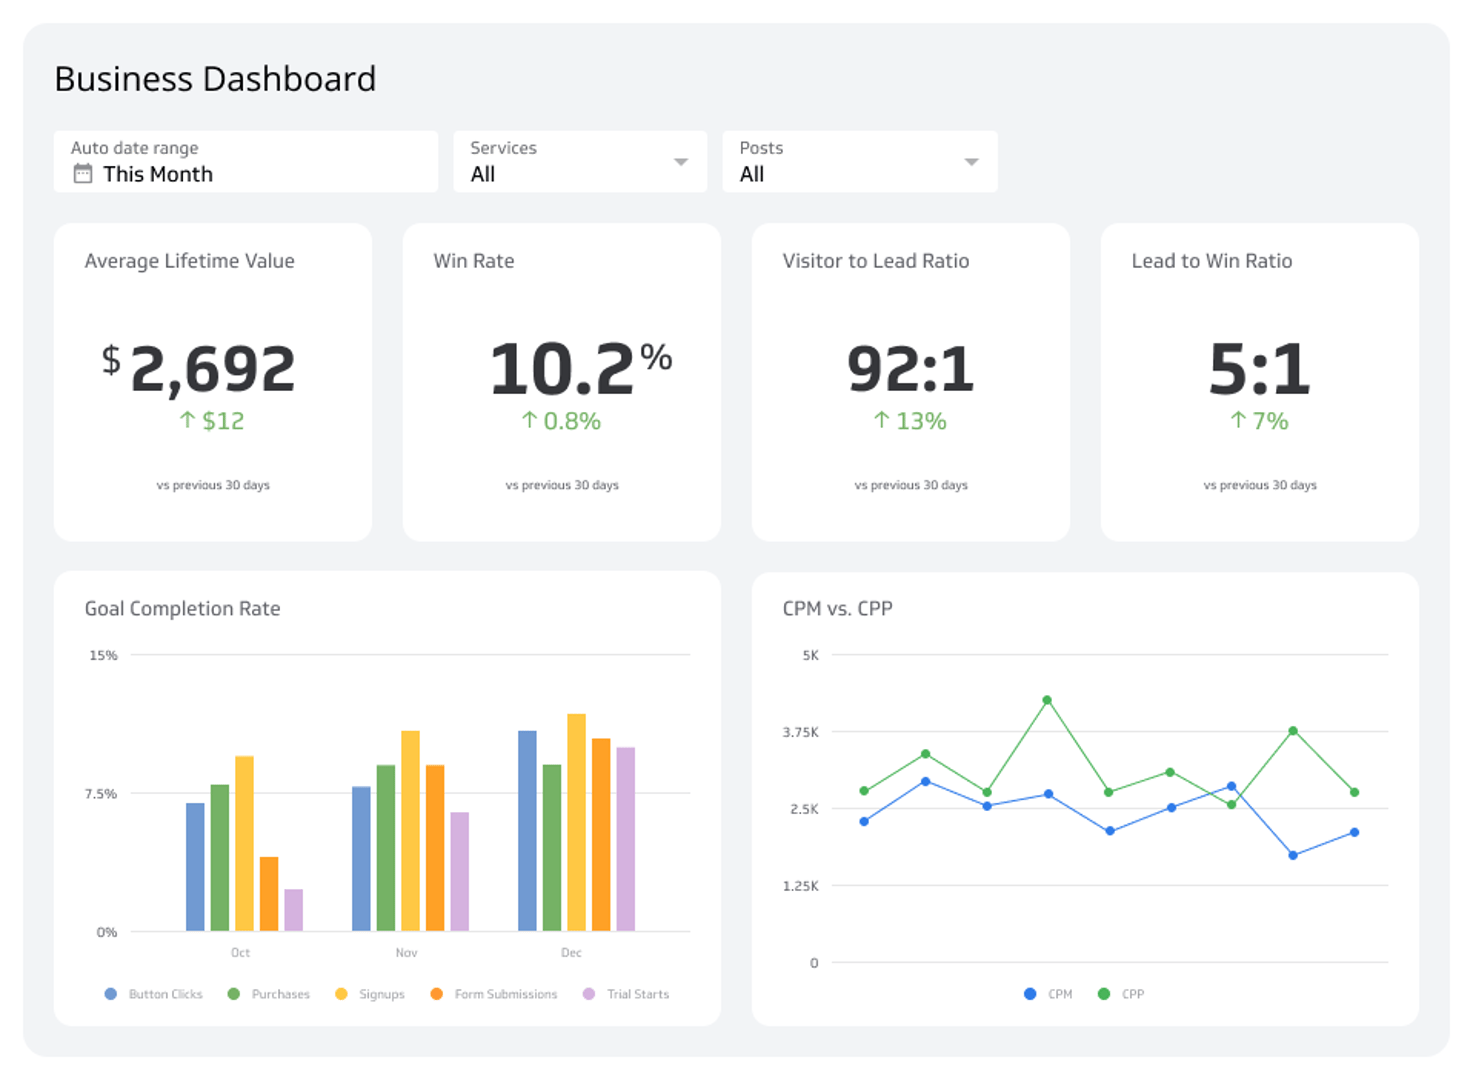
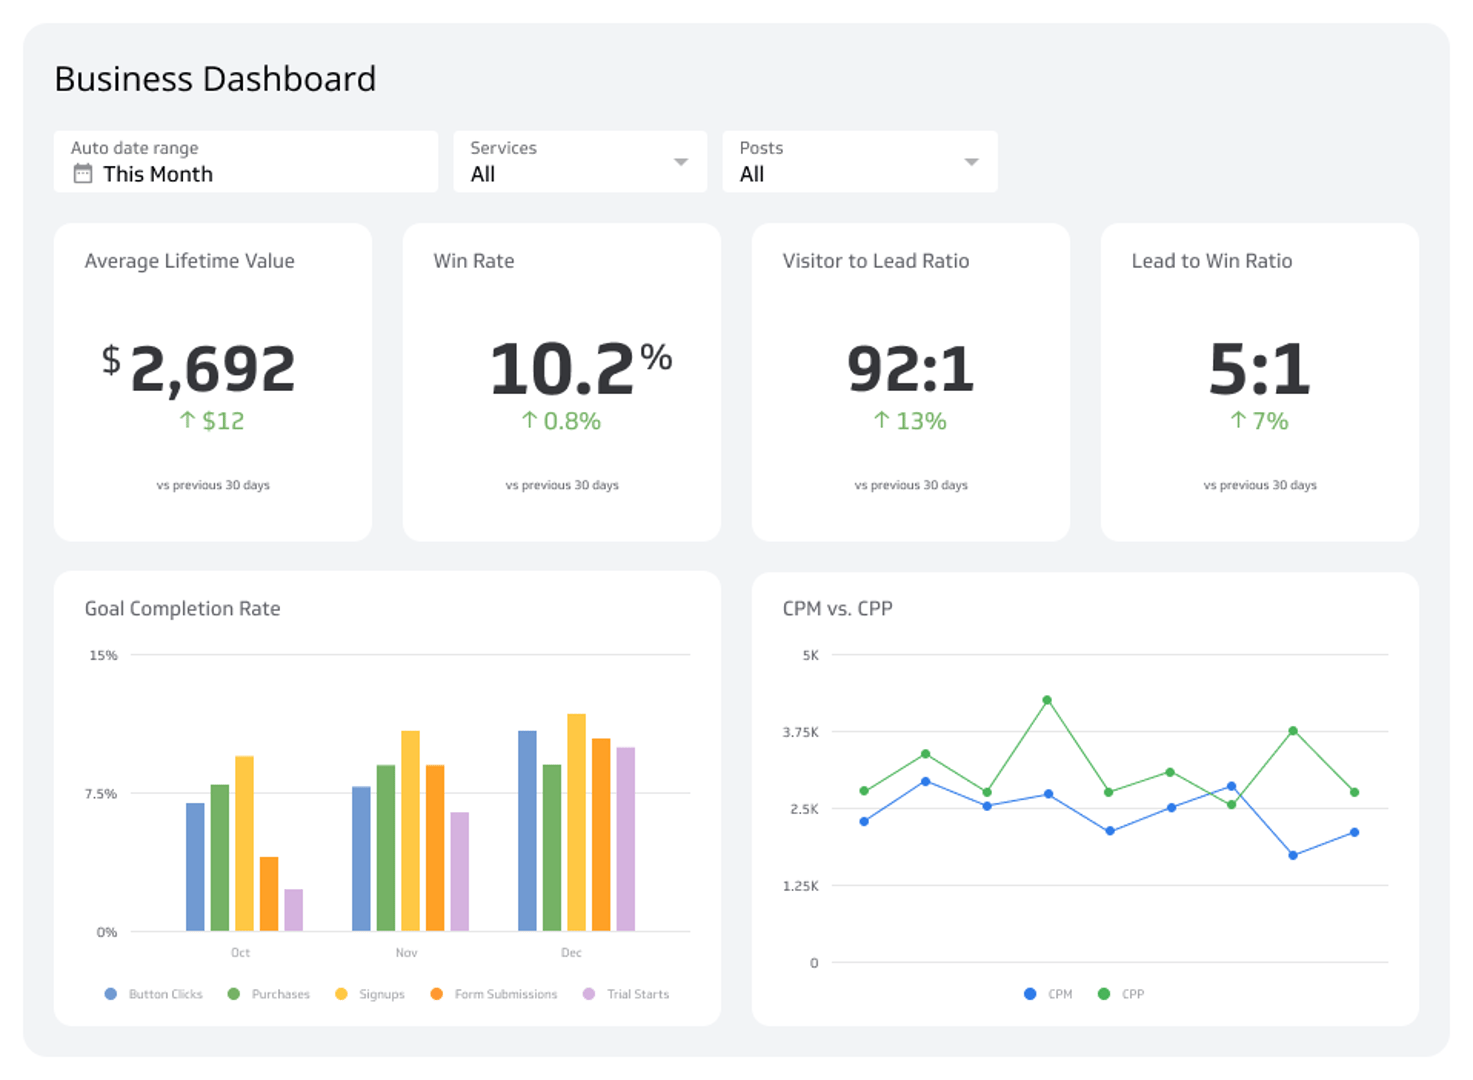
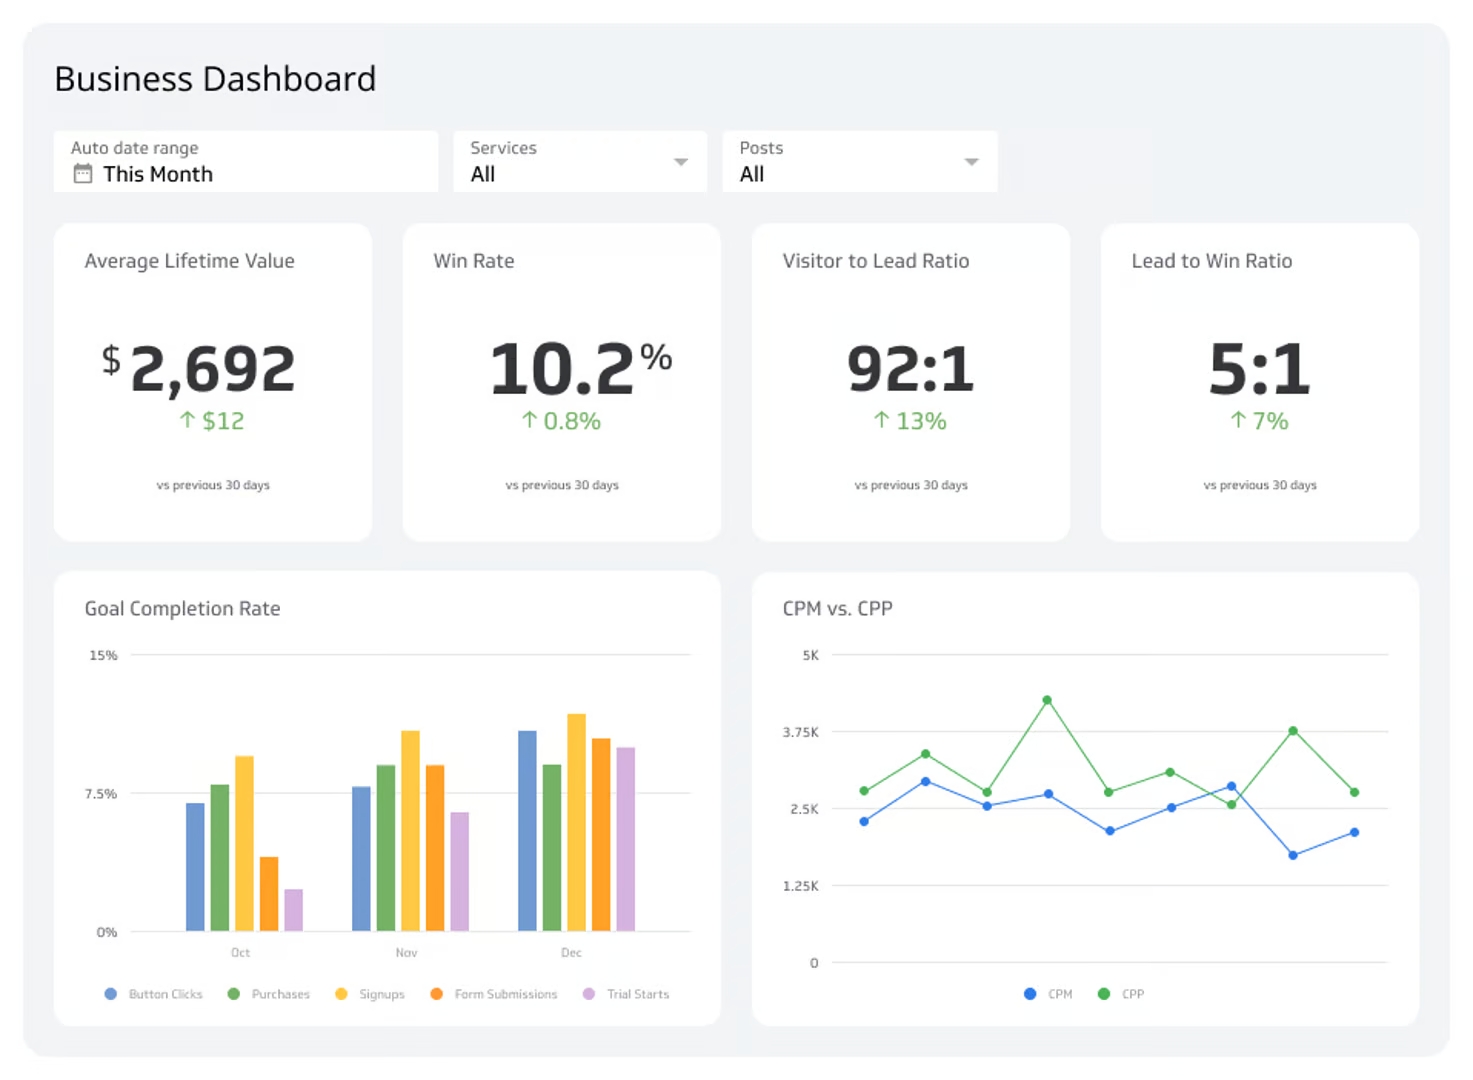
A business dashboard consolidates your key metrics and KPIs into one reliable, real-time view, so you always know how your business is performing.
What is a business dashboard?
A business dashboard is a single view that pulls your key metrics and KPIs from multiple sources and displays them in charts, graphs, and tables you can read at a glance.
Most leaders are making decisions with numbers scattered across spreadsheets, app-specific reports, and email updates. A business dashboard replaces that with one reliable, up-to-date picture of how your business is performing.
Business Dashboard Examples
- Business
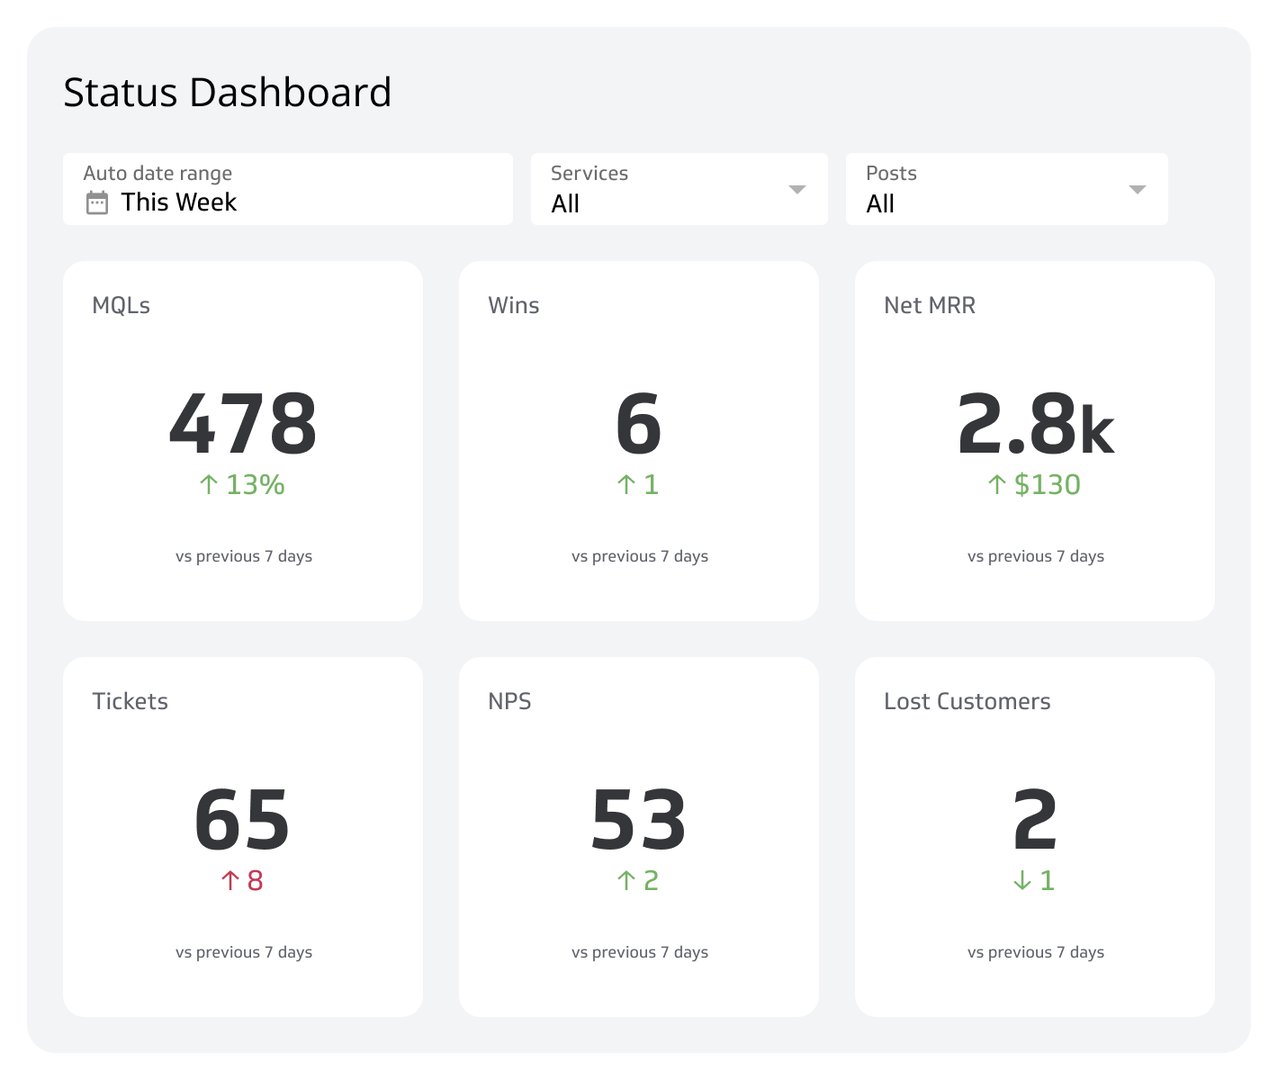
Status Dashboard
A clear guide to tracking your team's most important metrics in one place.
- Business
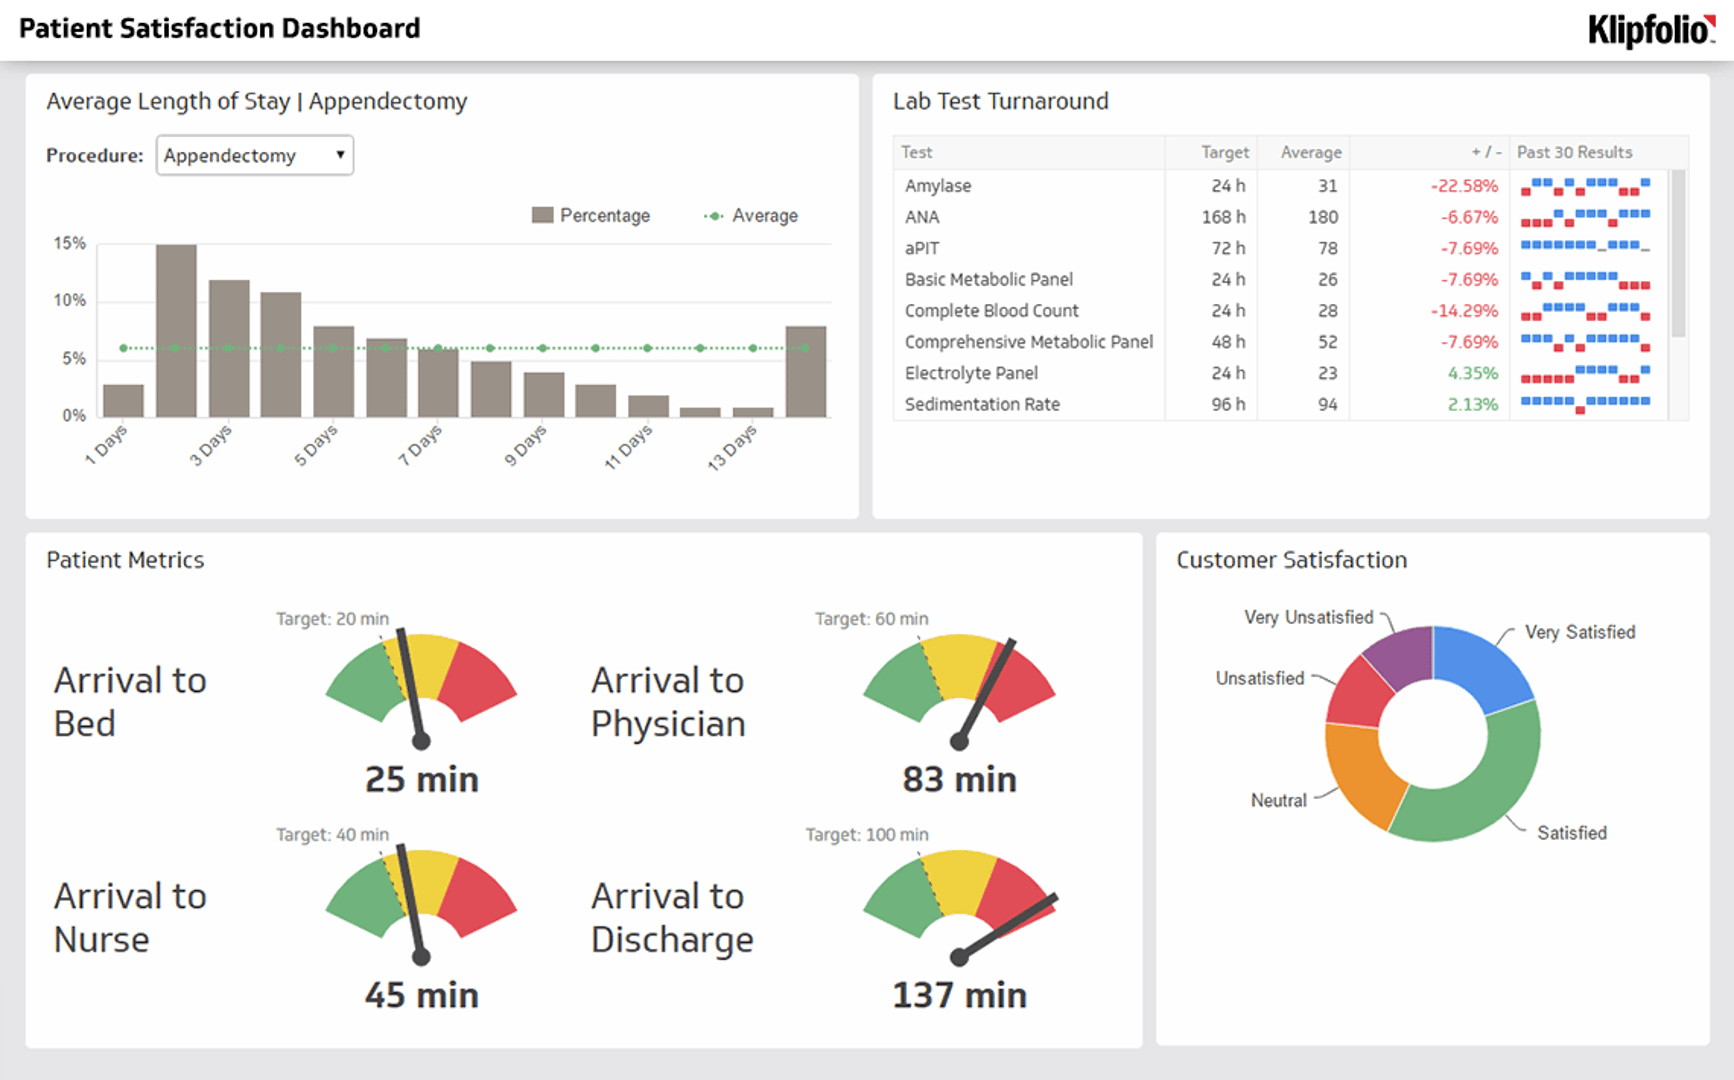
Patient Satisfaction Dashboard
Monitor the metrics that matter most to your patients.
- Business
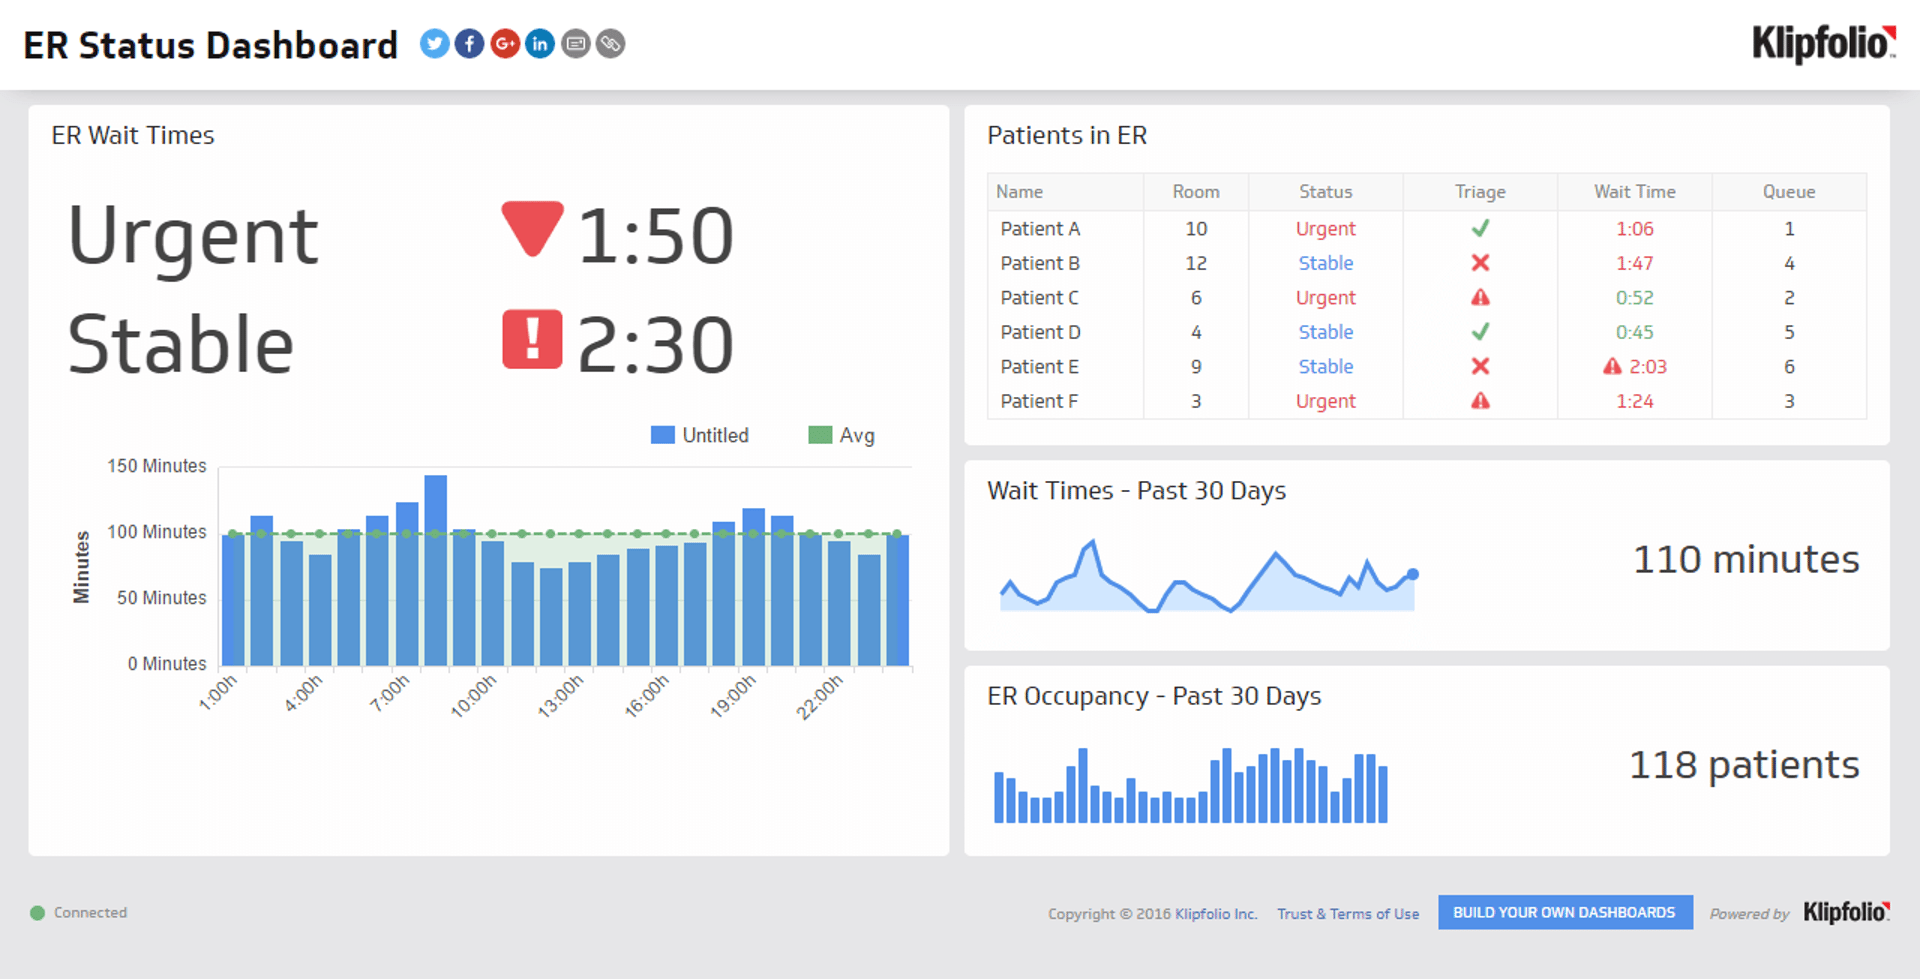
ER Status Dashboard
Track key emergency room metrics to improve patient flow and resource management.
- Business
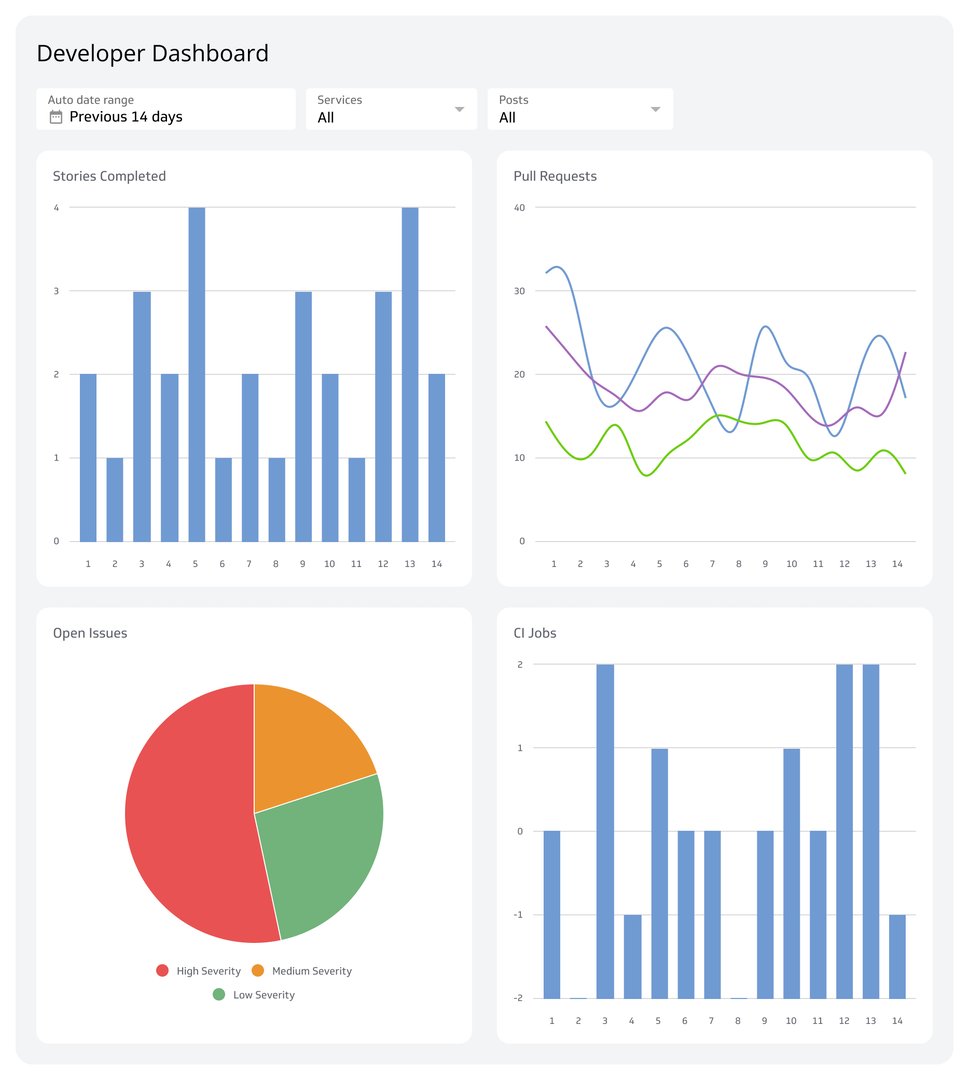
Software Development Dashboard
Track sprint progress, code quality, and release velocity in one place.
- Business
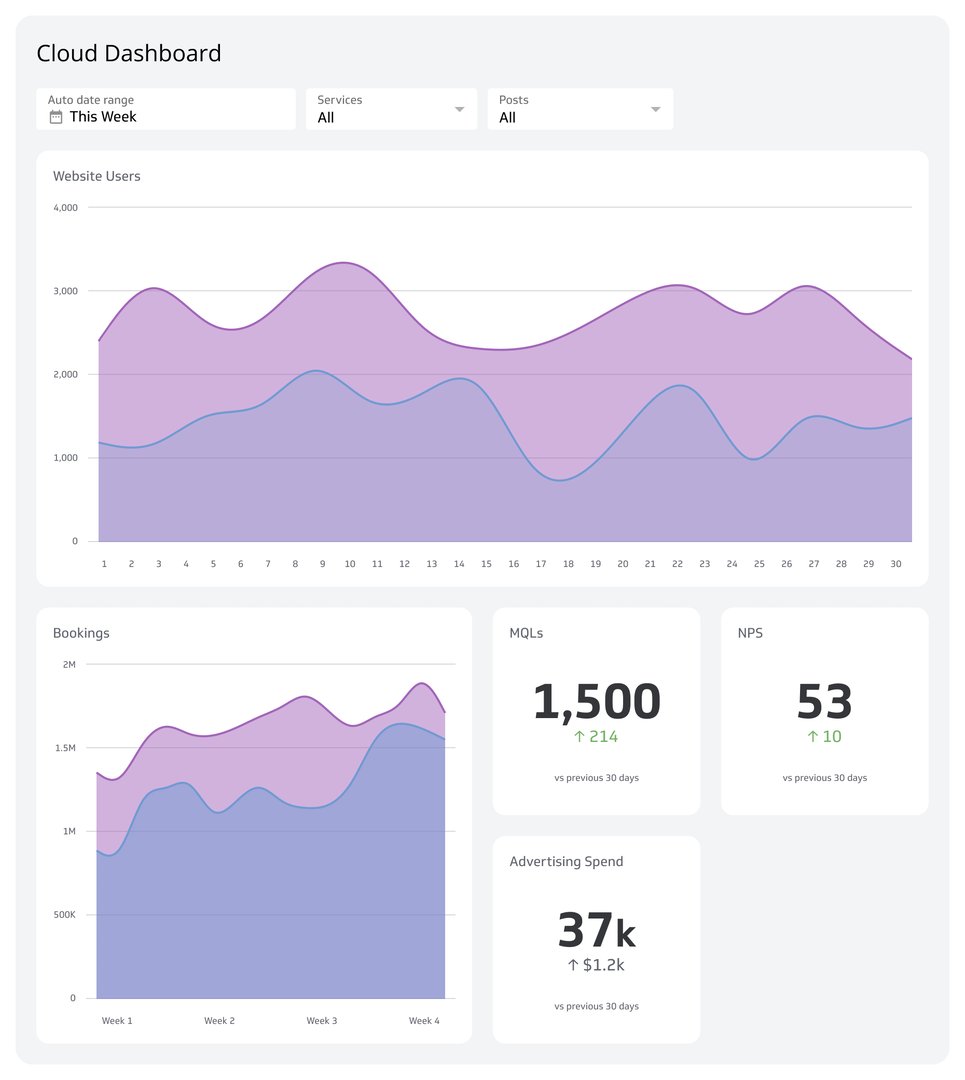
Cloud Dashboard
Access your most important business metrics from anywhere, on any device.
- Business
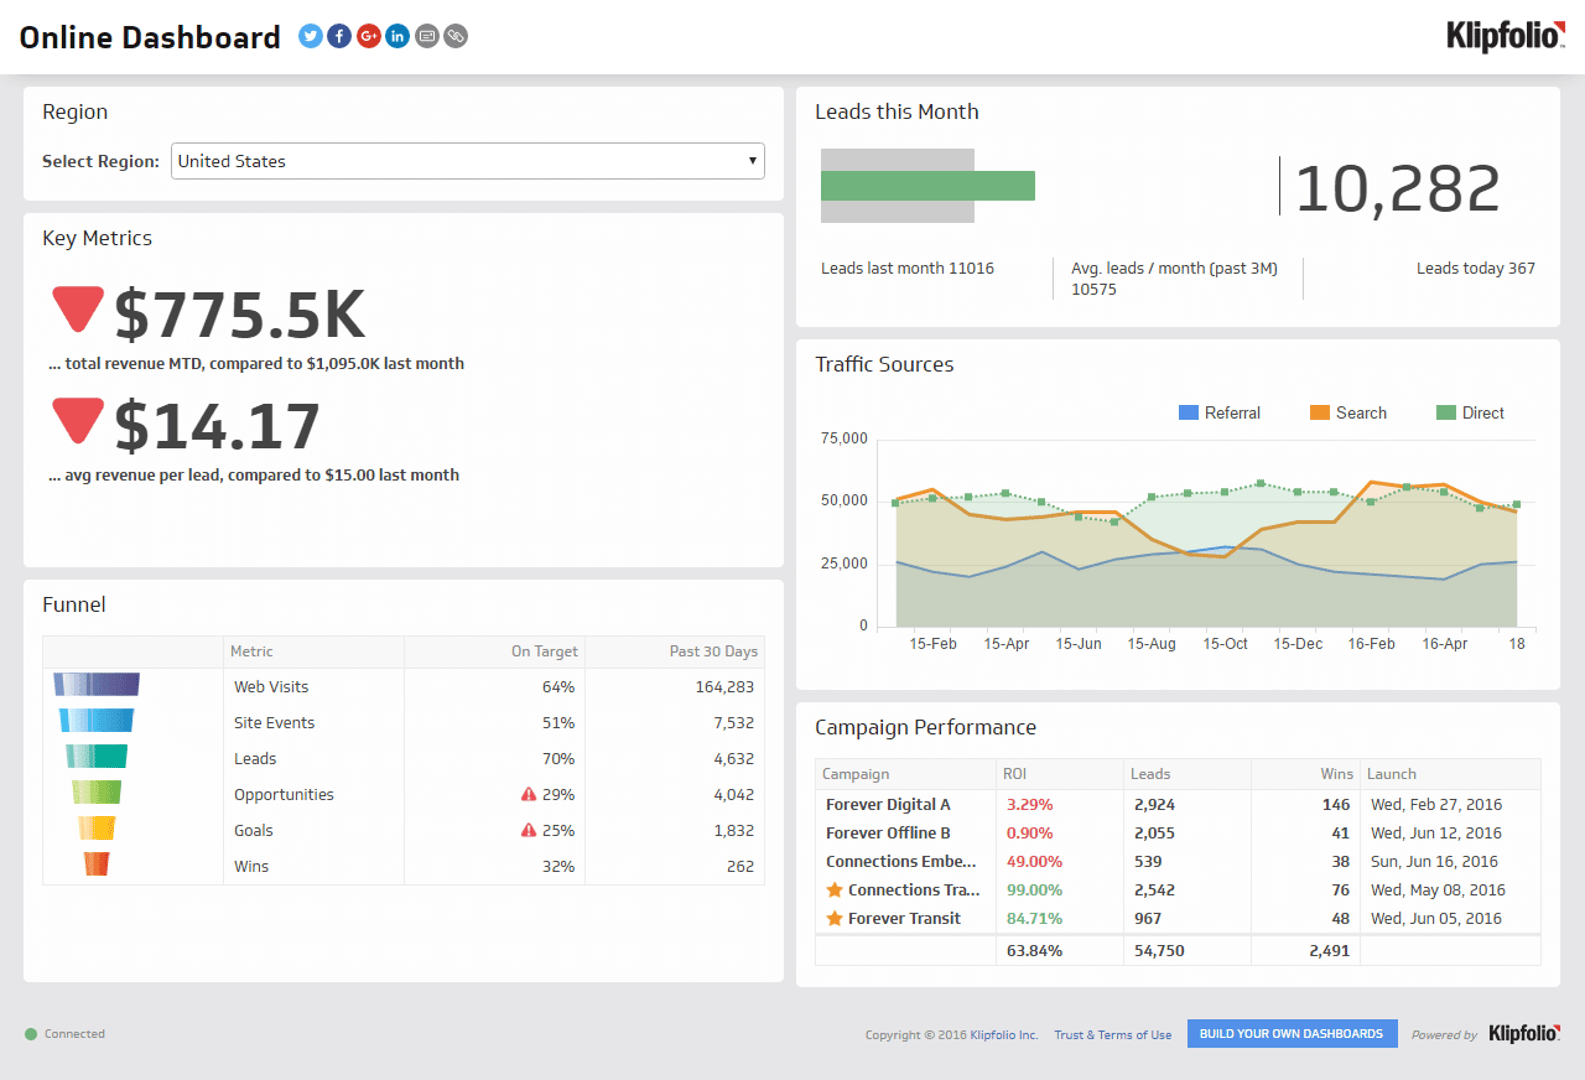
Online Dashboard
Go beyond spreadsheets. See all your data in one place.
- Business
Business Intelligence Dashboard
A business intelligence dashboard is a system designed to track crucial information for your business.
- Business
Digital Dashboard
Your all-in-one command center for business performance.
- Business
Customer Service Dashboard
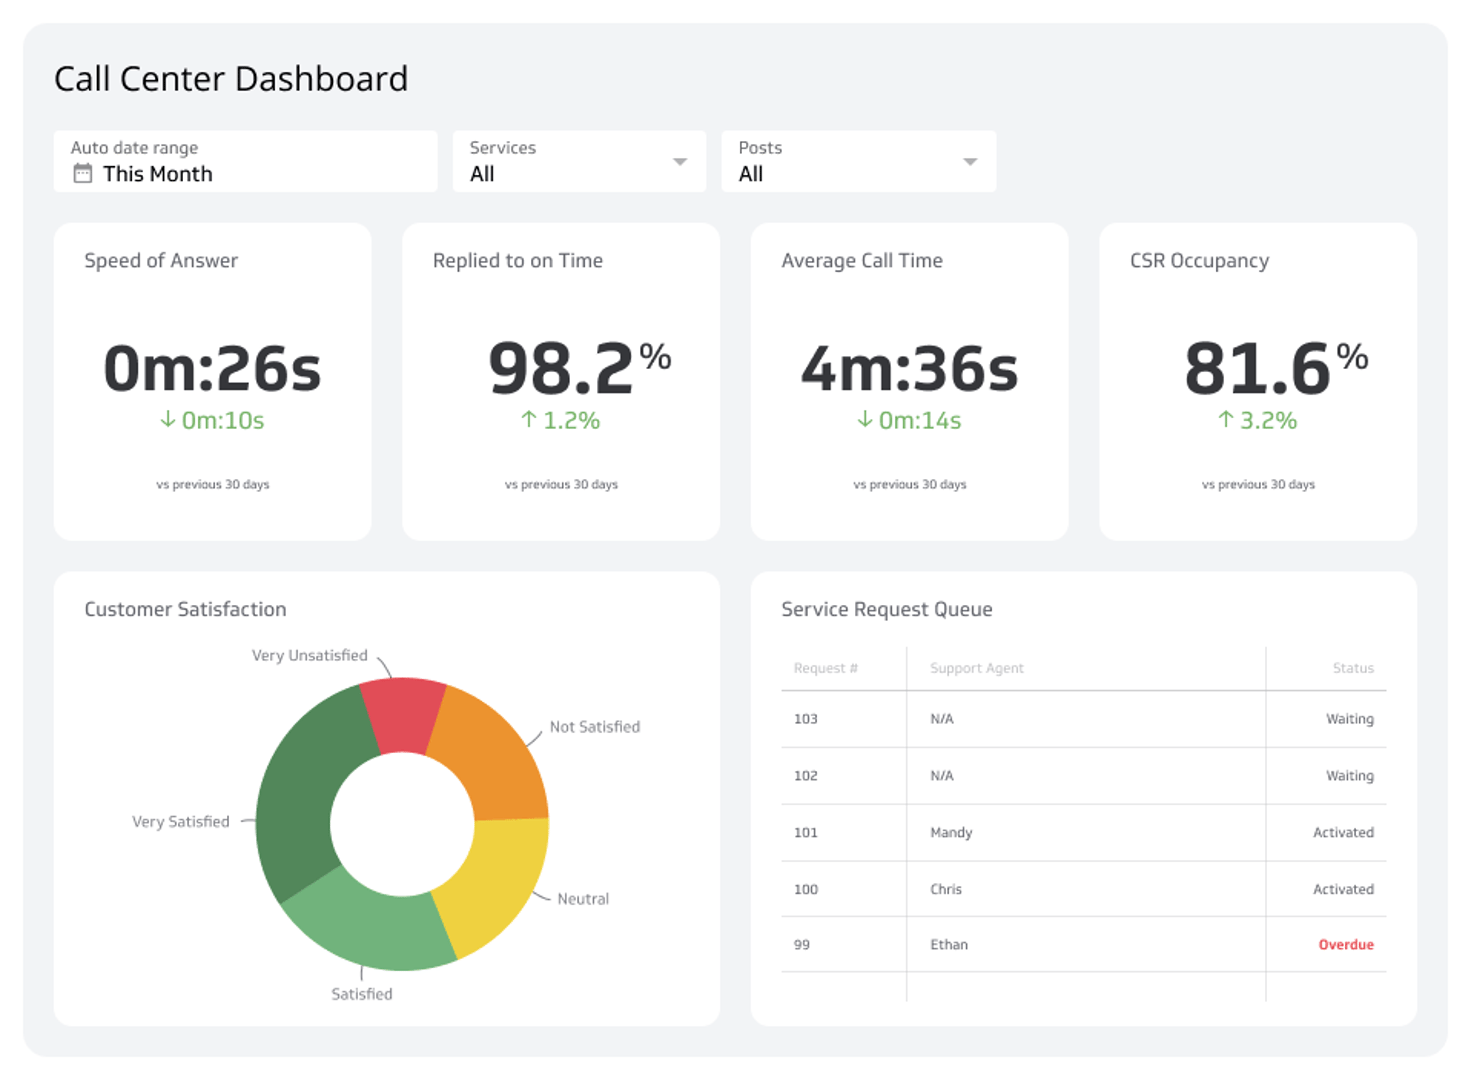
Customer service dashboards turn raw data into insights. Offering live visibility across channels like phone, email, and chat helps managers quickly spot and fix service issues.
- Business
Operations Dashboard
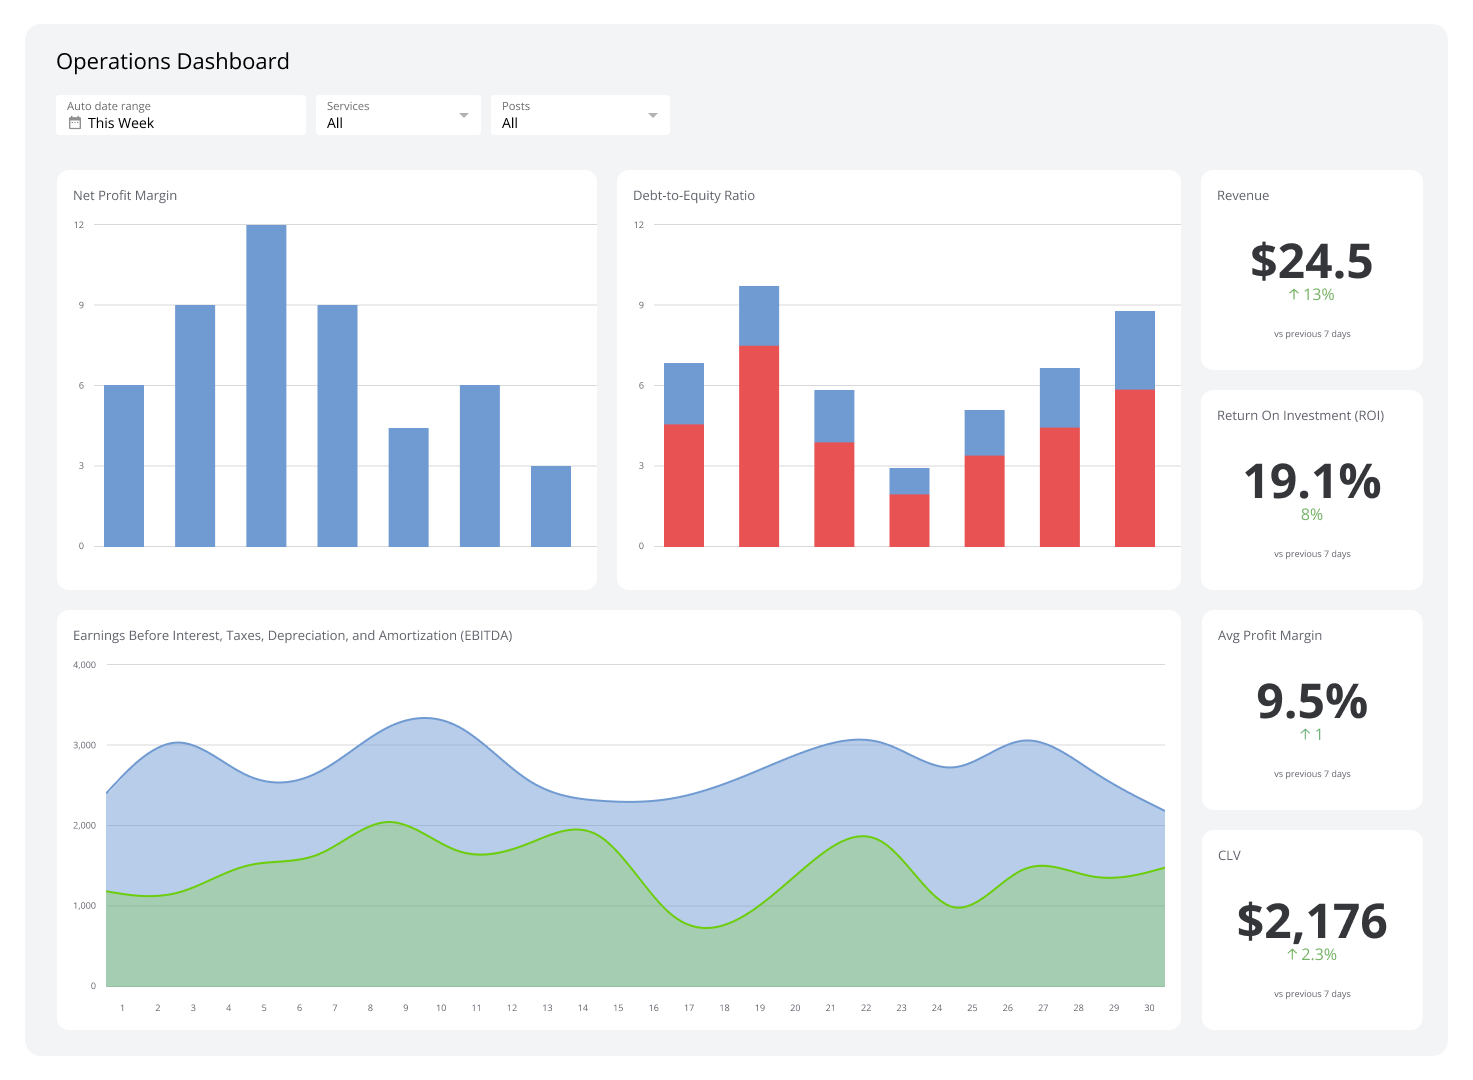
Track performance across teams with live, role-specific operations KPIs.
- Business
Professional Services Dashboard
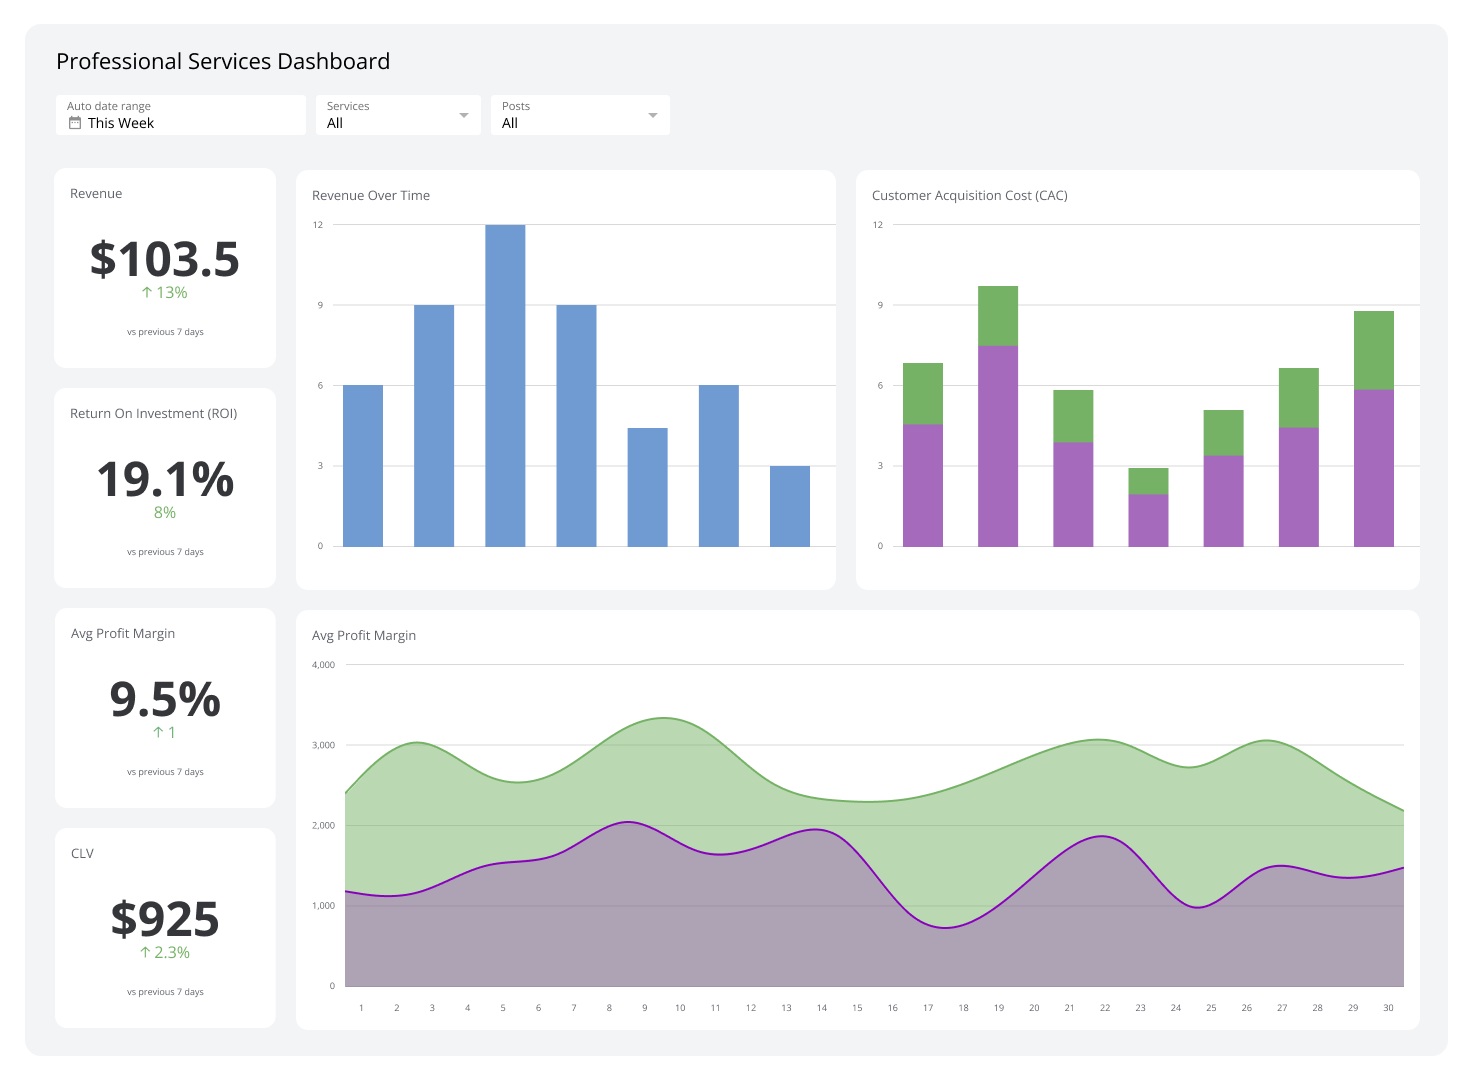
A professional services dashboard displays metrics and KPIs relevant to service-based businesses, such as consultancies and agencies.
- Business
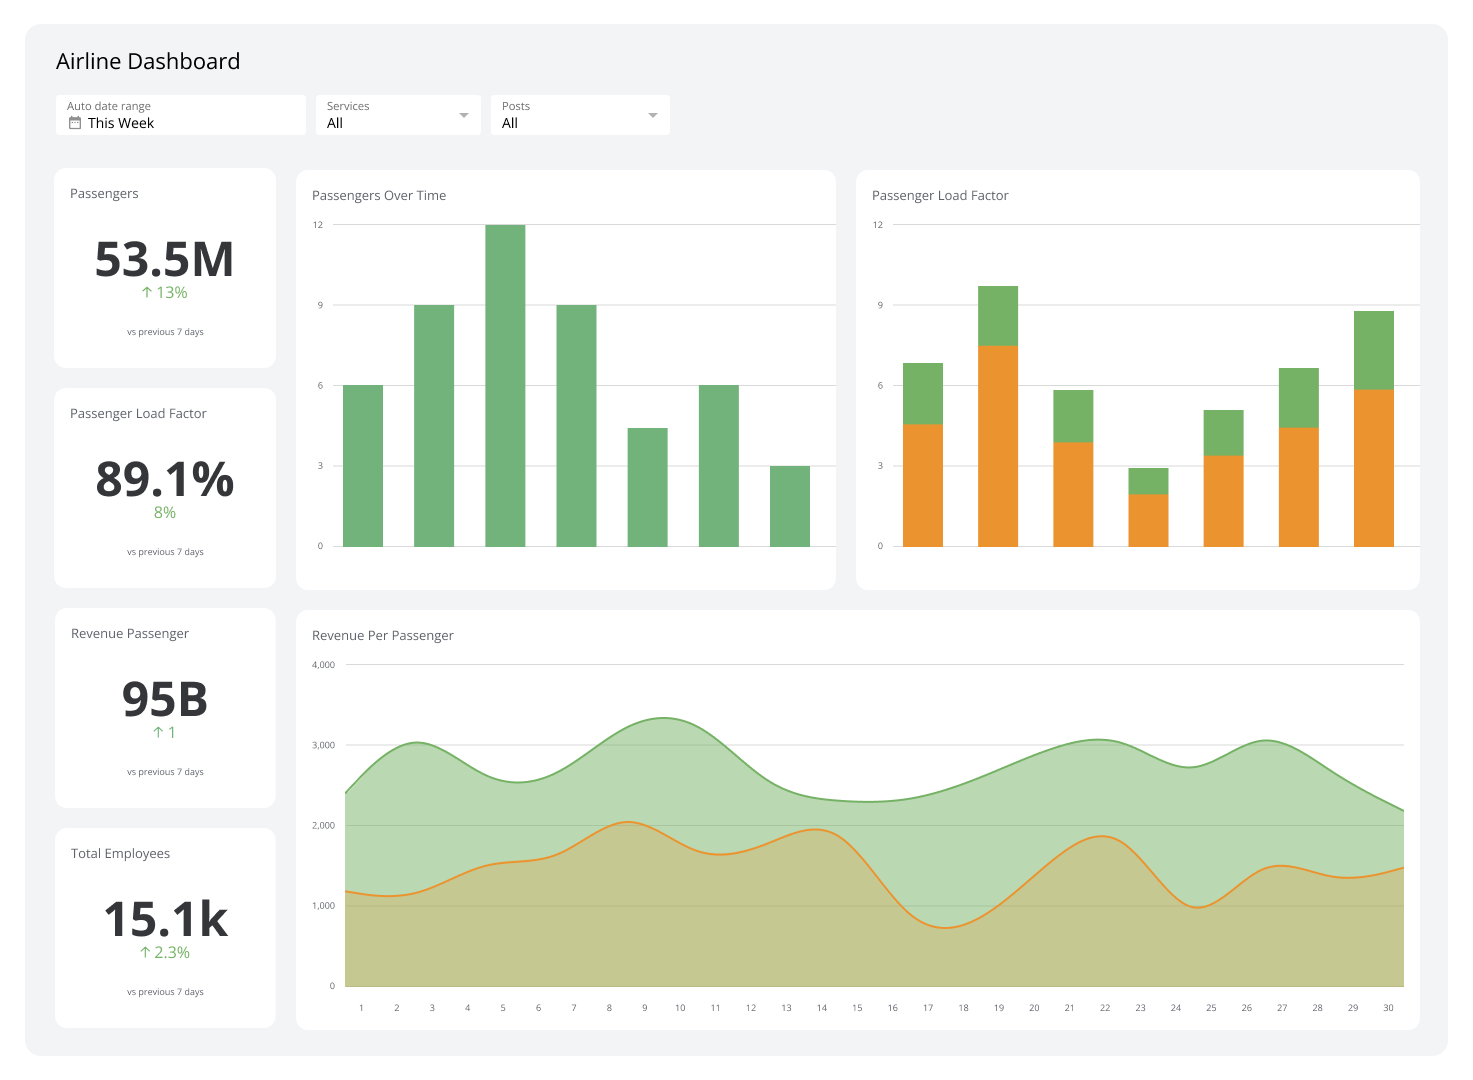
Airline Dashboard
Monitor flights, crews, and passengers in real time to improve on-time performance.
- Business
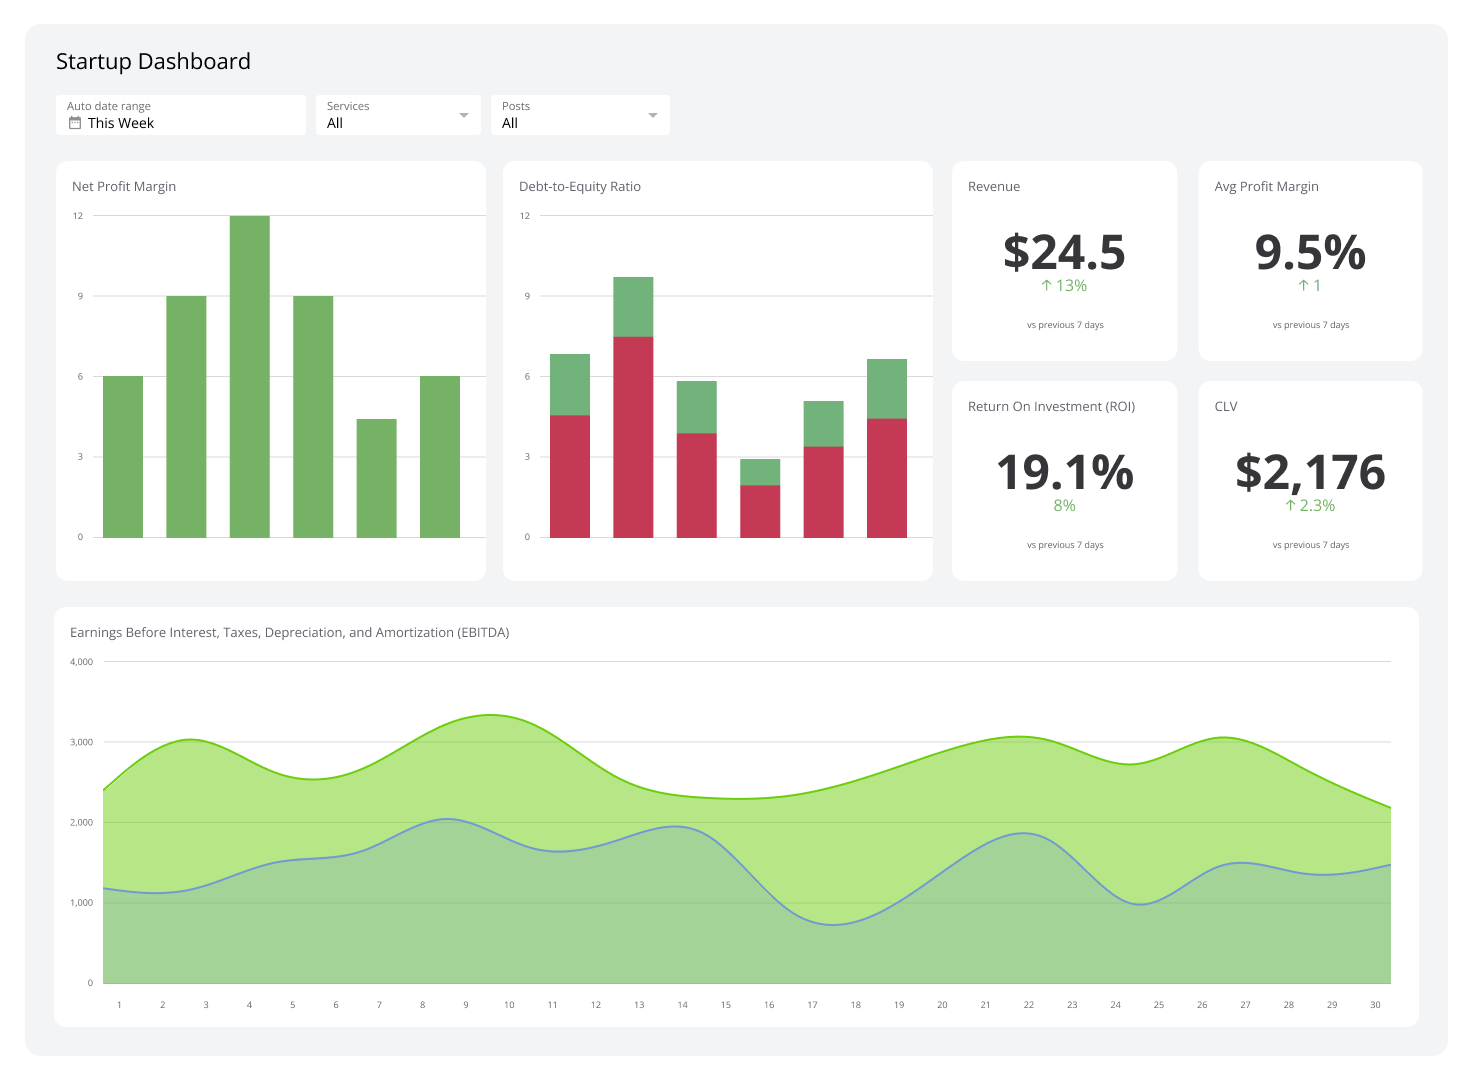
Startup Dashboard
Track growth, revenue, and runway KPIs in one clear view.
- Business
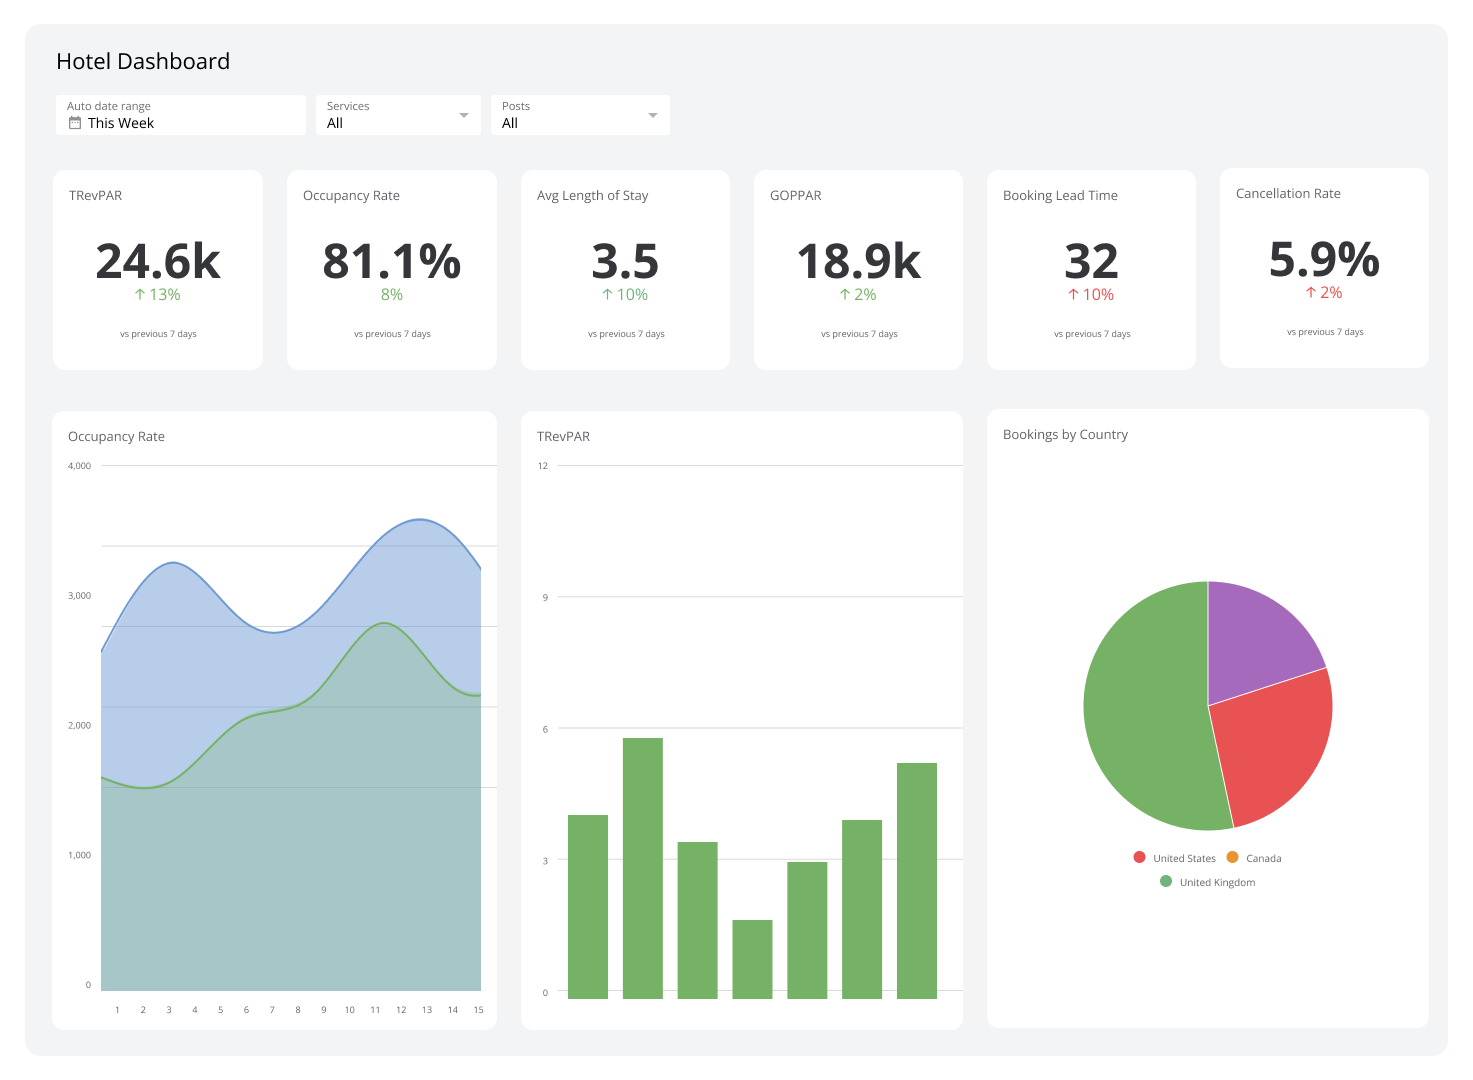
Hotel Dashboard
Track occupancy, ADR, and RevPAR to grow revenue and guest loyalty.
- Business
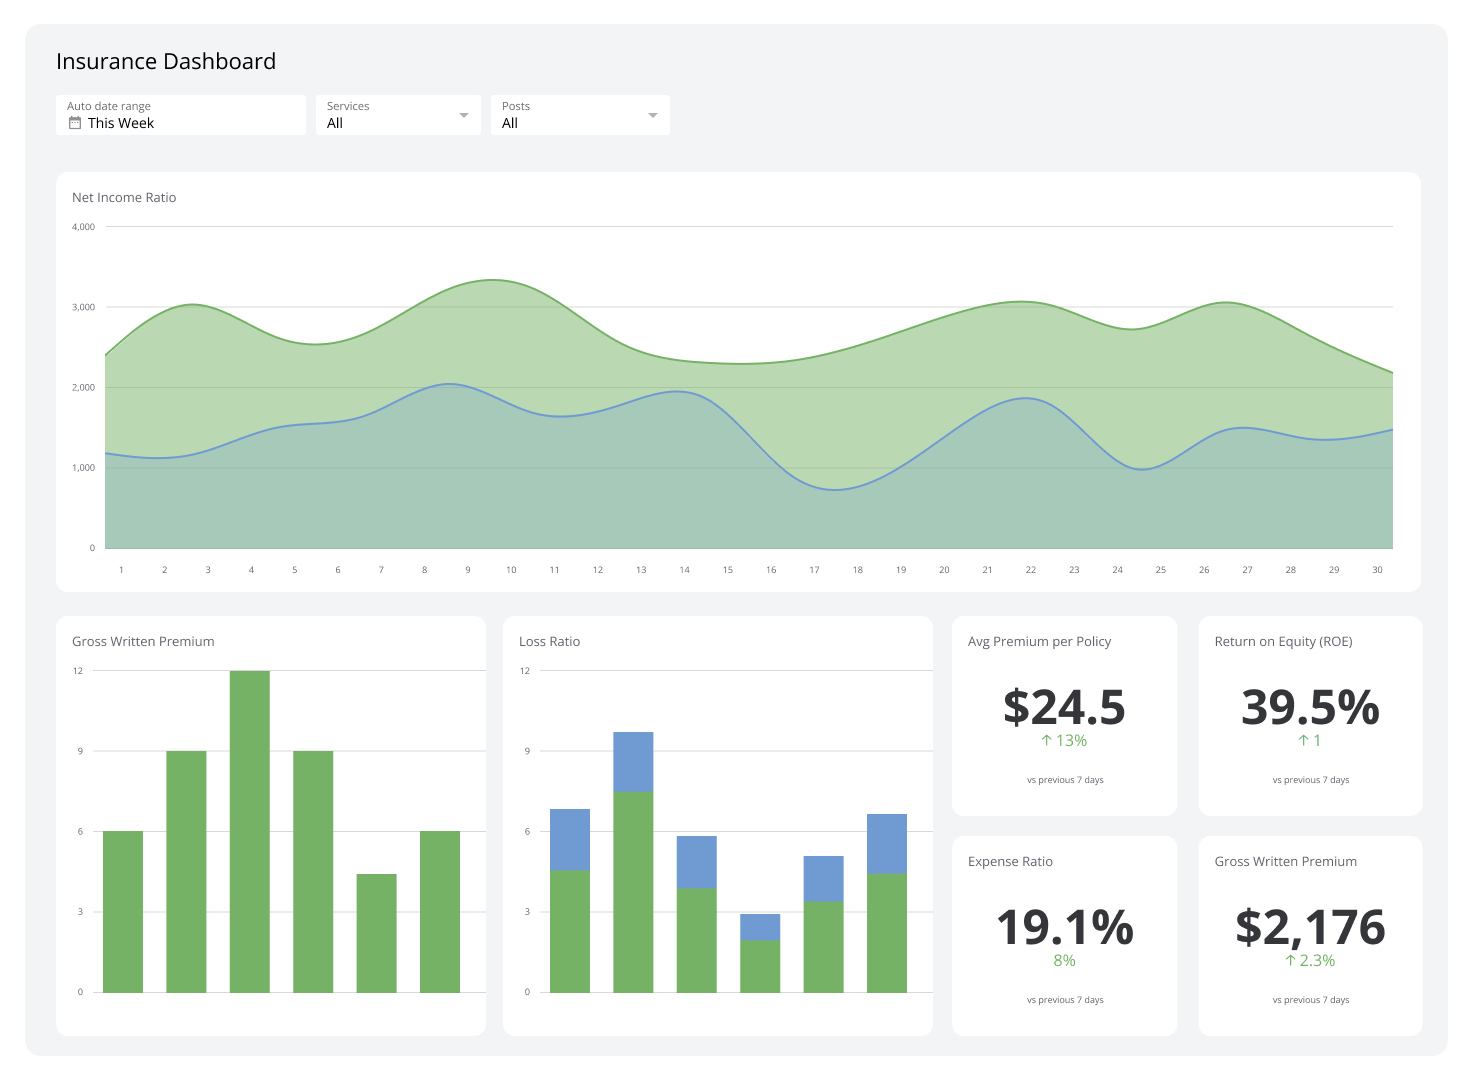
Insurance Dashboard
Track claims, premiums, and risk to run a healthier insurance business.
- Business
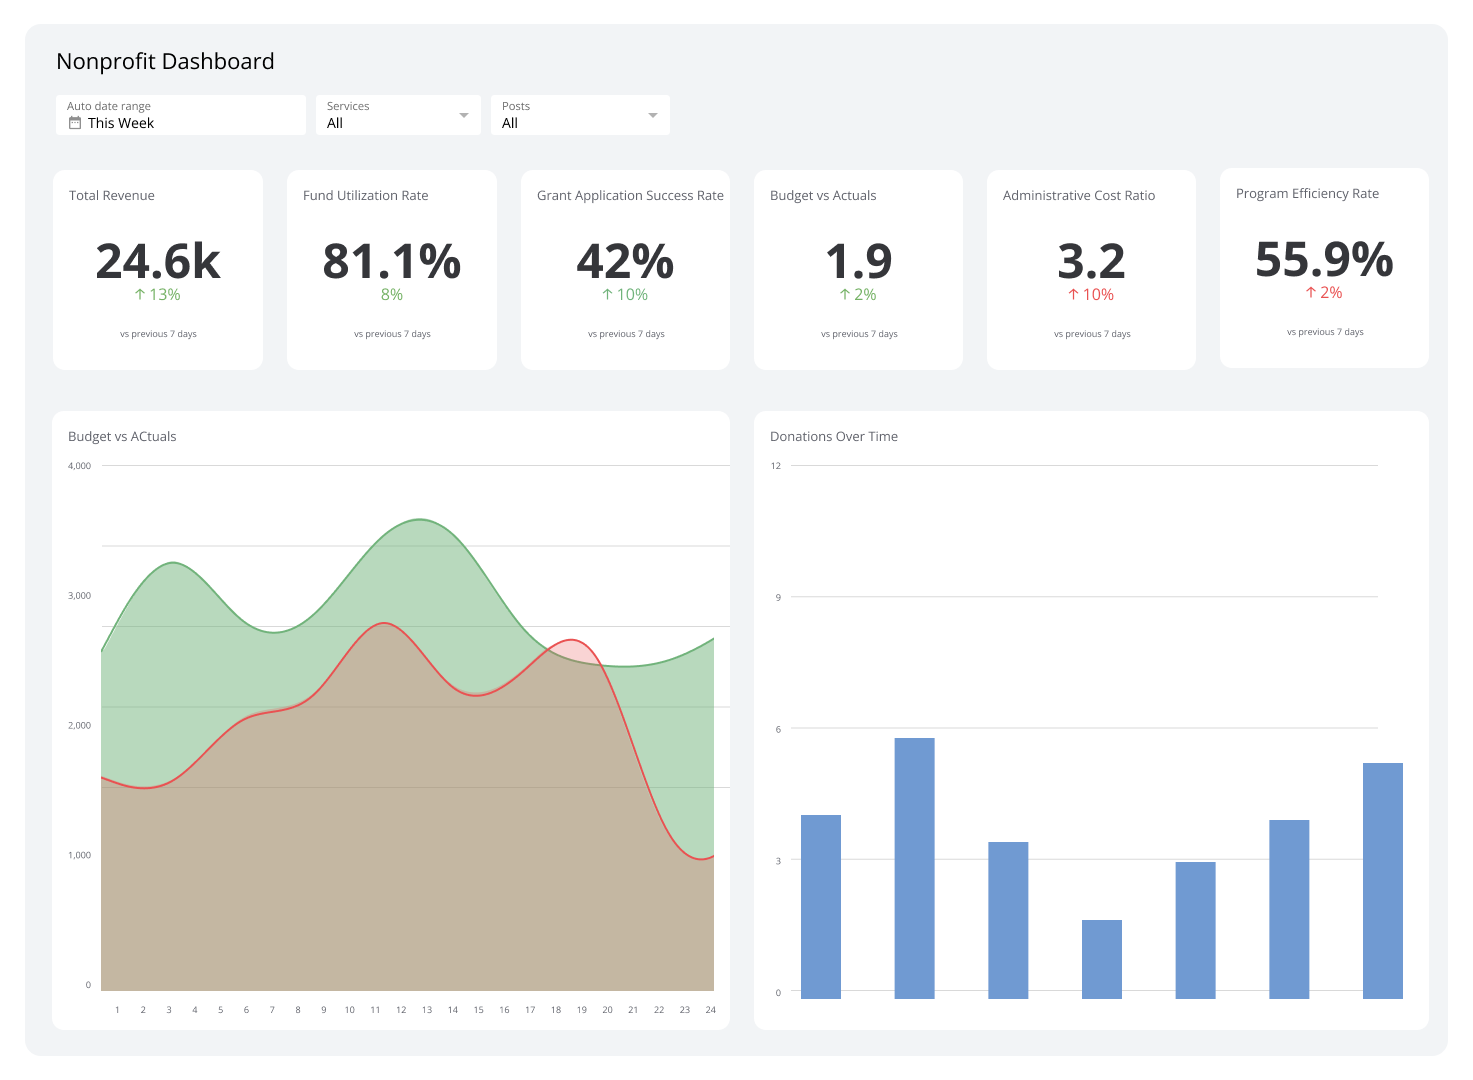
Nonprofit Dashboard
Track funding, donors, programs, and impact in one live view.
Why business dashboards matter
The goal isn't a prettier report. The goal is knowing what's happening in your business without having to ask, dig, or wait.
When your numbers are centralized and current, a few things change:
You stop chasing data. No more pasting figures into a spreadsheet or asking someone to pull a number. The information is already there.
You catch problems earlier. A dip in conversion, a spike in costs, a missed target: you see it when it happens, not at the end of the month.
Your whole team works from the same numbers. Misalignment often comes from people referencing different versions of the same metric. A shared dashboard removes that friction.
You make faster calls with more confidence. When you trust the numbers in front of you, decisions take minutes, not meetings.
What a business dashboard tracks
A business dashboard can consolidate data from almost any source: your CRM, accounting software, marketing platforms, cloud storage, or custom databases. What you track depends on your role and what you're accountable for.
Common examples include:
Revenue and sales performance: Total revenue, deals closed, pipeline value, and average deal size.
Marketing metrics: Traffic, lead volume, cost per acquisition, and campaign performance.
Operational metrics: Project status, team capacity, delivery timelines, and support volume.
Financial health: Cash flow, gross margin, burn rate, and expenses versus budget.
The most useful dashboards don't show everything. They show the metrics that tell you whether things are on track and what to do when they're not.
How business dashboards work in practice
A good business dashboard isn't something you have to go looking for answers in. It surfaces what matters and keeps you informed without requiring you to run reports or configure queries.
Here's what that looks like day to day:
- Data connects automatically. Your dashboard pulls from your connected sources on a scheduled refresh, anywhere from every minute to once a day, so the numbers stay current without manual updates.
- Metrics display in context. Rather than a raw number, you see a trend, a comparison to a target, or a change over time. That context is what turns a data point into a decision.
- The right people see the right view. Dashboards can be shared across a team, embedded in a client portal, sent as a scheduled PDF, or displayed on a screen in your office. Everyone stays aligned without extra effort from you.
What makes a business dashboard useful
Not all dashboards deliver on their promise. The ones that do tend to share a few qualities:
Reliable data. The numbers match what's in your source systems, every time. Inconsistency is what erodes trust and sends people back to spreadsheets.
Clarity over complexity. A dashboard that shows 40 metrics shows nothing. The best ones are edited down to what actually drives decisions.
Consistent definitions. Revenue means the same thing to sales, finance, and the CEO. When metrics are defined centrally, you stop arguing about the numbers and start acting on them.
Built for the reader, not the analyst. A useful dashboard hands you an answer, not a tool to operate.
Business dashboard examples
Different teams and industries use dashboards differently. A few common configurations:
Executive dashboard: A high-level view of revenue, growth, margins, and team performance. Built for a founder or senior leader who needs the full picture in under a minute.
Sales dashboard: Pipeline health, quota attainment, activity by rep, and deal velocity. Helps sales leaders spot where deals are stalling and where to focus coaching.
Marketing dashboard: Channel performance, lead quality, campaign ROI, and cost per acquisition. Connects marketing spend to business outcomes.
Financial dashboard: Cash position, burn rate, expenses by category, and actuals versus forecast. Keeps finance and leadership aligned on where the business stands.
Operations dashboard: Project timelines, resource allocation, support ticket volume, and delivery performance. Useful for any team managing capacity and output.
Create custom dashboards for you and your team.
Get started with KlipsGetting started with a business dashboard
The fastest way to get value from a business dashboard is to start narrow. Pick the five to ten metrics that most directly reflect whether your business is healthy, connect the sources that hold that data, and build from there.
Klips connects to 130+ data sources, including your CRM, marketing tools, accounting software, and databases. You can use pre-built templates to get up and running quickly, or customize with Excel-like formulas and flexible layouts if your reporting needs are specific.
The result is a dashboard your whole team can trust, distributed the way that works for your business, whether that's a shared screen, a scheduled email, or a client-facing embed.