

5 SaaS subscription metrics for financial reporting
Stripe shows you what happened with your revenue. It doesn't show you what's coming, where things are slipping, or how confident you should feel about the number on the screen. These five Stripe subscription metrics, tracked in a Klips dashboard, give you the depth you need for accurate financial reporting: charges, payment acceptance, failed charges, disputed charges, and payouts.

Revenue is the one number every business tracks, whether you're a five-person startup or a scaling firm with hundreds of employees.
Most teams pull that number from Stripe, and Stripe does a solid job of showing you what happened. What it doesn't do well is help you understand what's coming, where things are slipping, or how confident you should feel about the number on the screen. For that, you need to track the right SaaS subscription metrics and see them in one place.
Here are five Stripe subscription metrics worth adding to a dashboard for financial reporting.
Why Stripe alone isn't enough for financial reporting
Stripe gives you record-level detail or a high-level summary. There's not much in between, and there's no easy way to combine your Stripe data with the other numbers that affect your financial picture, like ad spend, pipeline, or churn.
A Klips dashboard pulls your Stripe instant metrics into a single view so you can track revenue with the depth you actually need. You can segment by country, card type, or product. You can spot trends before they become problems. And you can share a consistent, reliable picture of your finances with anyone on your team without anyone having to pull a number manually.
Segment and filter your Stripe data
Revenue forecasting means knowing your cash flow today, next week, and at month or quarter end. The metrics below let you break down your payments to see fees, refunds, cash-in, and failed charges so you can recognize patterns early and report with confidence.
The top 5 Stripe metrics for financial reporting
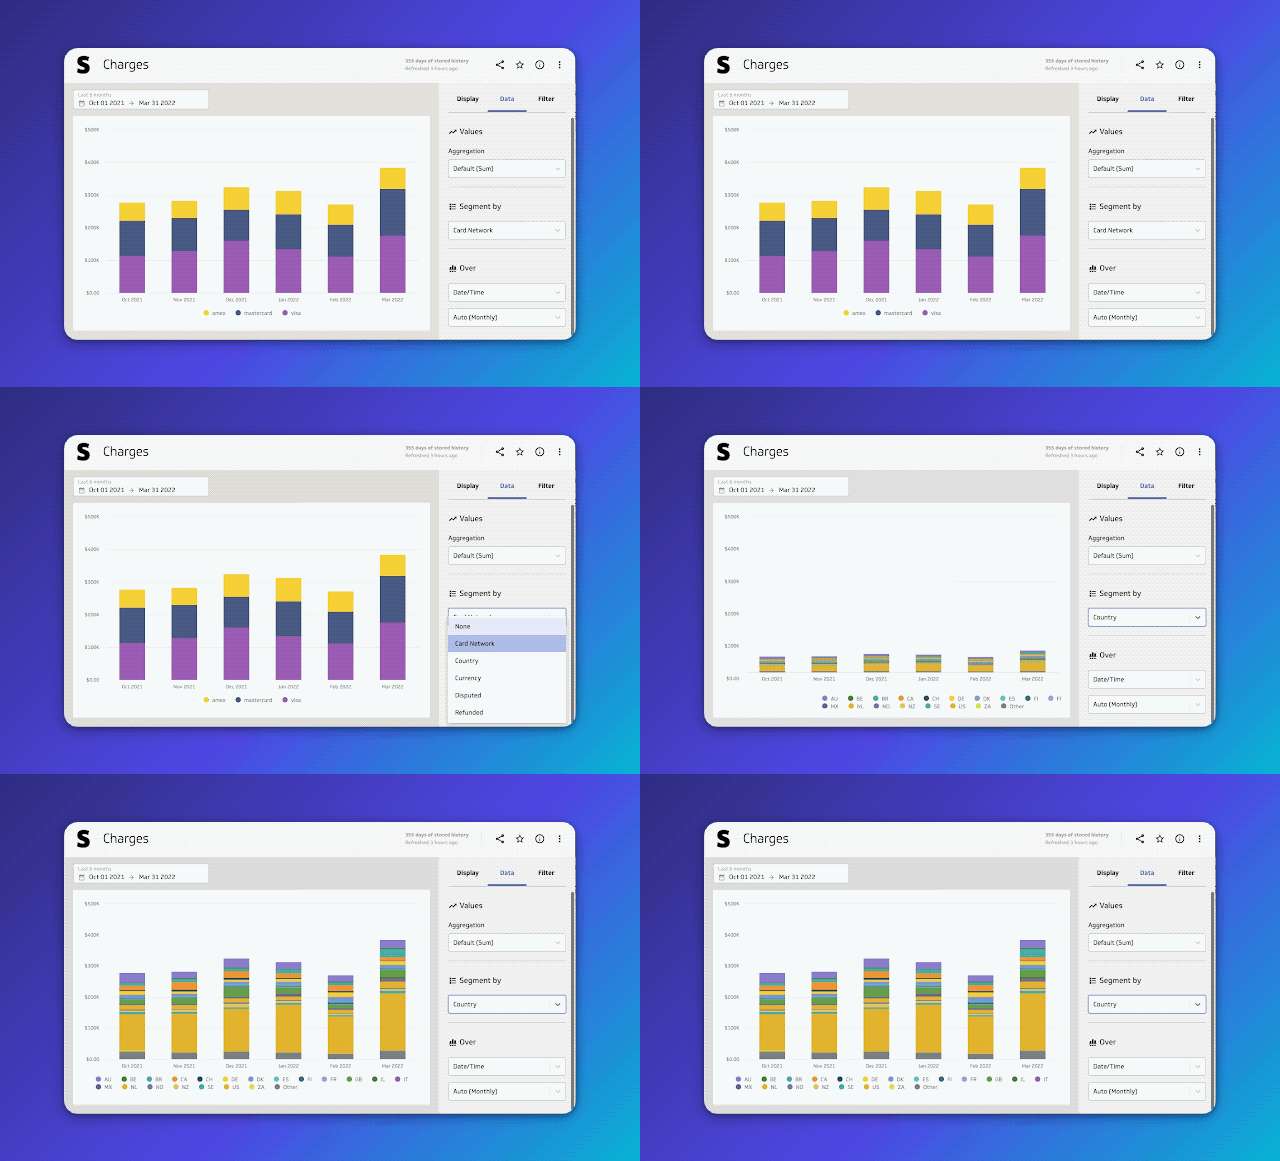
Charges
Charges is your total payment revenue after deducting fees, refunds, transfers, and disputes. It represents your gross volume in Stripe.
You can segment this metric by card type, country, currency, disputed status, or refunded status. That granularity matters for accurate financial reporting: you know not just how much came in, but where it came from and whether any of it is at risk.
Payment acceptance
Payment acceptance shows the percentage of successful payments out of all attempted payments. It tells you how reliably money is actually making it through when customers try to pay.
A dip in this number is a signal worth acting on quickly. You can break it down by card type or country to find where the friction is.
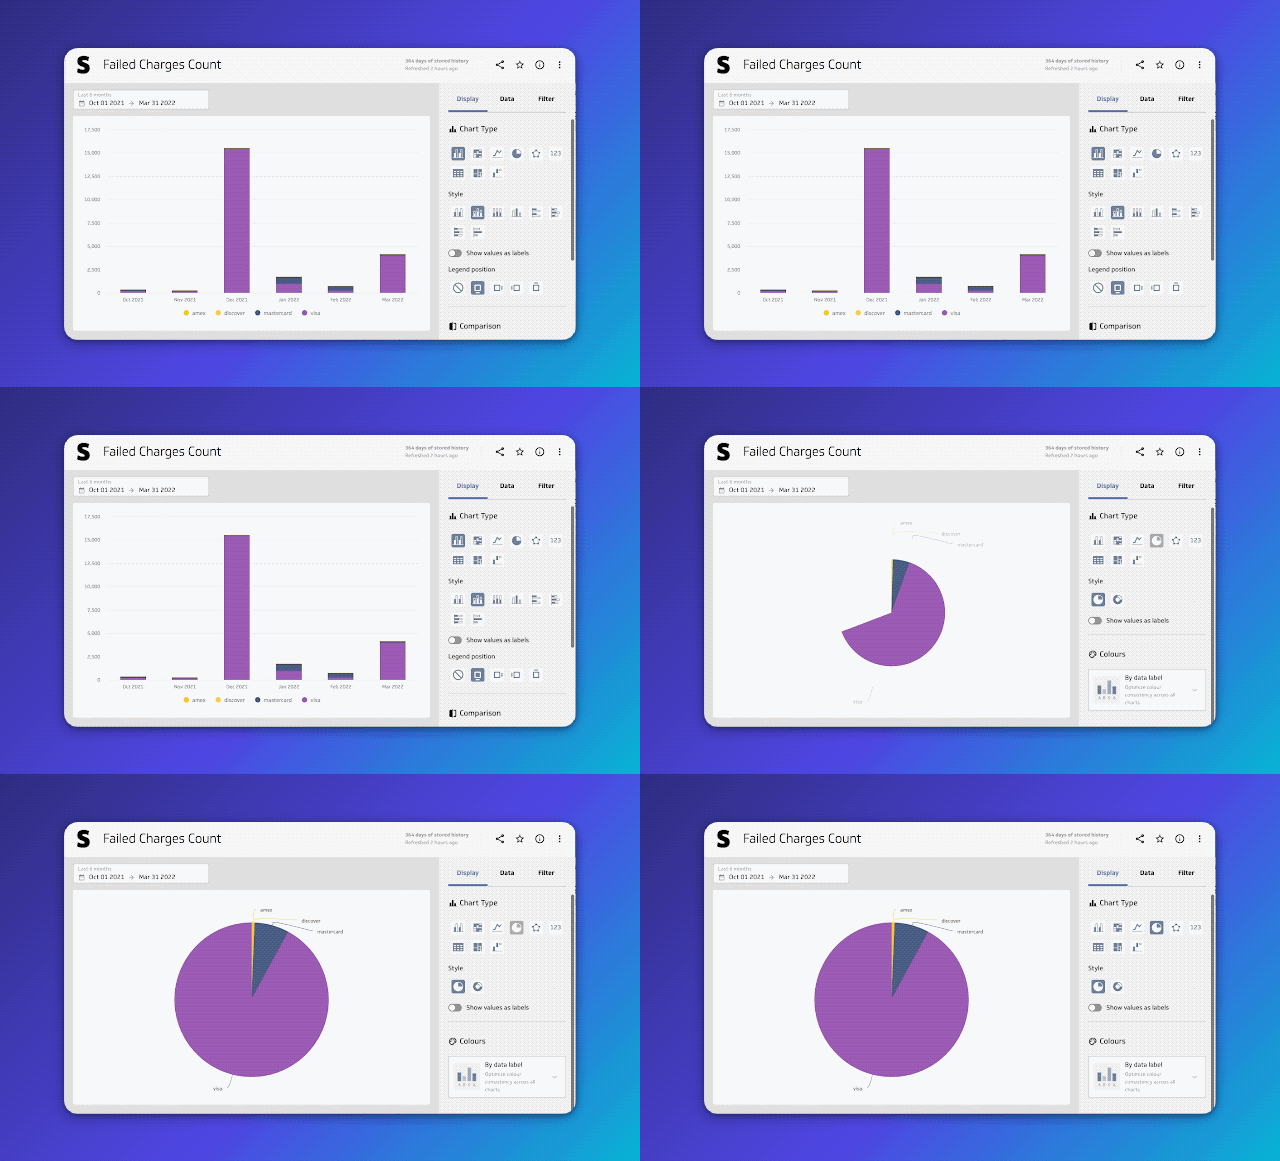
Failed charges
Failed charges shows the total monetary value of payments that did not go through. You can also view failed charges as a count if volume matters more than dollar value for your reporting.
Breaking this down by failure reason, card type, or currency helps you separate fraud from card declines from technical errors. Each has a different fix, and knowing which you're dealing with saves time.
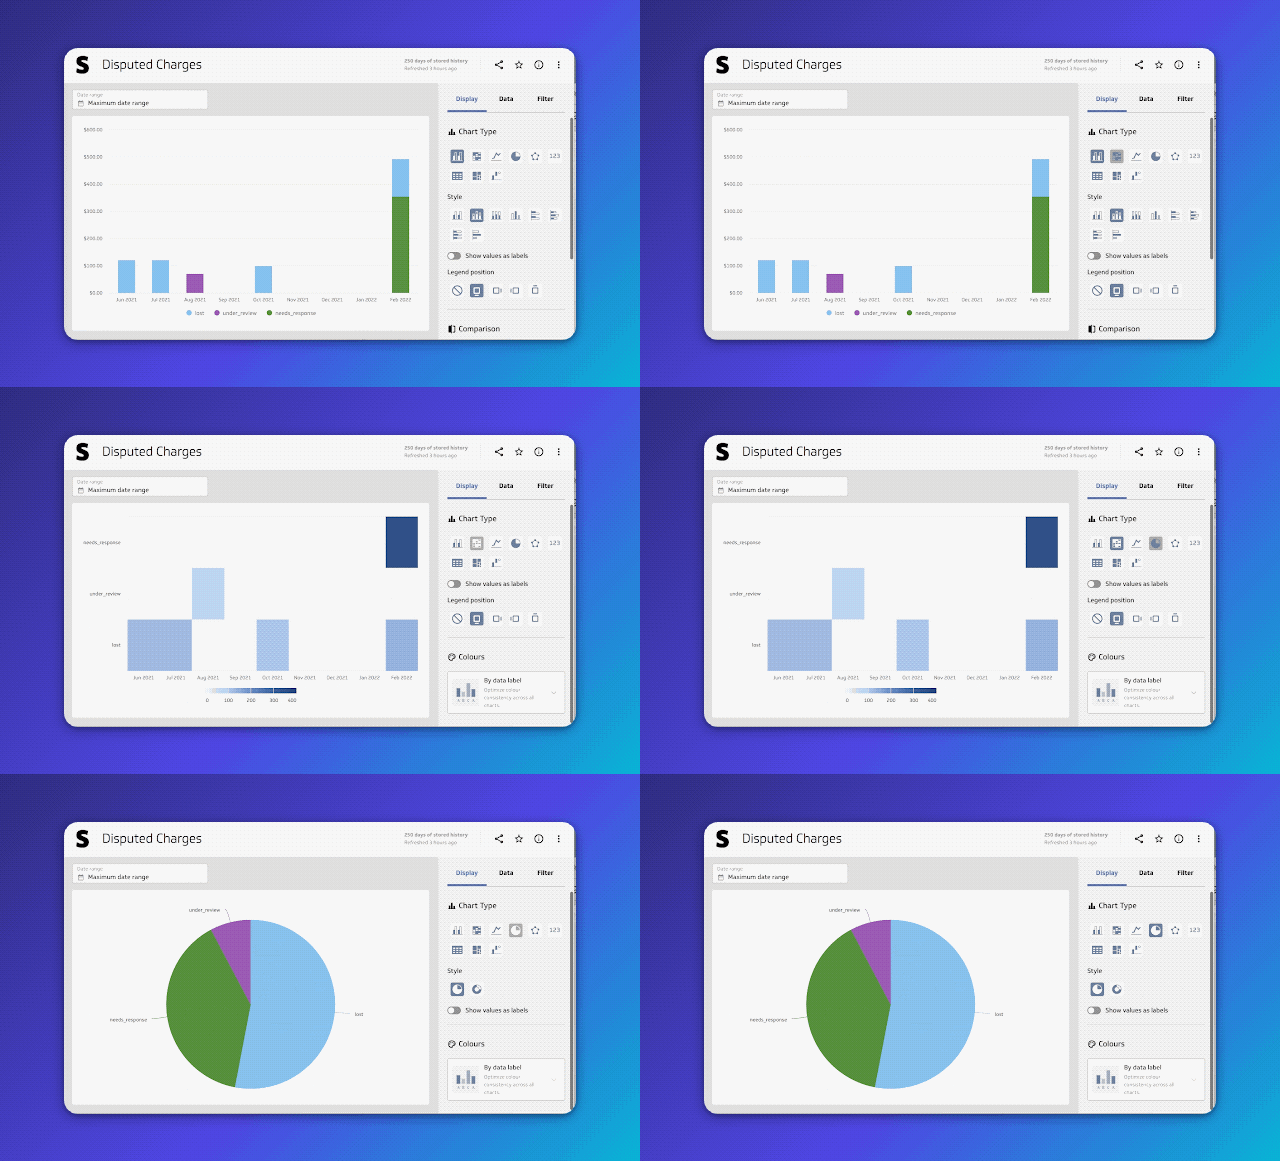
Disputed charges
Disputed charges is the total value of charges that have been challenged or reversed. These represent money that could be deducted from your net charges, so they belong in any honest picture of your revenue.
A spike in disputed charges is worth cross-referencing with your customer success team. If it lines up with a surge in support tickets, you have a lead on the underlying issue.
Payouts
Payouts is the amount Stripe transfers to your bank account after payments, fees, and adjustments have been settled. It is not your MRR and it is not your gross revenue. It is the cash you actually have.
That makes it the most grounded metric for cash flow forecasting. Knowing your payout schedule and tracking against it tells you what you can spend and when.
Create custom dashboards for you and your team.
Get started with KlipsBuild a financial dashboard that keeps you informed
These five metrics give you a reliable, consistent view of your Stripe revenue without having to dig through raw exports or paste numbers into a spreadsheet every week. When the data is already organized and updated on a schedule, you spend less time pulling reports and more time acting on what they show.
Klips connects to 130+ data sources, so you can bring your Stripe metrics together with your marketing spend, sales pipeline, or any other number that affects your financial picture. Try building your first financial reporting dashboard and see what becomes visible when everything is in one place.
Published 2026-08-21
More in Dashboards

Beyond simple sign-ups: how True Trials and Activation predict growth

5 tips to understand (and organize) your restaurant data

6 dashboards I use daily to run my SaaS company

Business Metrics vs. KPIs: What’s the Difference?
What is a KPI, metric, or measure?

The Hidden Value of SaaS Sign Up Rate Benchmarks
Most recent
- AUG 11Beyond simple sign-ups: how True Trials and Activation predict growth
- JUL 7Why business leaders miss important trends in their dashboards
- JUN 19The best chart for the job: Visualizing data for non-technical users
- JUN 95 tips to understand (and organize) your restaurant data
- MAY 26Think in Horizons, Not Seconds
- MAY 2010 Cloud BI Dashboard Tools for Small Businesses in 2026