

The starter guide to metrics
Metrics are a forcing function for better decisions. They give everyone in your business a shared language, a common set of numbers, and a single source of truth to turn to when it matters. This guide covers what metrics are, how to use them, which ones to track by department, and where to track them.

In a business context, metrics are a forcing function for better decisions. They give everyone in your business a shared language, a common set of numbers, and a single source of truth to turn to when it matters.
This guide covers everything you need to get started: what metrics are, how to use them, which ones to track by department, and where to track them.
What are metrics?
A metric is a quantifiable measure used to track performance, progress, or outcomes over time.
Whether you're watching MRR trend upward or checking your move minutes on an Apple Watch, metrics are everywhere. In business, they tell you what's working, what isn't, and where to focus next.
Metrics are not one-size-fits-all in terms of which ones you track. A SaaS executive might focus on customer lifetime value (LTV); a marketing manager might care more about customer conversion rate or marketing qualified leads (MQLs). The right metrics depend on your role, your goals, and where you are in reaching them.
What's the difference between a metric and a KPI?
Metrics and KPIs are related but not the same. Here's how to tell them apart:
- Metrics measure performance across any area of your business, without necessarily having a target attached.
- KPIs are metrics with targets and timeframes. They signal whether you're on track and prompt action when you're not.
- All KPIs include a metric, but not every metric is a KPI.
Think of metrics as the raw material and KPIs as the decisions you build from them. For a deeper look, here's a great resource.
How do you use metrics?
Metrics turn raw data into something your whole team can act on. A number in a spreadsheet is just a number. A metric gives it context: what it measures, over what period, and what it means for the business.
To be useful across a team, metrics need to be standardized. If one metric covers a 30-day window, the next one should too. Consistent time periods make comparison possible and prevent the kind of confusion that comes from everyone working off slightly different numbers.
When metrics are shared and consumed across the business, they:
- Create a single source of truth so decisions aren't made on conflicting data.
- Build a data-driven culture where teams make informed calls instead of educated guesses.
- Replace the "can you pull that number?" workflow with answers that are always available, always current.
That last point matters more than it used to. Many leaders today try to get clarity by pasting numbers into a generic AI tool or asking a chatbot to interpret a screenshot. The problem is that those tools don't know your business. Standardized, connected metrics do.
How do I know which metrics to track?
Start with your business objectives and work backwards. Every team should track metrics tied to the outcomes they own, whether independently or at the department level.
Not sure where to start? Here are five metrics for each core department.
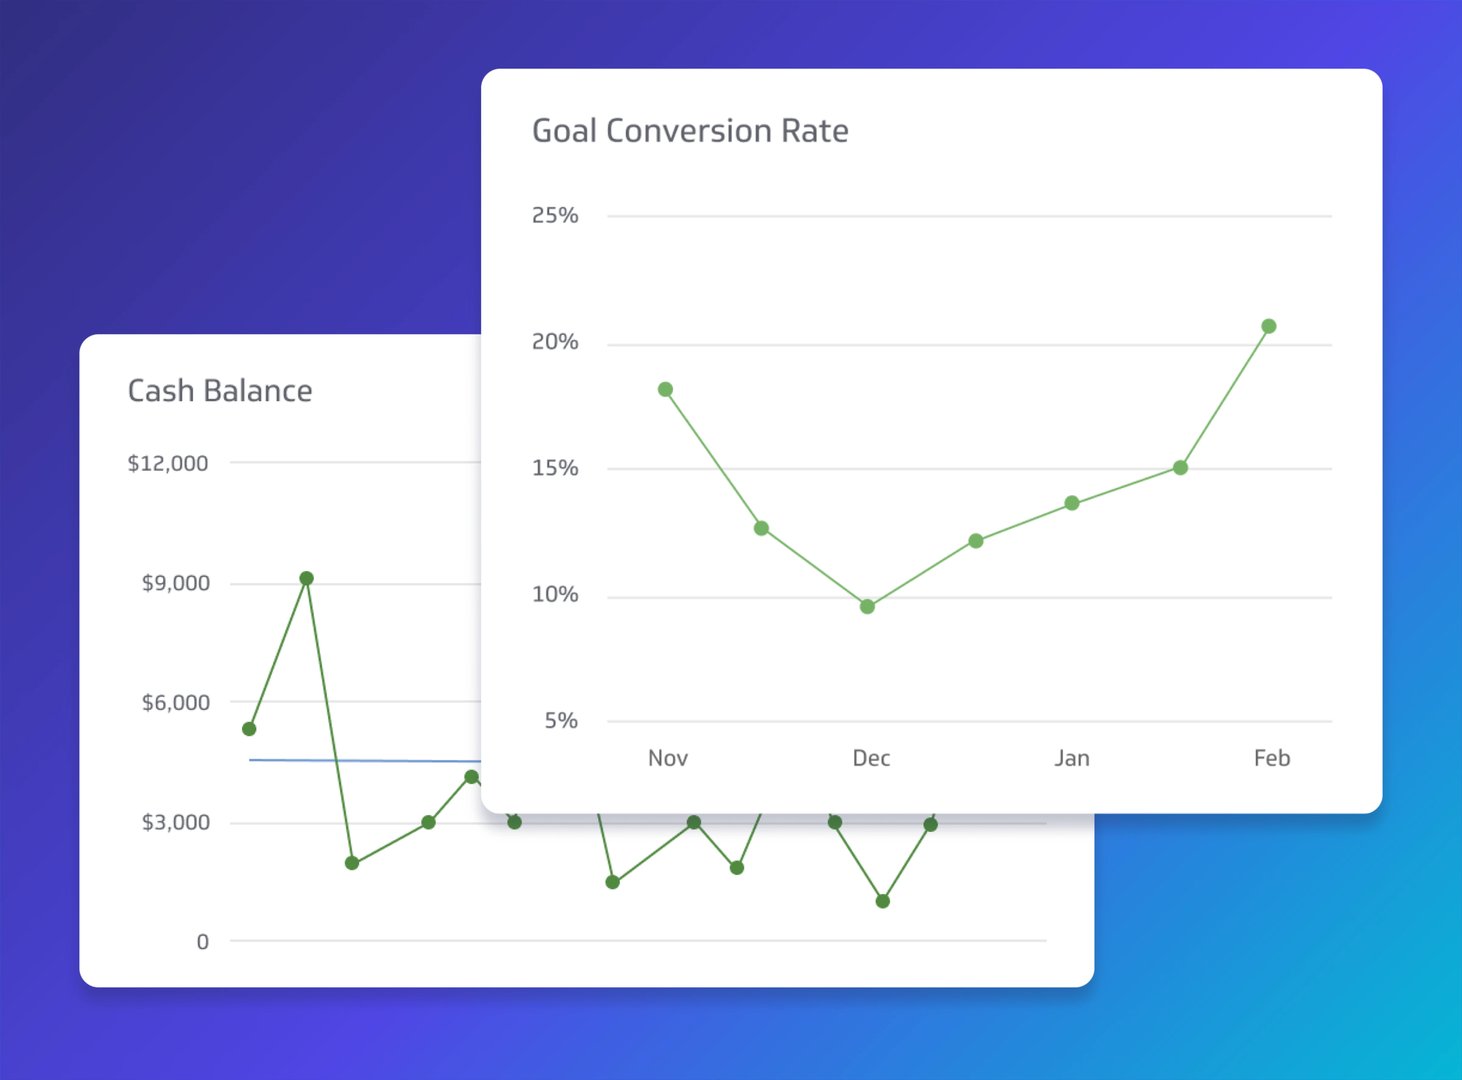
Finance
Finance teams sit closest to the numbers that determine whether the business is healthy. Track these to stay ahead of problems and guide growth decisions:
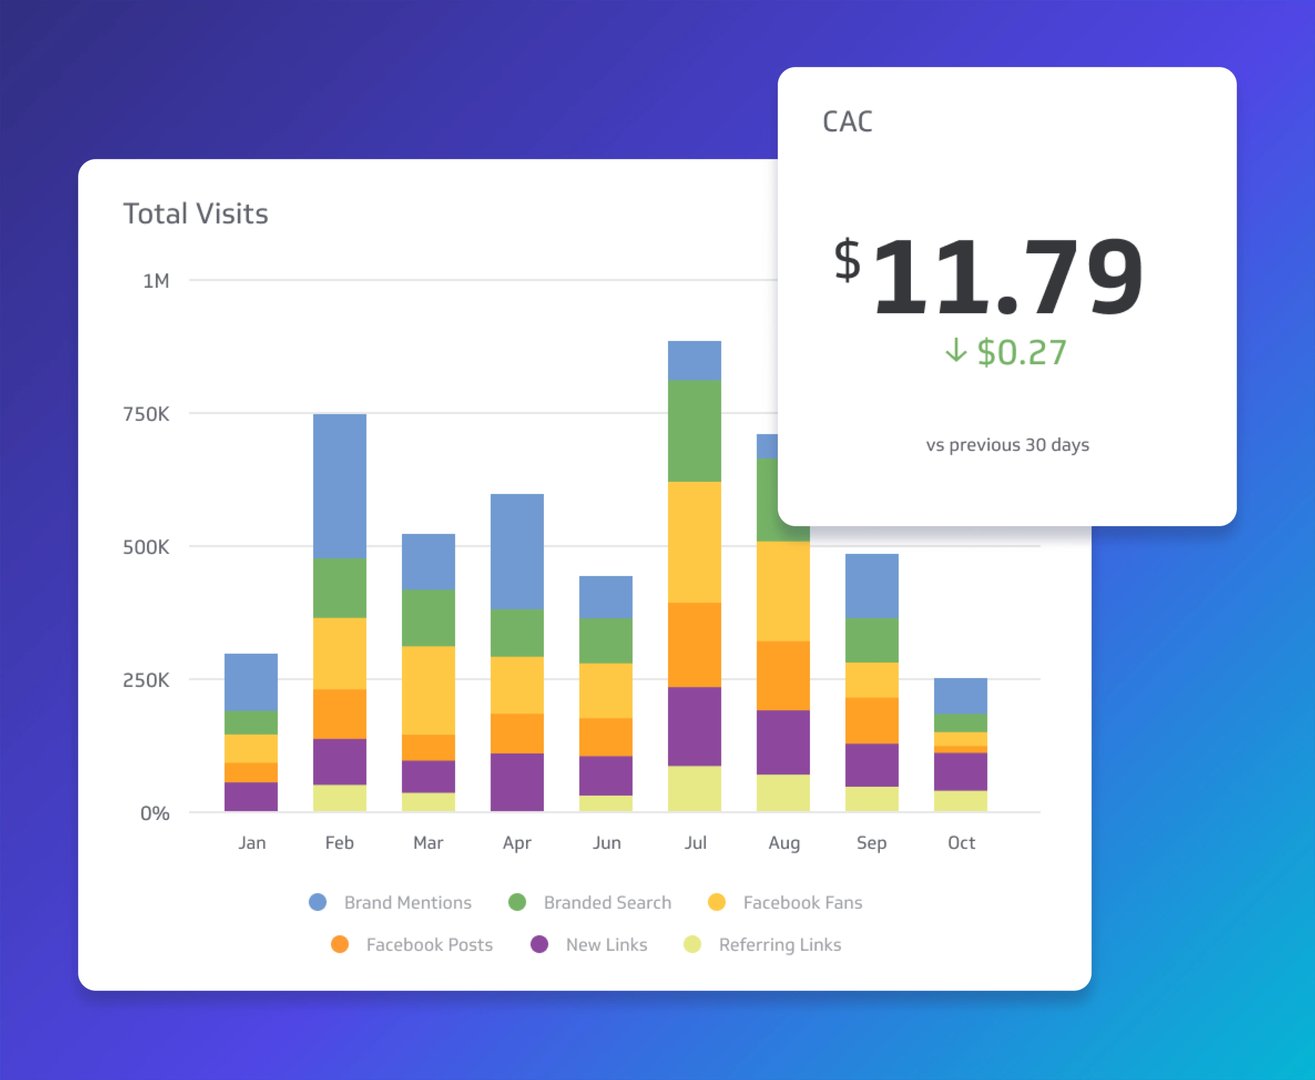
Marketing
Marketing generates more data than almost any other function. These five metrics cut through the noise and connect activity to outcomes:
- Marketing Qualified Leads
- Customer Acquisition Cost
- Conversion Rate
- Sessions
- Average Time on Page
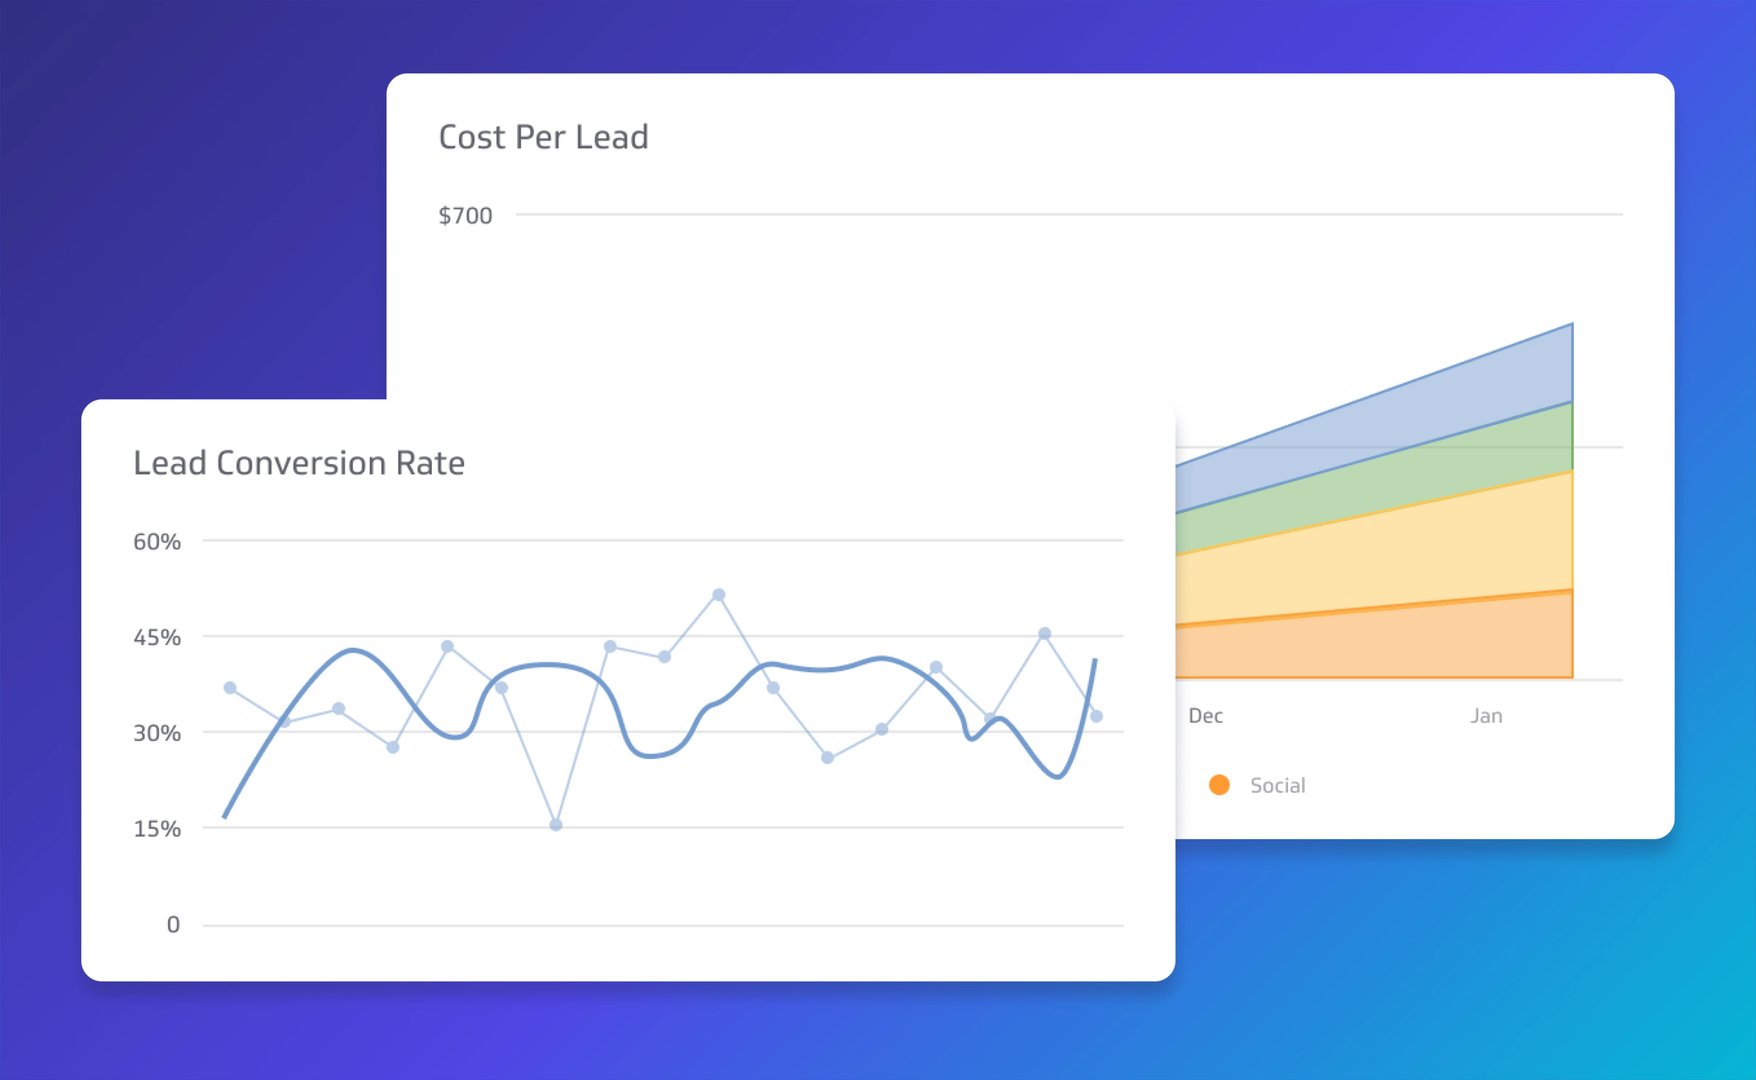
Create custom dashboards for you and your team.
Get started with KlipsSales
Sales teams move fast. These metrics keep the pipeline visible and help leaders know where deals are stalling before it's too late:
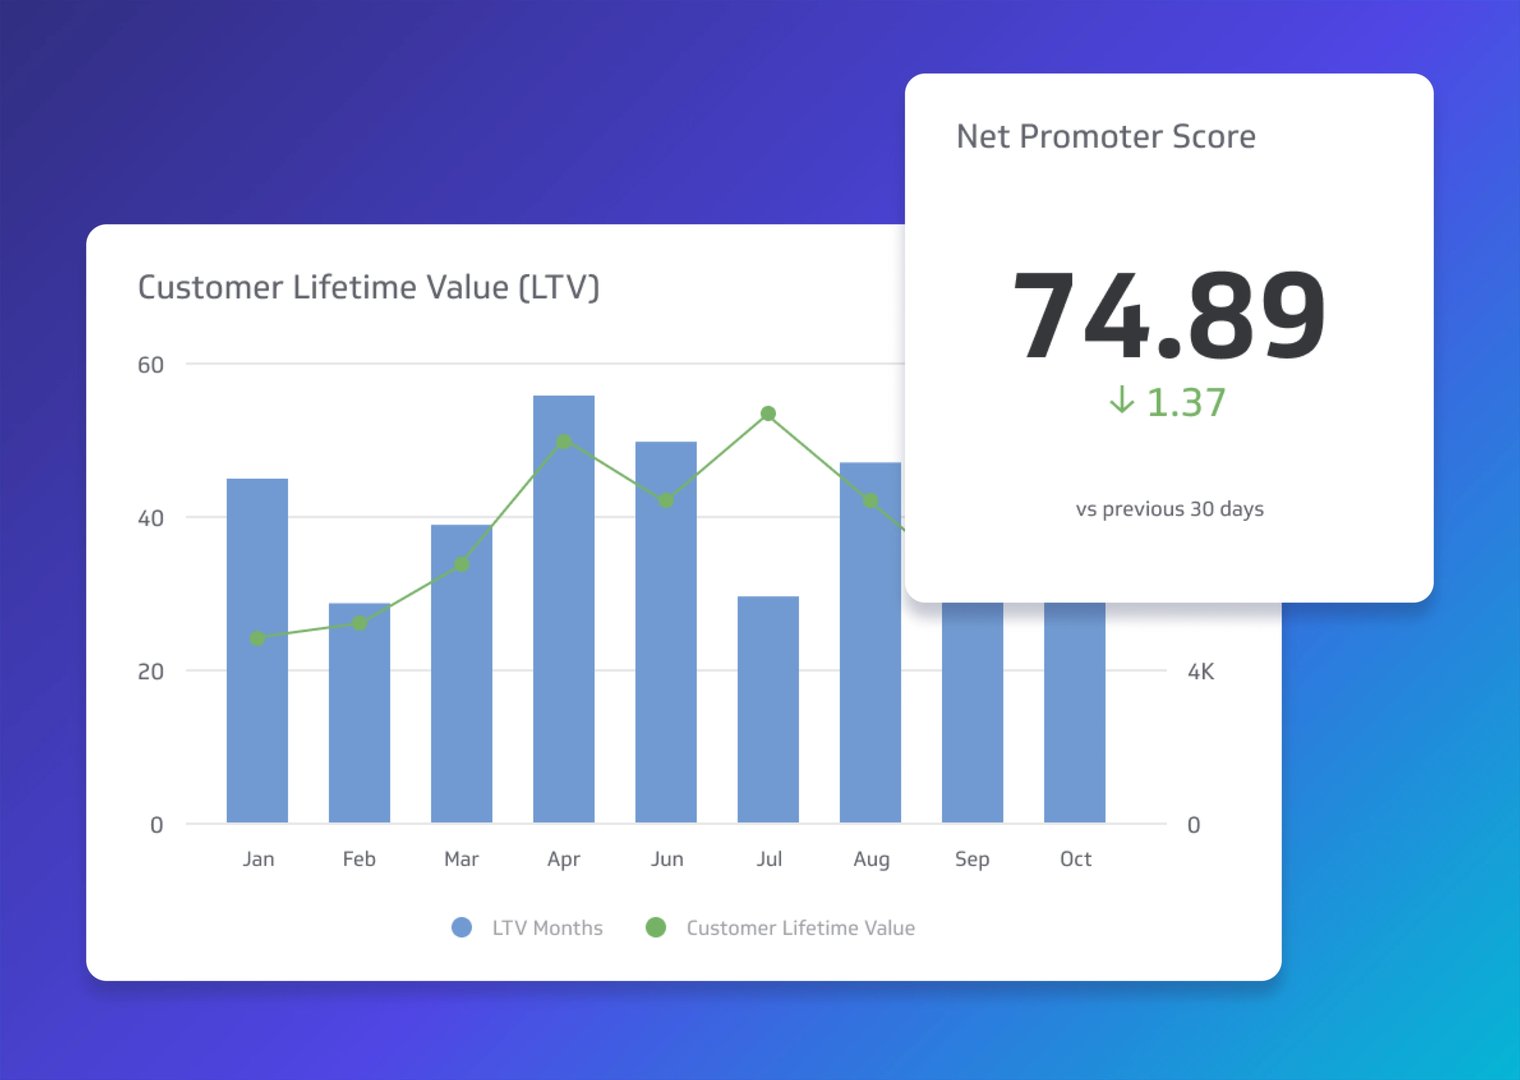
Product management
Product teams need to know whether users are getting value, and how quickly. These metrics connect product decisions to business outcomes:
What are the components of a metric?
Think of metrics as building blocks. Each one has a few core components, and when you stack them together, they tell the full story of your business.
Your data
Every metric starts with data. You can automate retrieval from a database, cloud drive, API, or spreadsheet. Automated data means your metrics always reflect what's happening now, not what was true last Tuesday when someone last exported a file.
Visualizations
Once your data becomes a metric, you can turn it into a chart or visual that's easy to read at a glance. The format matters: a line chart works well for tracking MRR over time; a donut chart makes more sense for revenue distribution by segment. Choosing the right format means the insight is obvious without explanation. (The Starter Guide to Data Visualizations covers this in detail.)
Data history
Trends only become visible over time. Rich data history lets you compare periods quickly, spot patterns, and build on your metrics with more advanced analysis like creating calculated metrics. When all your metrics share a consistent timeframe, comparison becomes straightforward.
Goals and notifications
A number without a target is just a number. Adding a goal gives your metric meaning: you know immediately whether you're on track or behind. Goals act as an alert system, surfacing what needs attention without requiring anyone to go looking for it. That's the difference between knowing something is wrong and finding out too late.
Dashboards and reports
A library of metrics becomes genuinely useful when it's organized into dashboards your team can actually read. Dashboards let you share the story behind the numbers and give everyone a consistent view of performance. The guide to dashboard design is worth reading before you design a dashboard to make sure what you build is clear and actionable.
Where do you track all of these metrics?
Spreadsheets work up to a point. Once your data spans multiple sources and your team grows past a handful of people, the manual work of pulling, formatting, and sharing numbers becomes a job in itself. And a number that lives in someone's spreadsheet isn't really a shared source of truth.
Putting your metrics on a dashboard changes that. It means your numbers are always current, always consistent, and always available to the people who need them, without anyone having to ask.
Klips is built for exactly this. Connect your data sources, build the metrics your business actually tracks, and distribute them to your team in a format everyone can read and trust. No more waiting for someone to pull a number. No more pasting figures into a chat tool and hoping the interpretation is right. The answers are already there.
Try Klips free and get your key metrics into a dashboard your whole team can rely on.
Published 2026-08-21



Most recent
- AUG 11Beyond simple sign-ups: how True Trials and Activation predict growth
- JUL 7Why business leaders miss important trends in their dashboards
- JUN 19The best chart for the job: Visualizing data for non-technical users
- JUN 95 tips to understand (and organize) your restaurant data
- MAY 26Think in Horizons, Not Seconds
- MAY 2010 Cloud BI Dashboard Tools for Small Businesses in 2026