

Five high-impact analytics opportunities for growing firms in 2026
Discover five practical ways growing firms can use analytics to improve marketing, sales, promotions, expansion planning, and hiring, without needing enterprise tools or specialist staff.

Growing a business is demanding. You're juggling priorities, managing a lean team, and making decisions that compound quickly. Analytics can feel like one more thing to figure out, but the firms moving fastest in 2026 aren't waiting for a data team or a perfect setup. They're using what they already have to know more and guess less.
You don't need enterprise infrastructure or a specialist on staff to get there. What you need is a clear starting point.
What analytics actually means for a growing firm
Analytics is a broad term. Knowing which type you're dealing with helps you decide where to focus first.
Descriptive analytics answers "What happened?" It uses existing data to describe past performance or your current situation. Most growing firms start here, and it's the right place to begin.
Diagnostic analytics answers "Why did it happen?" It digs into the reasons behind a trend or outcome, so you're not just seeing a number but understanding it.
Predictive analytics answers "What might happen next?" It uses historical data to surface risks and opportunities before they arrive.
Prescriptive analytics answers "What should we do?" It recommends specific actions based on what the data shows.
Dashboard software like Klips makes descriptive and diagnostic analytics accessible without expensive infrastructure. You connect your data sources, set up your Klips, and the numbers stay current automatically. No manual pulling, no waiting for someone to run a report. Between 60% and 73% of enterprise data goes unused for analytics. That's not a technology problem. It's a starting problem.
Five high-impact analytics opportunities for growing firms
If you're not sure where to begin, these five areas consistently deliver clear, measurable returns. Pick the one where you already collect data and start there.
1. Improving marketing campaign outcomes
Data-driven marketing works. Research by McKinsey found that using data when making marketing decisions can result in a 15–20% increase in marketing productivity.
Analytics show you which messages resonate with specific audiences, which channels deliver the strongest ROI, and which campaigns actually drive conversions. That clarity matters most when you're testing assumptions or stress-testing ideas from planning sessions or a SWOT analysis.
Without it, you're making calls based on instinct or pasting numbers into a spreadsheet and hoping the pattern is obvious. With a live marketing dashboard, you see what's working before the budget runs out.
!smb dashboard
2. Fine-tuning sales efforts
Your sales team generates revenue, but do you know who generates the most? Which reps close deals fastest? How many touchpoints does an average prospect need before converting?
Those answers are already in your CRM. A CRM dashboard can surface the insight you need to increase sales conversions, revealing top performers, pipeline bottlenecks, and where coaching effort pays off most. Instead of waiting for a quarterly review to find out what went wrong, you see it in time to act.
3. Better promotional planning
Running a promotion without data is guesswork. Analytics replace that guesswork with a clear picture of what has actually worked:
- Which past promotions drove the most revenue
- Which products attracted the most interest when featured
- Which dates or seasons were most lucrative for your business
That history shapes smarter future decisions. It can also surface surprises: a product that outperformed expectations might signal demand for a new line or a market you haven't fully tapped.
4. Smarter business expansion planning
Scaling brings high-stakes decisions. Should you open a new location? Enter a new market? Add headcount in a specific department?
Analytics let you stress-test those ideas before committing resources. You can model the potential impact of different approaches against historical performance data, which means fewer expensive surprises and more confidence in the direction you choose. That's the difference between a decision backed by evidence and one backed by a feeling.
5. Enhanced recruitment and retention
Analytics isn't only for revenue-facing functions. HR is one of the highest-leverage use cases for a growing firm.
Knowing which employees are at risk of leaving before they hand in their notice gives you time to act. Forecasting when you'll need to hire, based on growth trends and turnover patterns, keeps you ahead of gaps instead of scrambling to fill them.
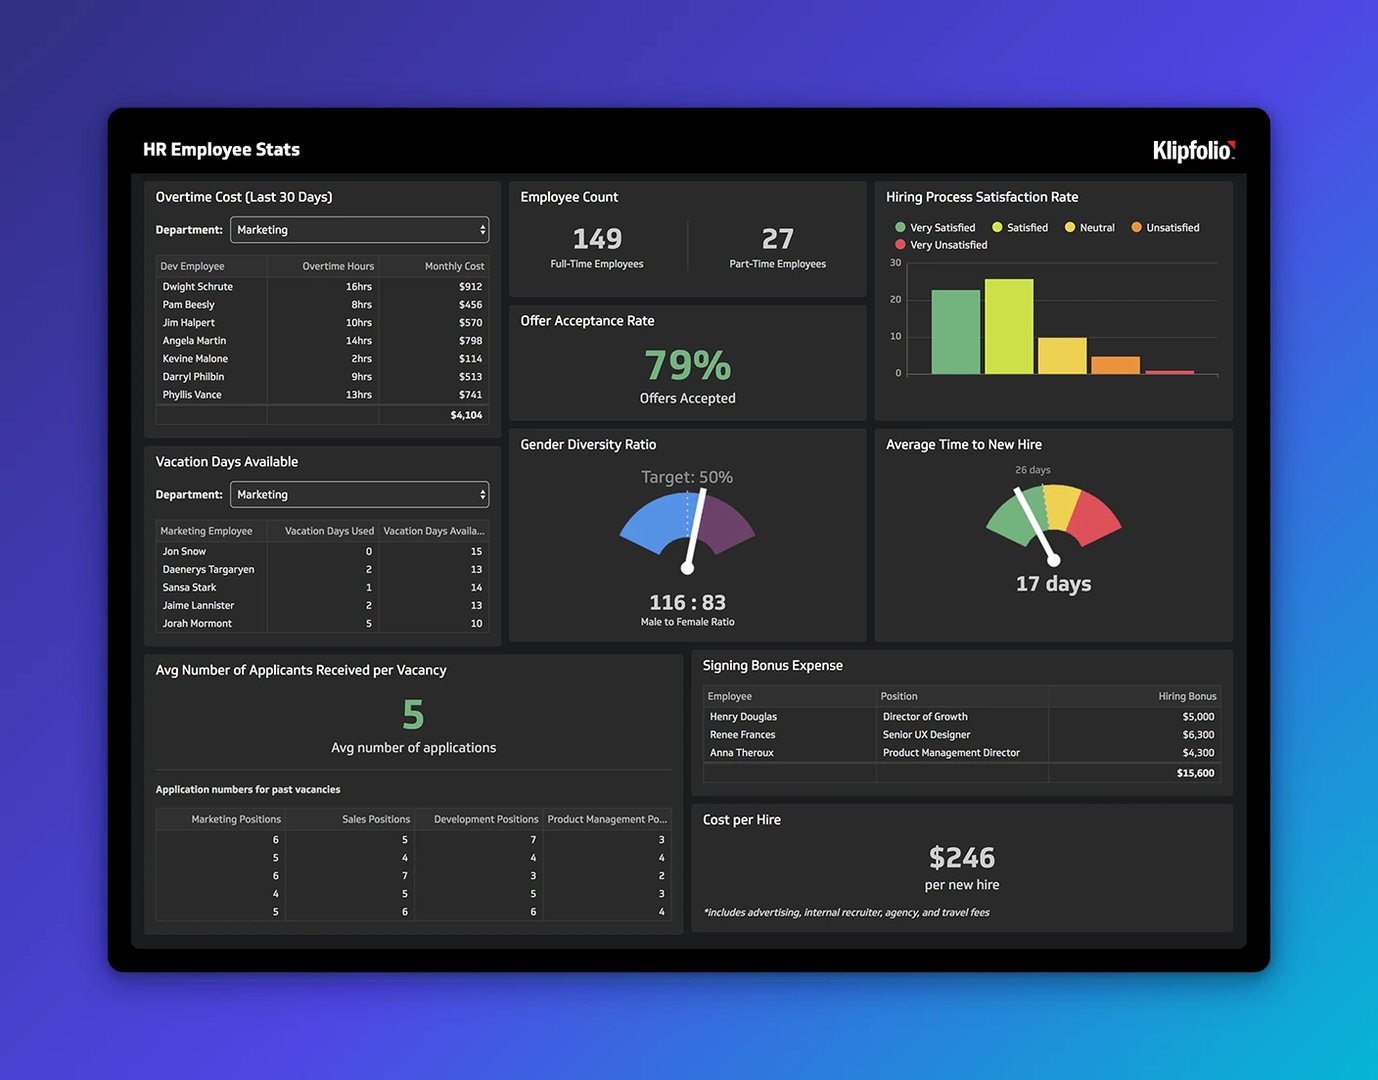
Reducing unexpected turnover saves money. Better hiring decisions improve team performance. Both have outsized impact when you're running lean.
Create custom dashboards for you and your team.
Get started with KlipsGetting started without overcomplicating it
You don't need to tackle all five areas at once. Start with one place where you already collect data: marketing metrics, sales pipeline, or HR trends. Pick a metric that matters, put it in a dashboard, and share it with your team on a regular cadence.
Confidence builds quickly when the numbers are reliable and in front of you without effort. From there, adding a second area is straightforward. The goal isn't a sophisticated analytics practice overnight. It's knowing more than you did last month, consistently, without having to go looking for it.
The firms winning in 2026 aren't waiting for perfect data or a dedicated analyst. They're using what they have to make sharper calls today.
Published 2026-08-24
More in Best Practices

5 tips to understand (and organize) your restaurant data

6 dashboards I use daily to run my SaaS company
Business Metrics vs. KPIs: What’s the Difference?
What is a KPI, metric, or measure?

The Hidden Value of SaaS Sign Up Rate Benchmarks
Why every digital marketer needs to learn how to deploy marketing technology
Most recent
- AUG 11Beyond simple sign-ups: how True Trials and Activation predict growth
- JUL 7Why business leaders miss important trends in their dashboards
- JUN 19The best chart for the job: Visualizing data for non-technical users
- JUN 95 tips to understand (and organize) your restaurant data
- MAY 26Think in Horizons, Not Seconds
- MAY 2010 Cloud BI Dashboard Tools for Small Businesses in 2026