

The 25 must-have KPIs for Call Centre Managers
Call centre managers have waves of data coming at them from various platforms for various business processes. Get the top 25 call centre metrics.

Call centres get busy. With all the calls, call agents, and data moving every hour, it can feel like you are drowning.
Here is the safety gear: metrics and dashboards. Metrics give you a clear view of performance, and dashboards keep everything in one place.
This list covers the 25 top metrics, or KPIs, that help you stay on top of the details and keep the team pointed at results.
What are KPIs
Think of KPIs like a life jacket. The jacket keeps you afloat, but you still need to swim to shore. KPIs (Key Performance Indicators) give you visibility into performance and trends, then you act to improve results and keep positive trends going.
The KPI definition (Key Performance Indicator) is a measurable value that shows how effectively a company, department, team, or individual is achieving business goals. Relevant KPIs change by role and industry; for example, an ER intake nurse tracks very different measures than a CFO at a not?for?profit.
Want to go deeper on KPIs? Start with What is a KPI.
2026 quick tips for call centre KPI programs
- Prioritize first contact resolution: Pair it with a quality review and clear knowledge articles.
- Tune channel SLAs: Set response and resolution targets by channel, not one size fits all.
- Watch occupancy and wellbeing: Balance productivity with breaks to prevent burnout.
- Close the loop: Tag root causes on repeat contacts and fix upstream issues.
- Make KPIs visible: Share live dashboards on TV, mobile, and email so everyone stays aligned.
The Top 25 Call Centre KPIs
These are the must?have call centre metrics for busy teams.
1. Sales per Agent
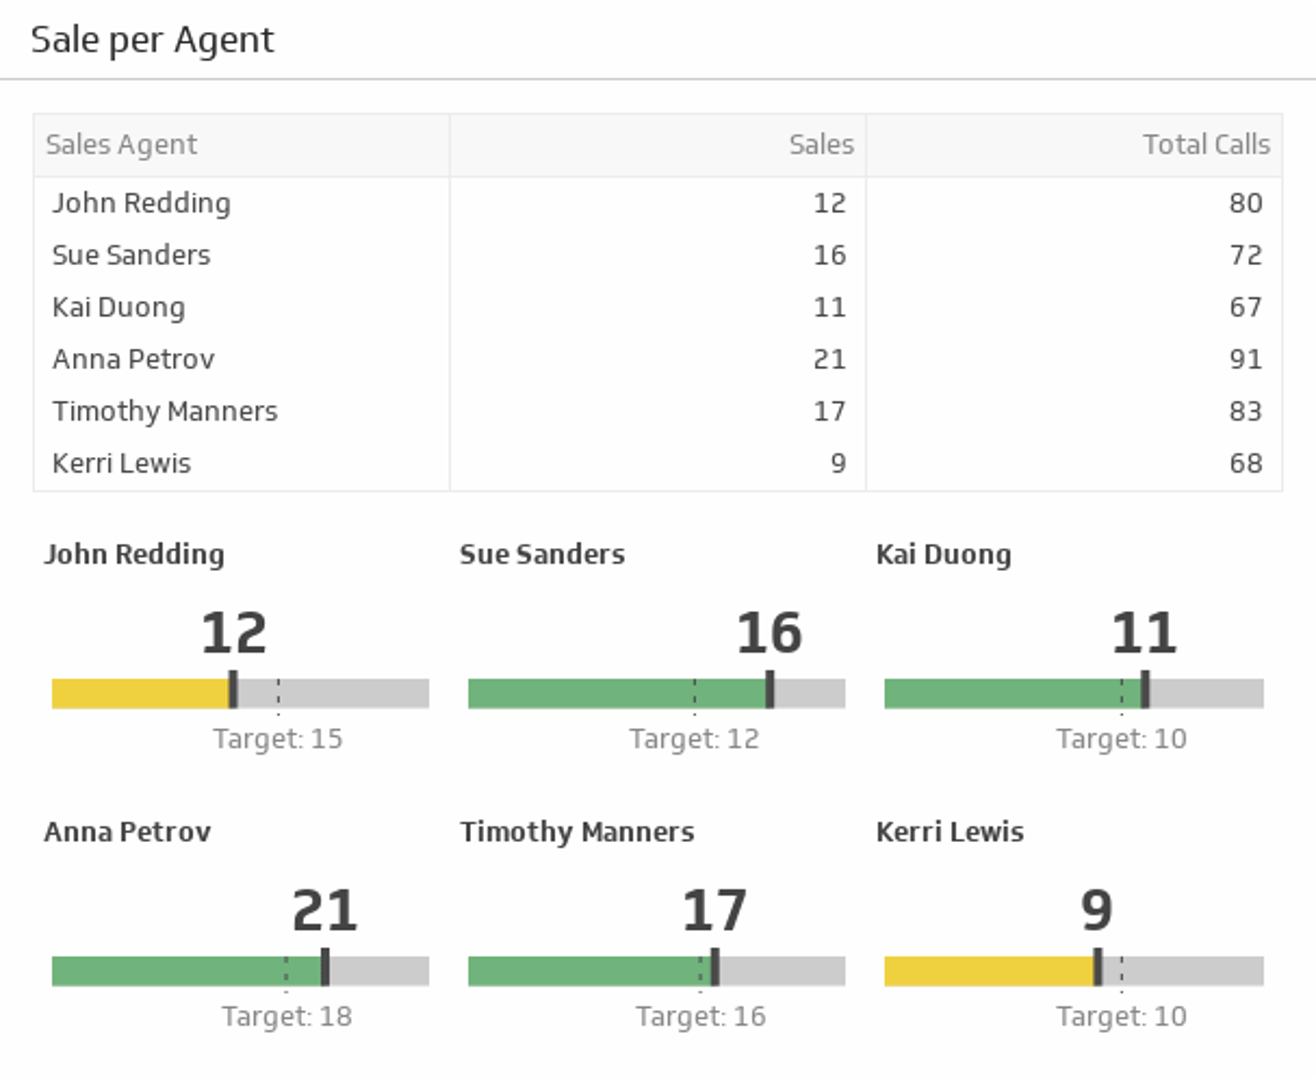
Tracks call efficiency by measuring sales and total calls. Use it to adjust targets and coach for consistent sales performance.
2. Active Waiting Calls
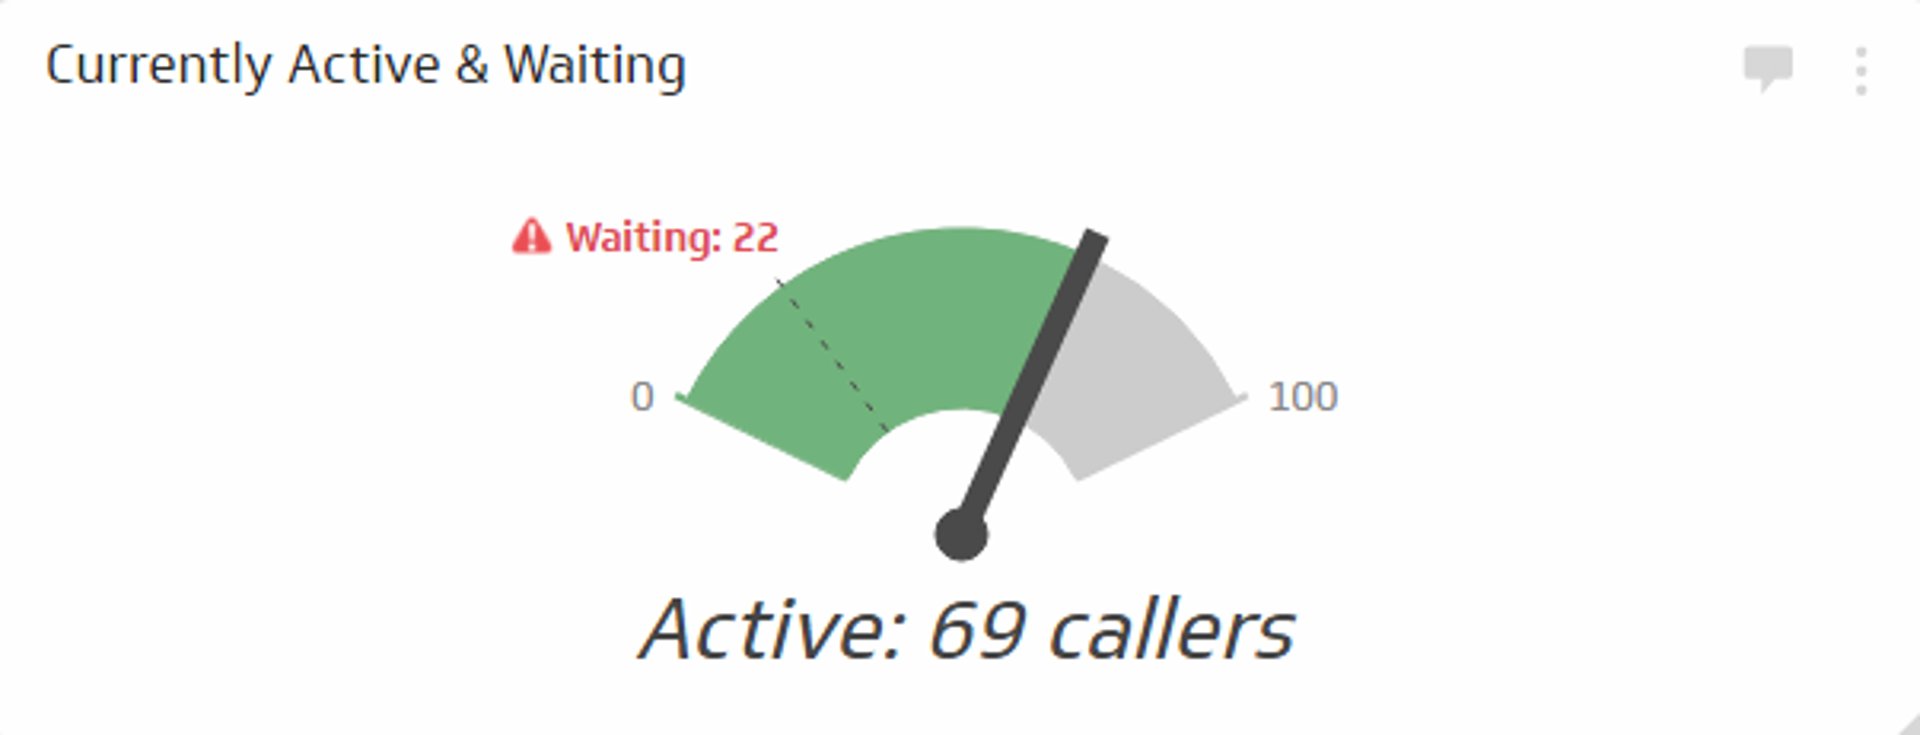
Shows how many calls are in queue. Helps agents pace work and managers understand real?time workload.
3. Longest Call Hold

Highlights the worst wait time against target. Use it to protect loyalty by adjusting staffing and call routing.
4. Peak Hour Traffic
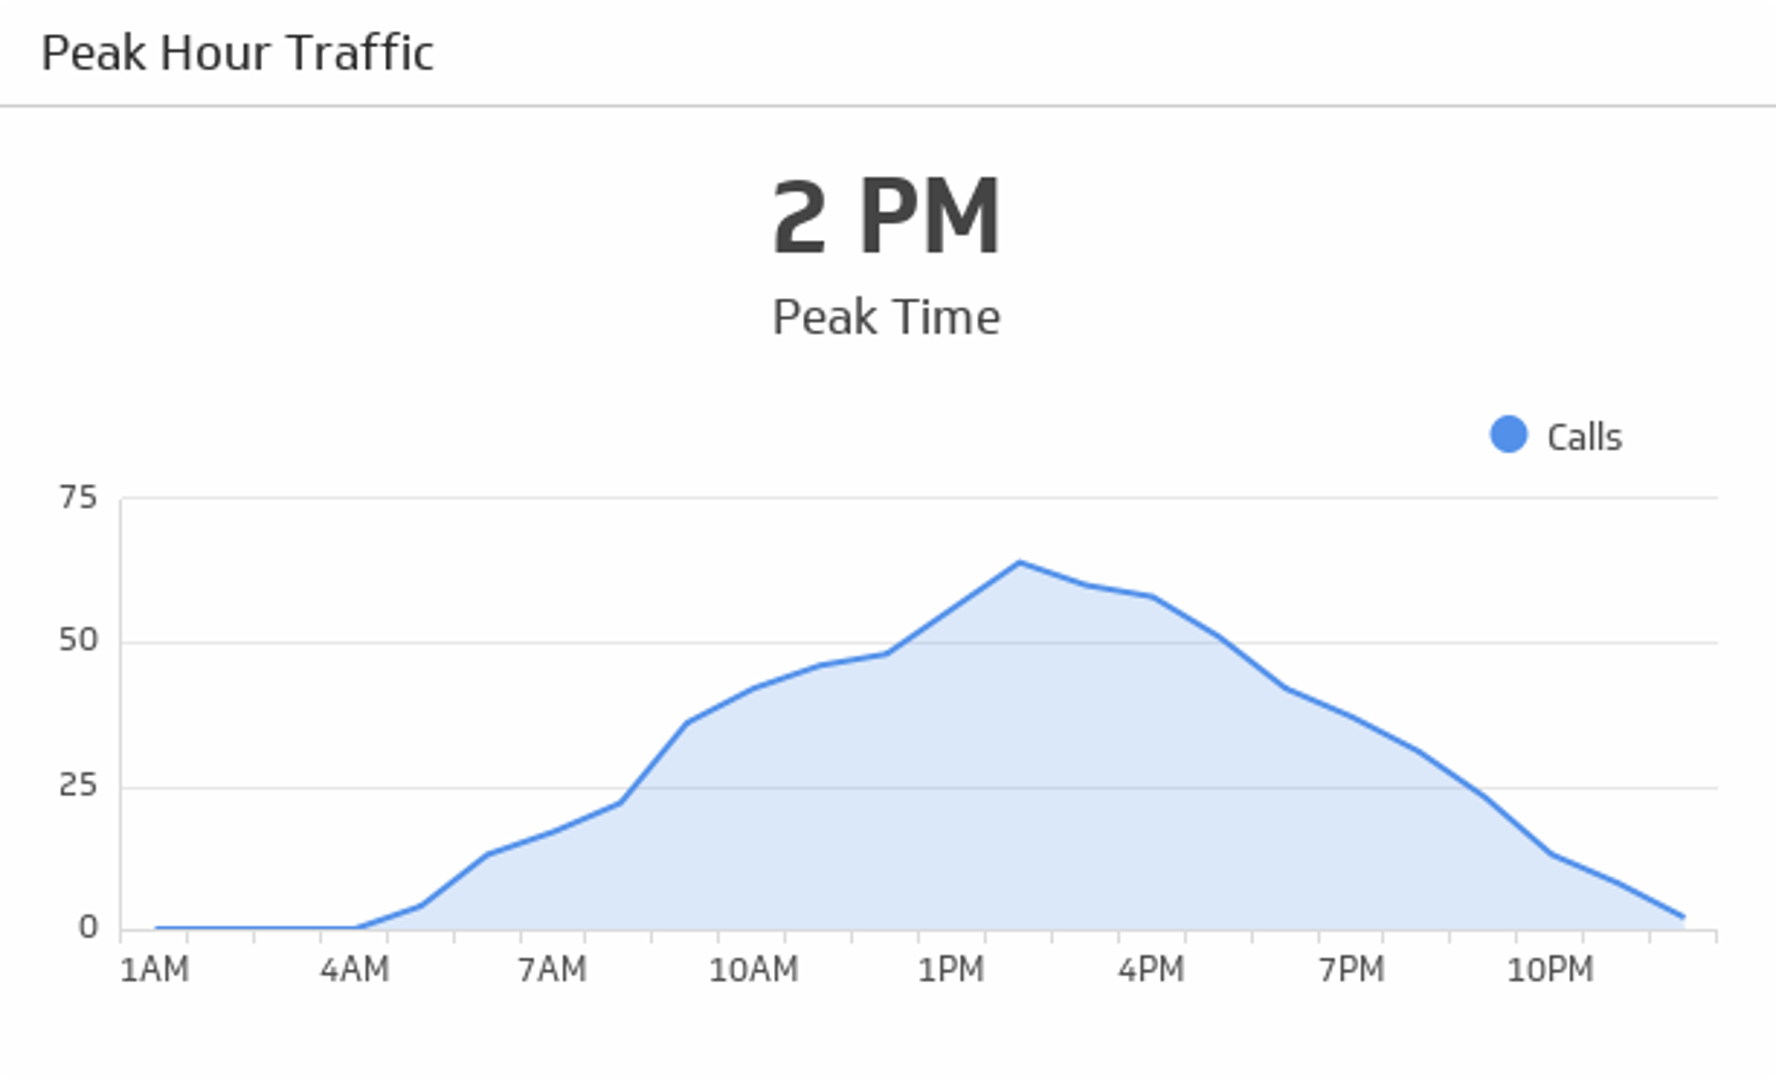
Identifies your busiest hour so schedules match demand.
5. Revenue per Successful Call
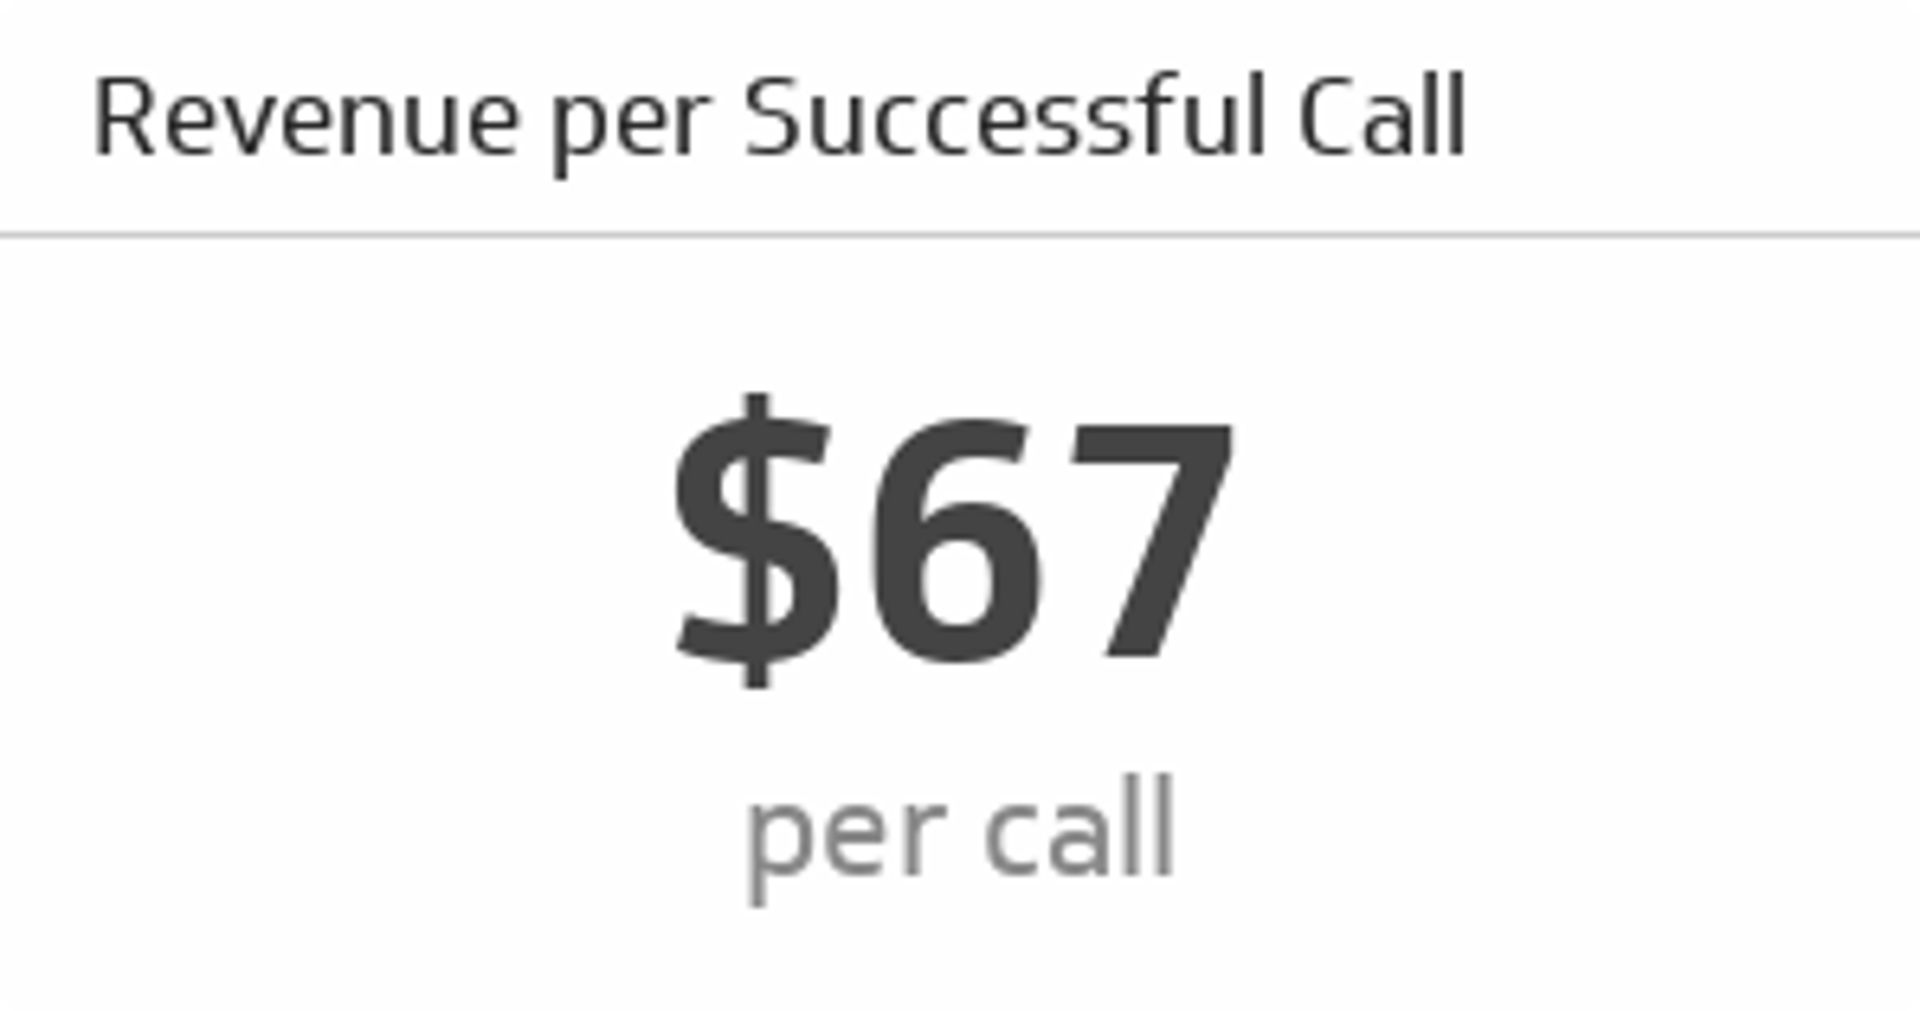
Shows revenue per completed sale. Guides target setting and highlights the value of effective calls.
6. Call Center Status Metrics
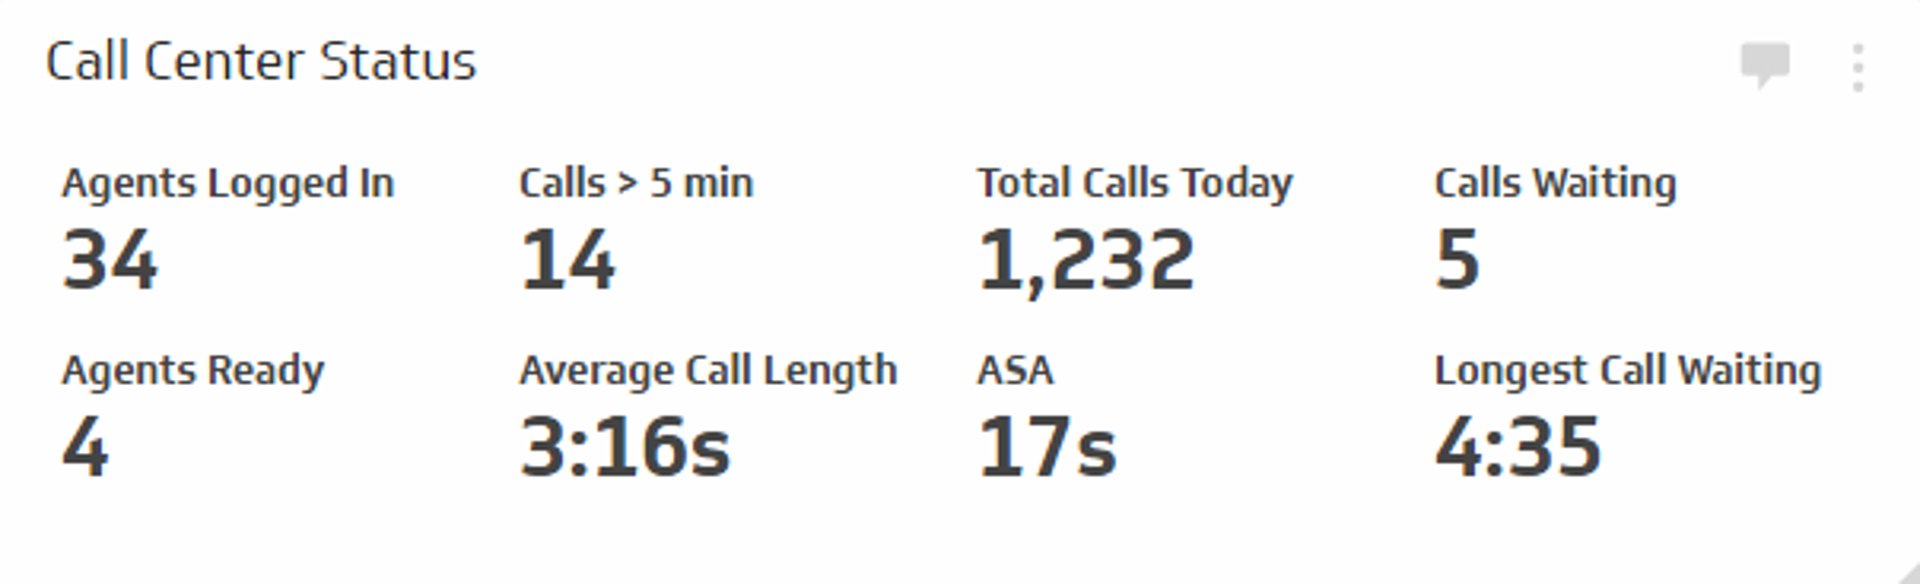
Rolls up multiple metrics for a quick performance snapshot.
7. Call Abandonment
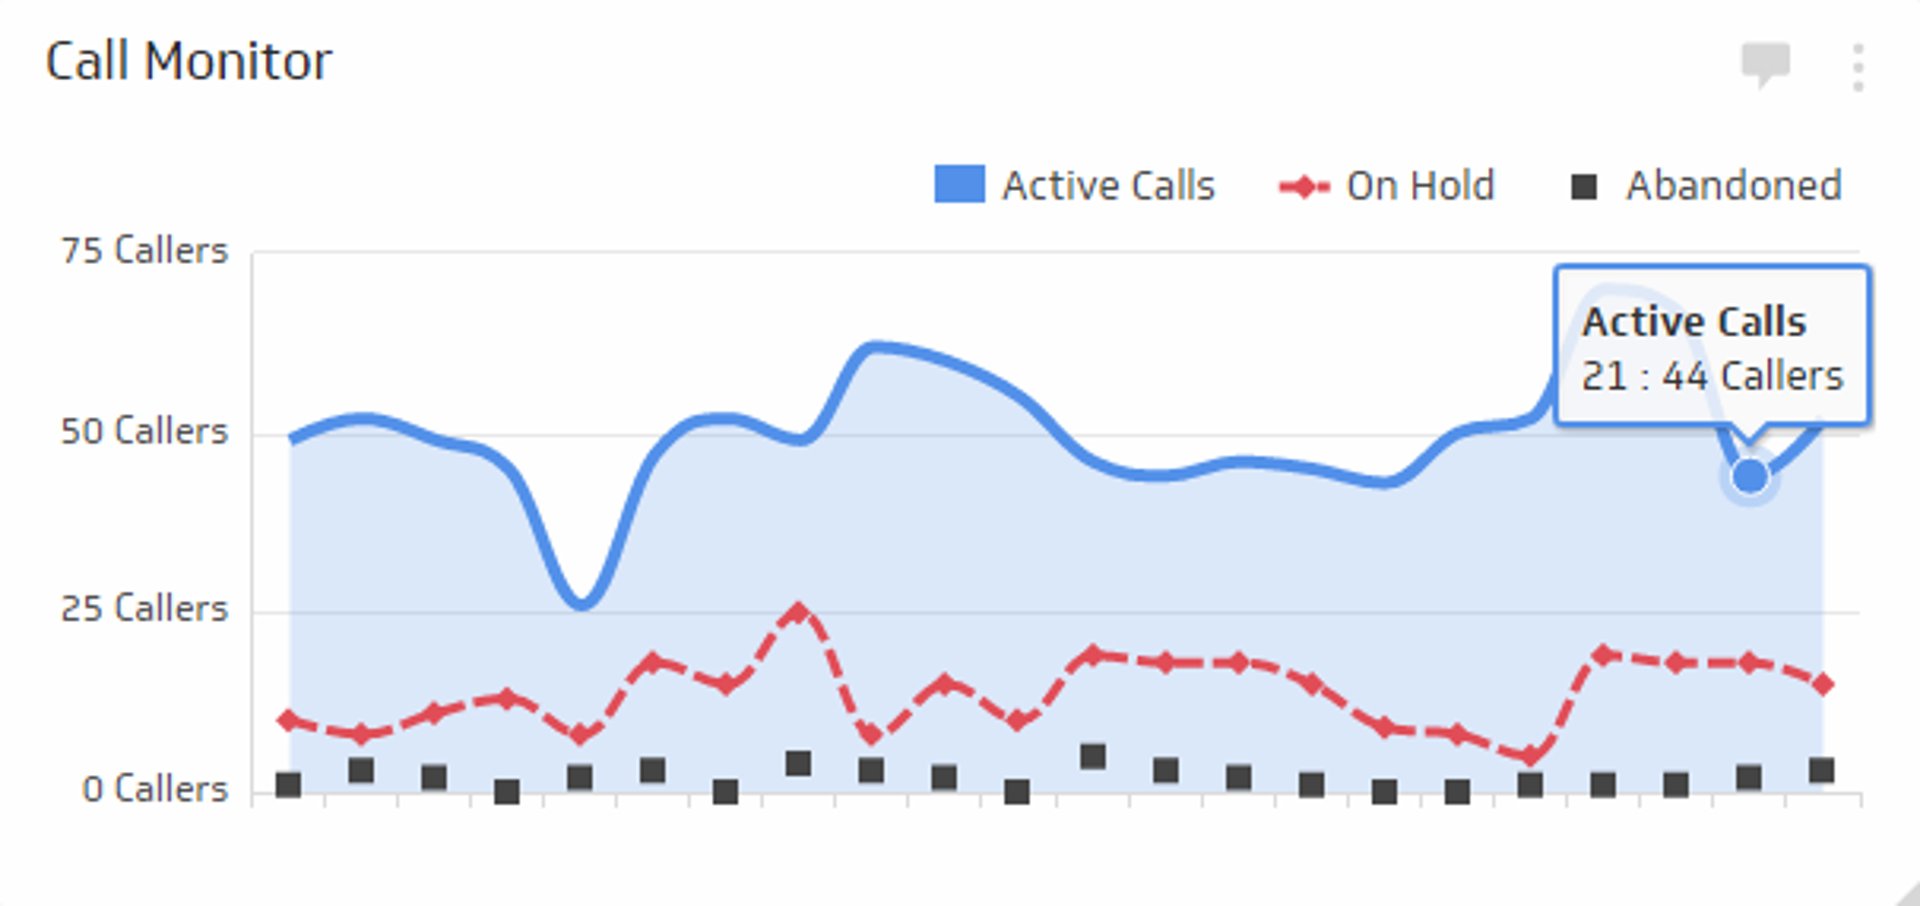
Tracks callers who disconnect before reaching an agent. Monitor alongside active and on?hold calls for context.
8. Telecom Subscriber Acquisition Cost
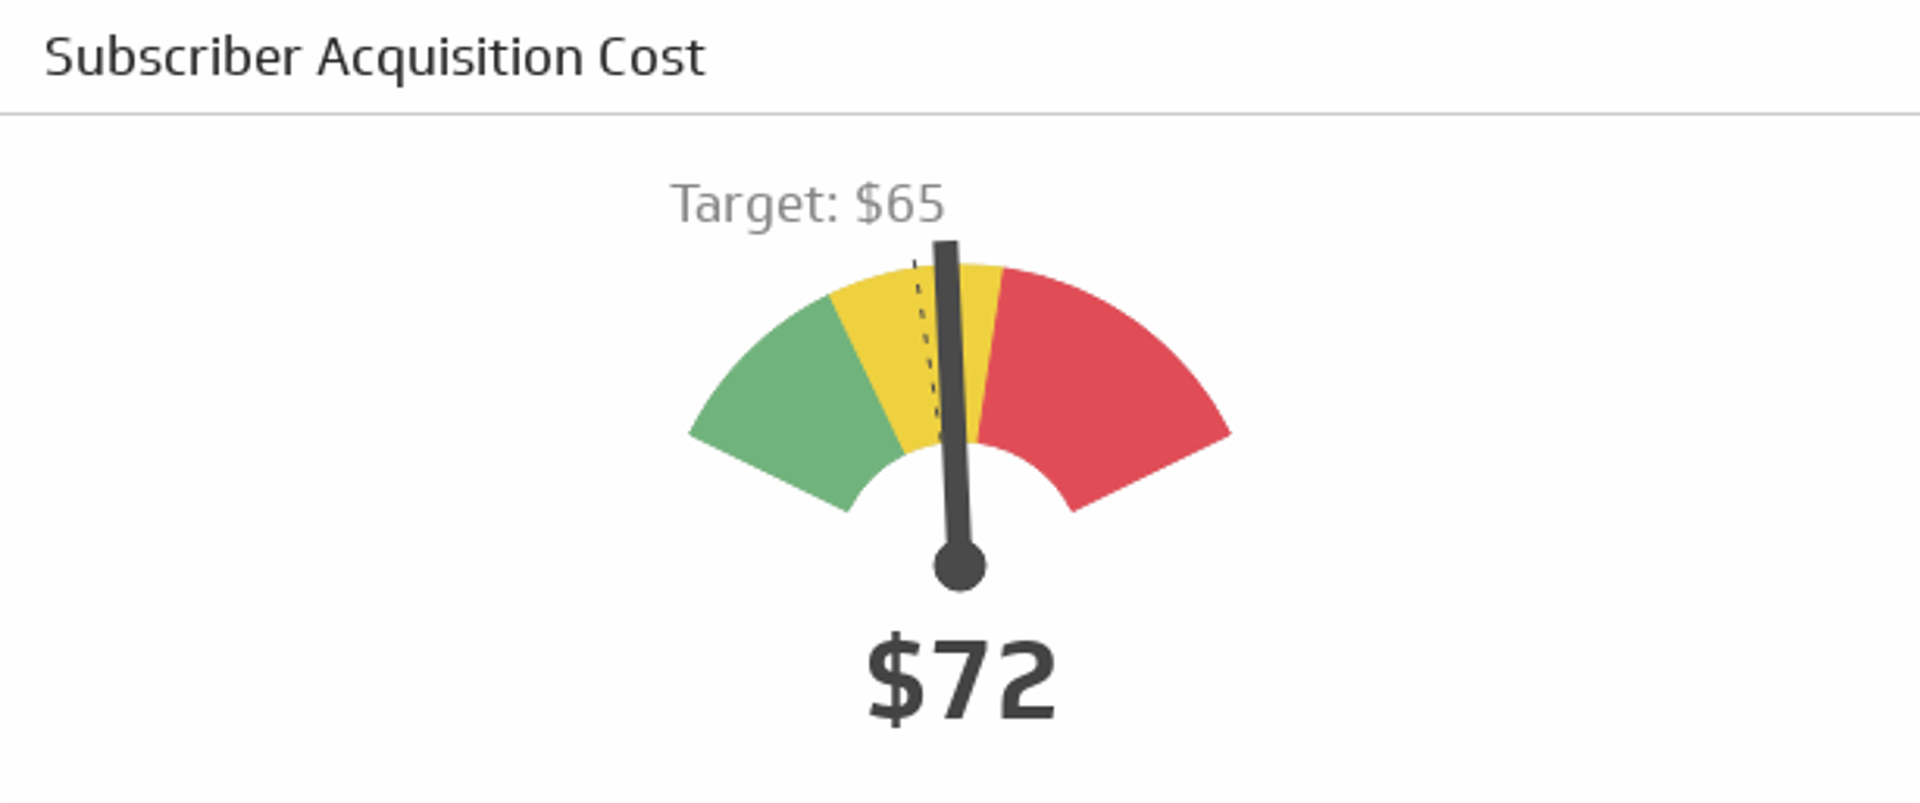
Quantifies spend per new subscriber including agent time, advertising, and other costs.
9. Average Handle Time
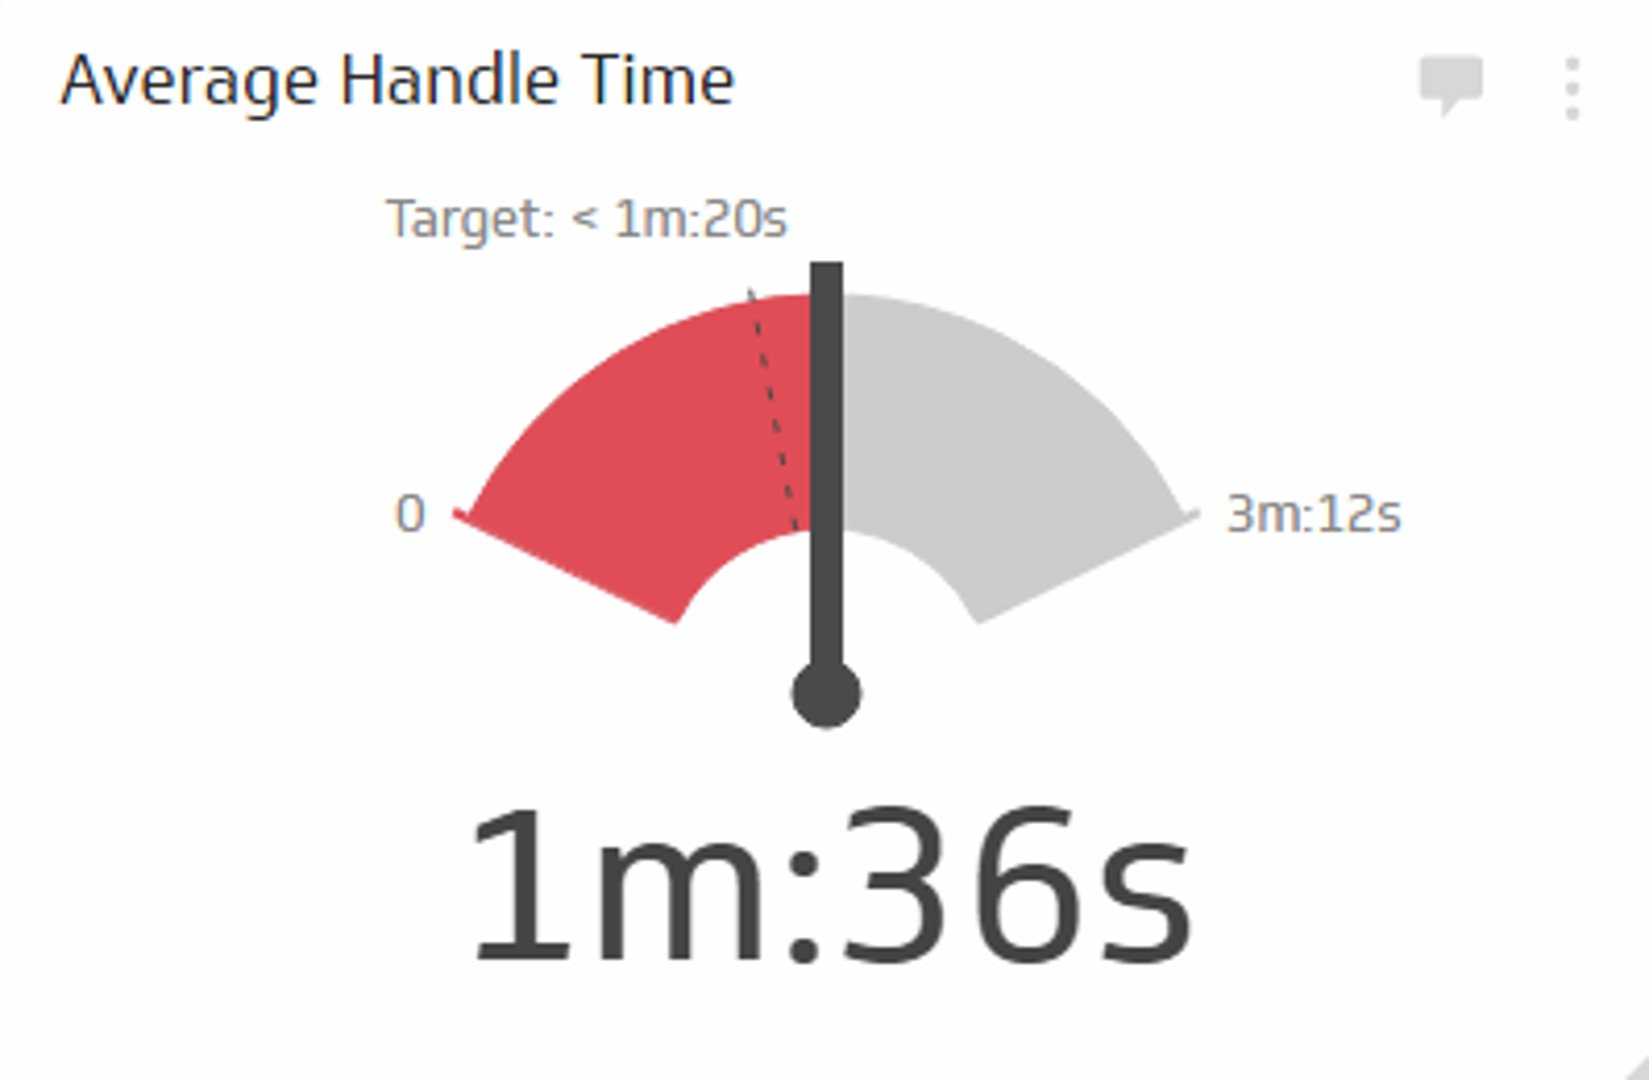
Measures average call duration. Use it to understand workload and coach for clarity and resolution.
10. Cost per Call
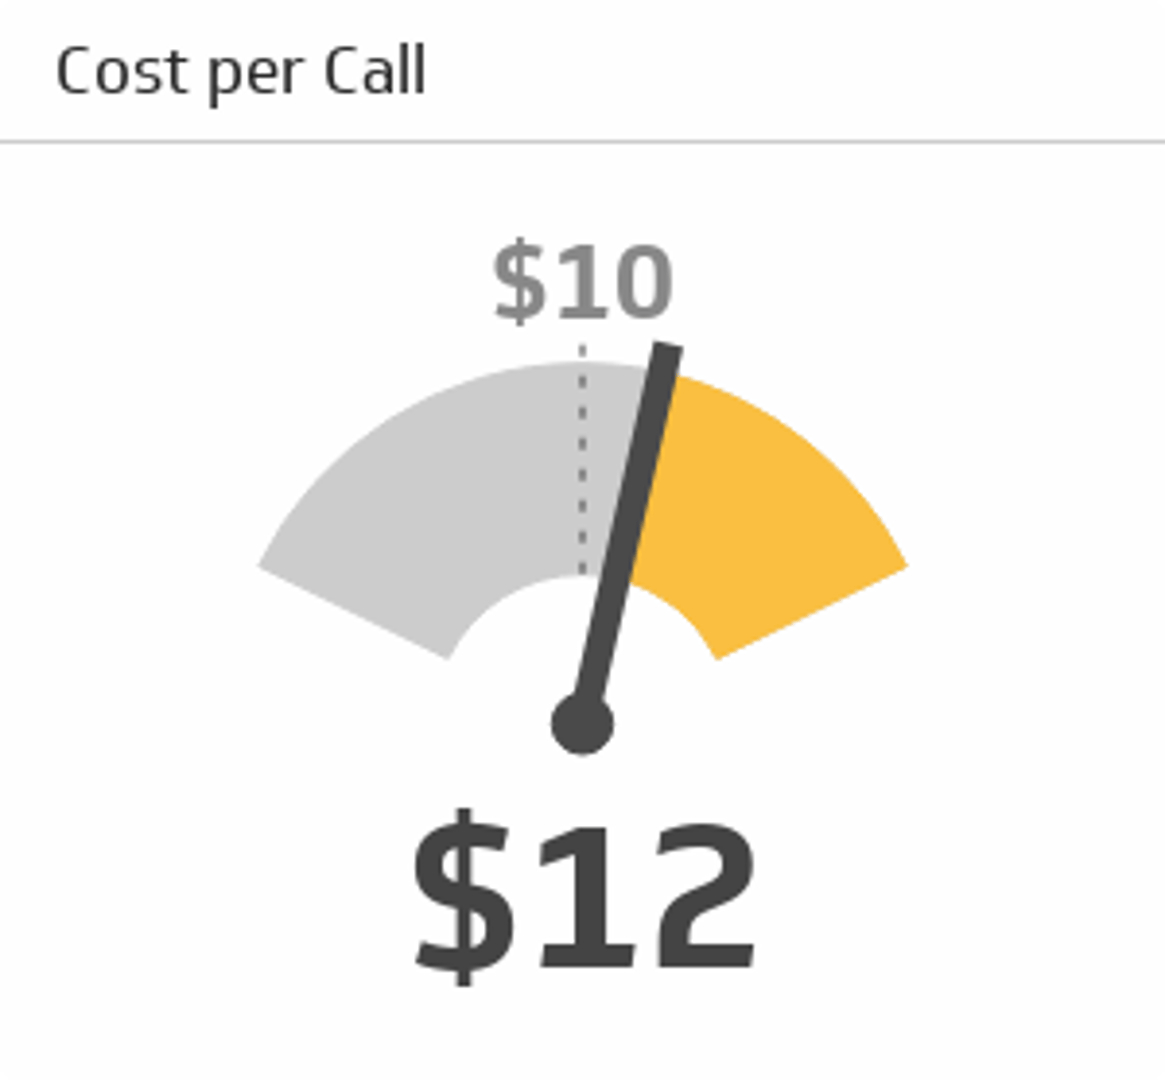
Captures total cost per call across staffing, demand generation, equipment, and overhead.
Create custom dashboards for you and your team.
Get started with Klips11. Customer Satisfaction
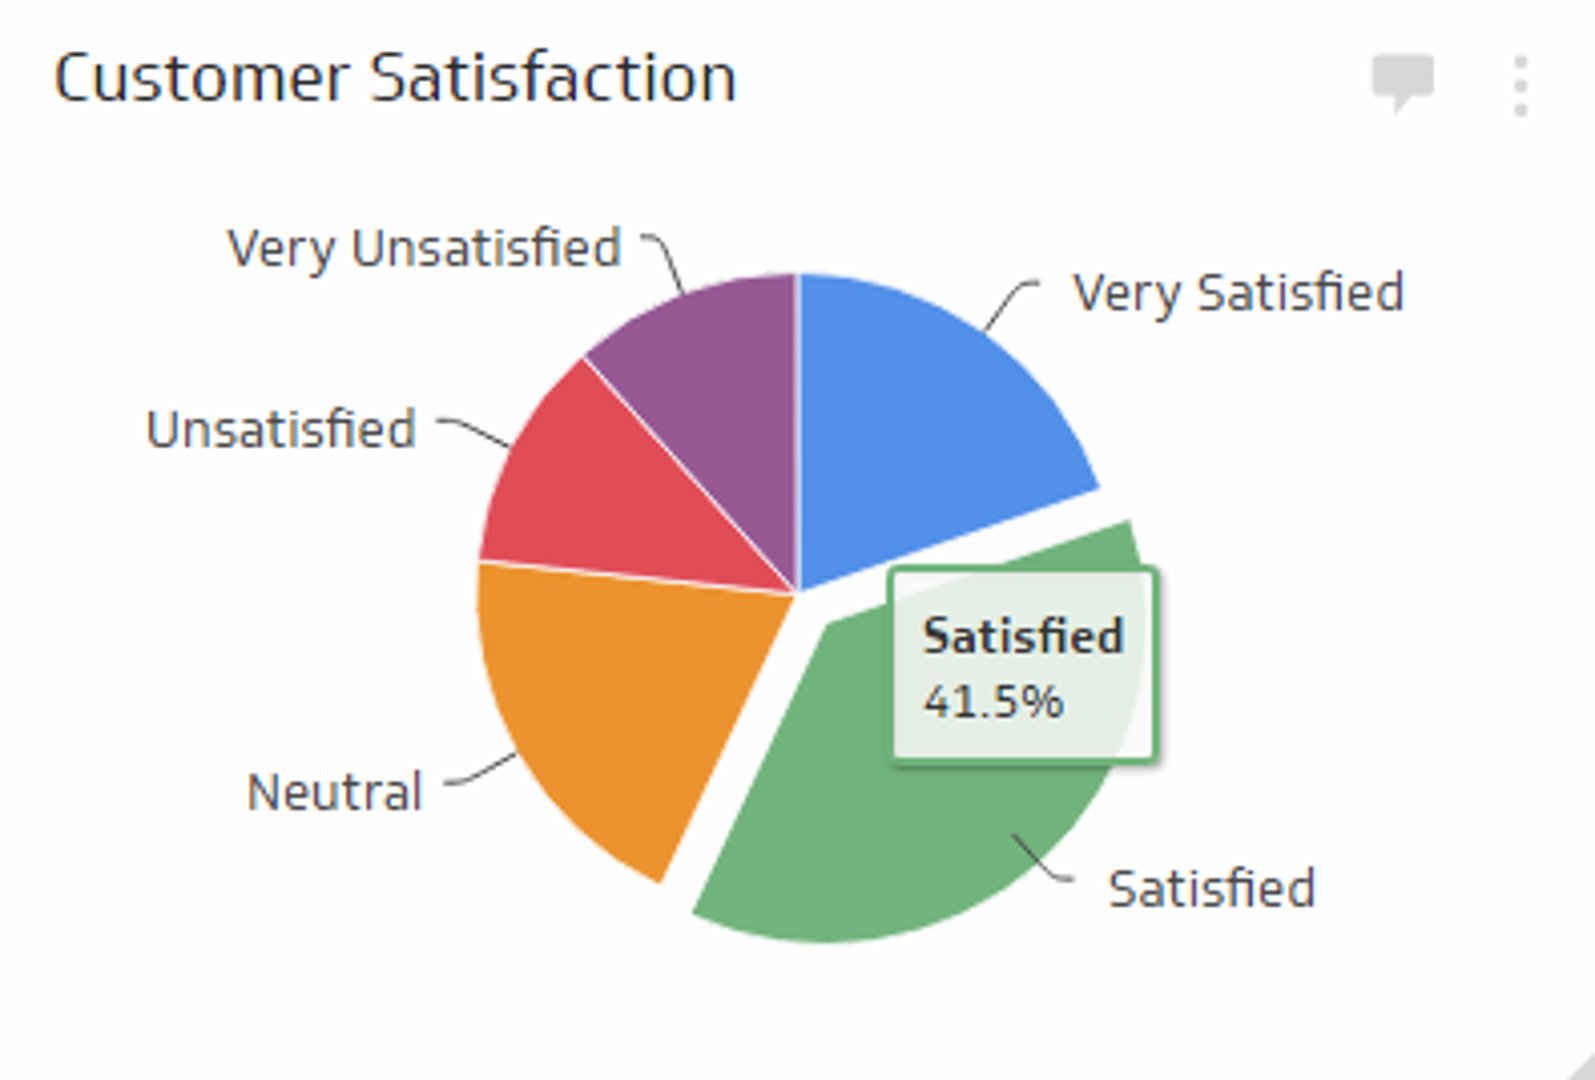
Reflects how customers rate interactions. Tie it to coaching and QA reviews.
12. After Call Work Time
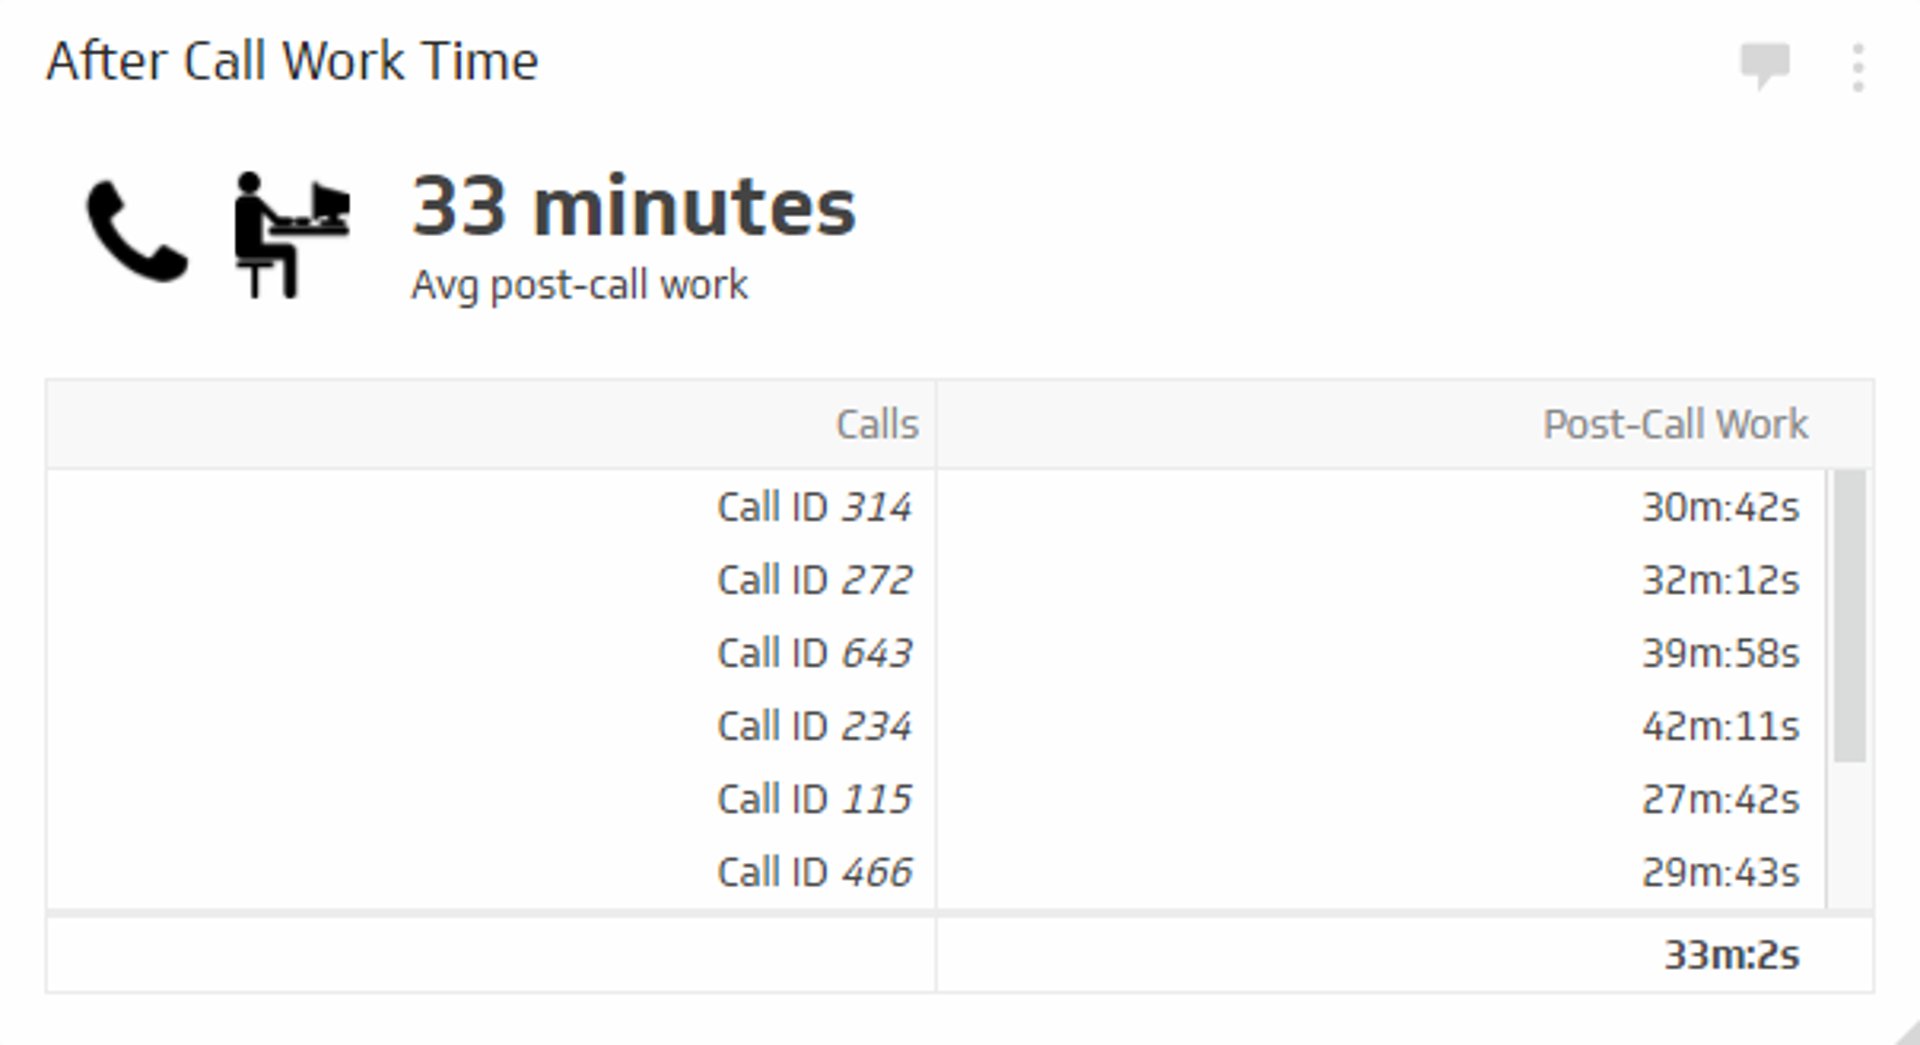
Measures time to complete post?call tasks. Helps plan staffing and reduce admin friction.
13. Cost per Contact
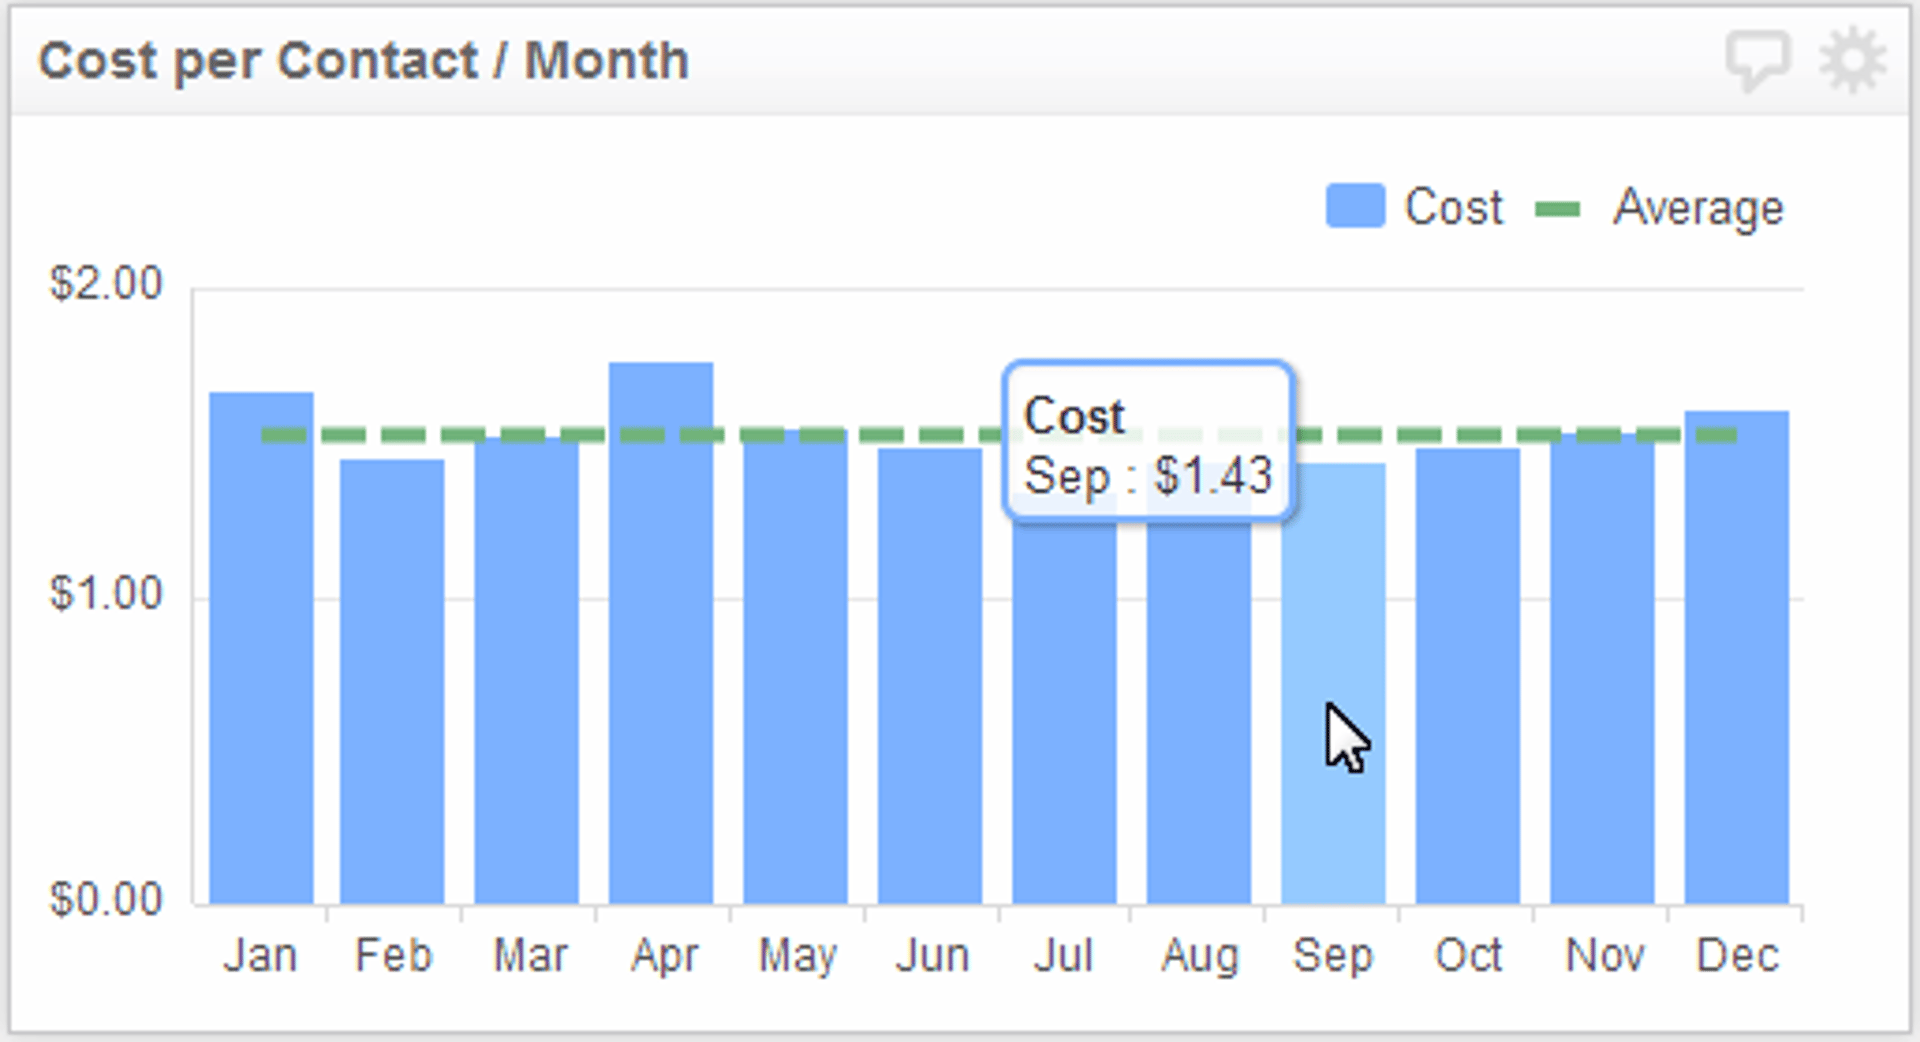
Shows cost for each individual contact. Useful for channel strategy and budget trade?offs.
14. On?Hold Time
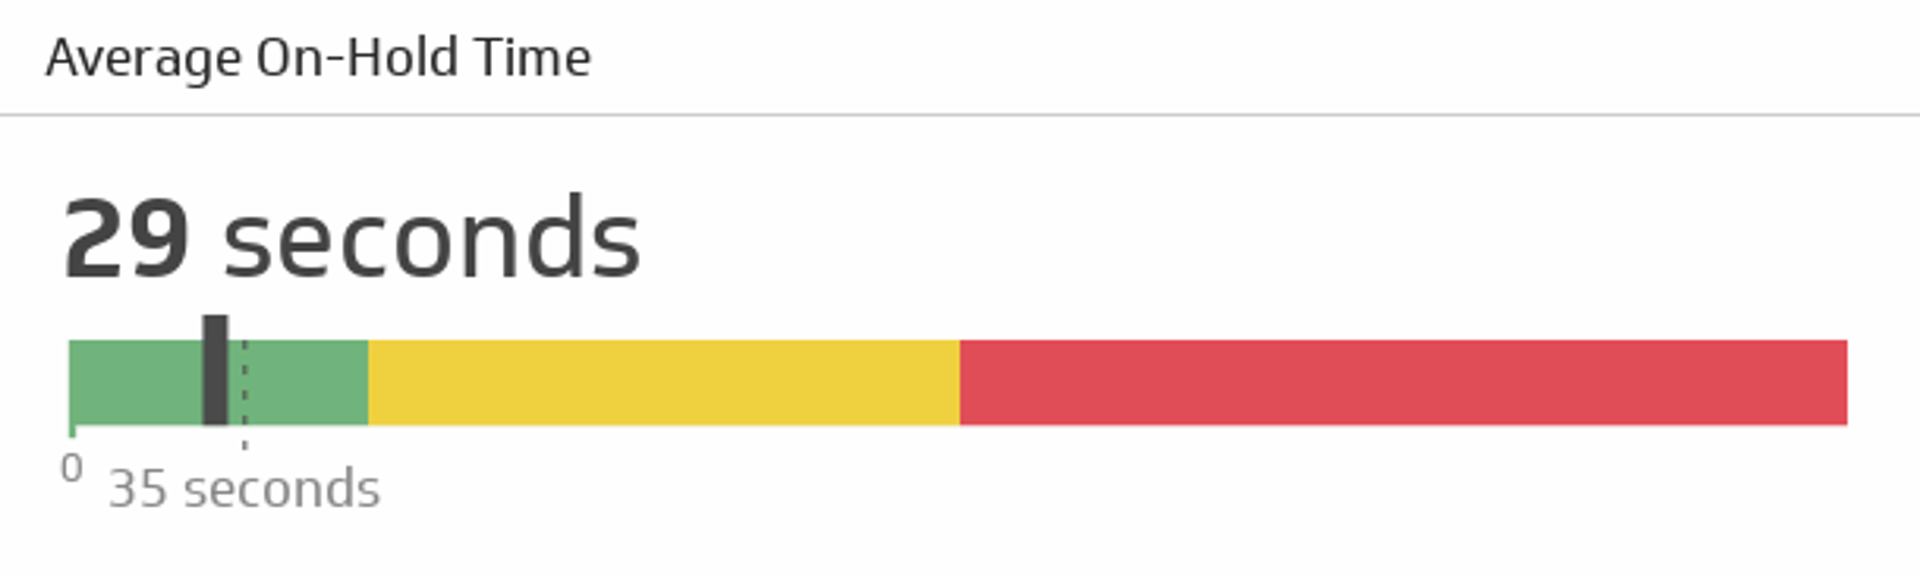
Tracks average time a caller waits before connecting to an agent.
15. Customer Calls Answered in the First Minute
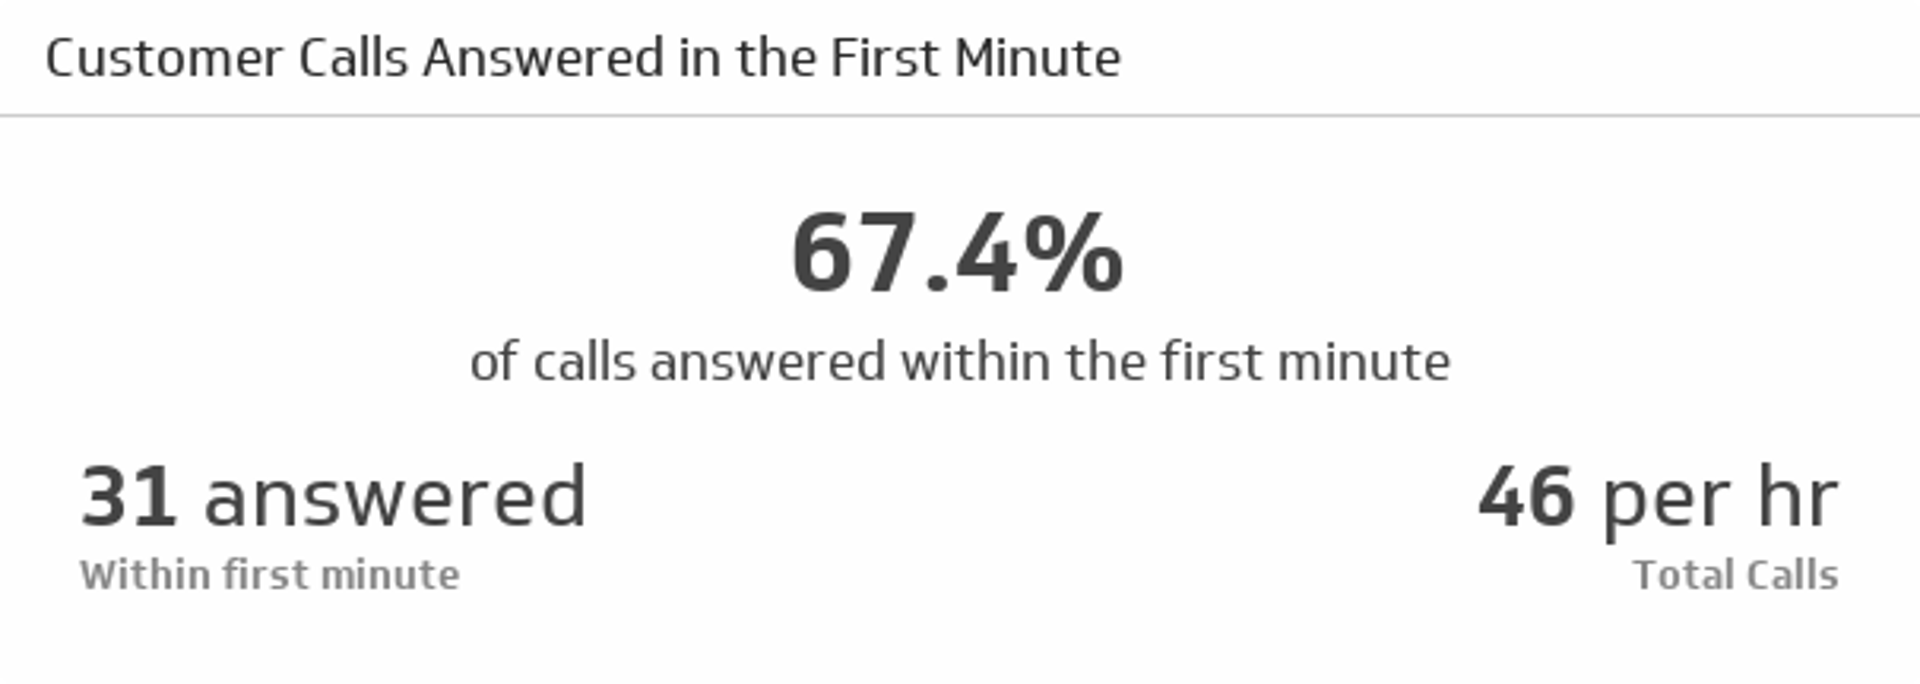
Monitors speed to answer. Align staffing and IVR to reduce early abandonment.
16. Call Arrival Rate
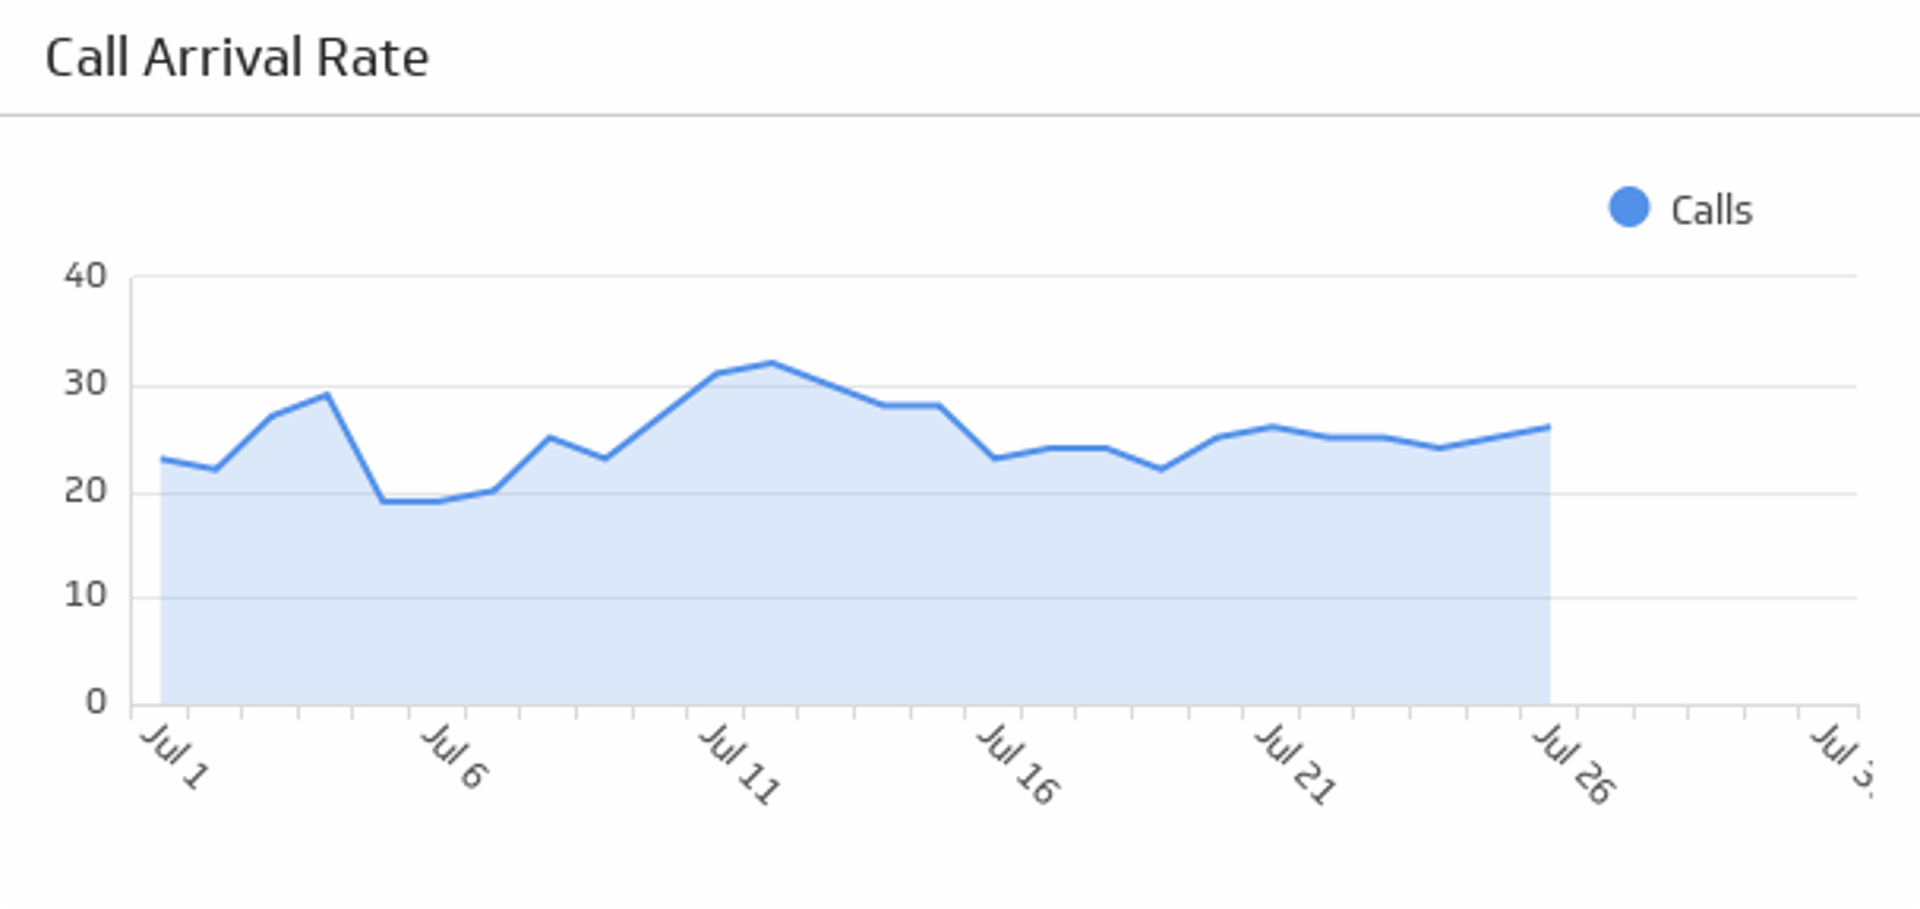
Tracks daily incoming calls over time to spot trends and forecast peaks.
17. Call Resolution
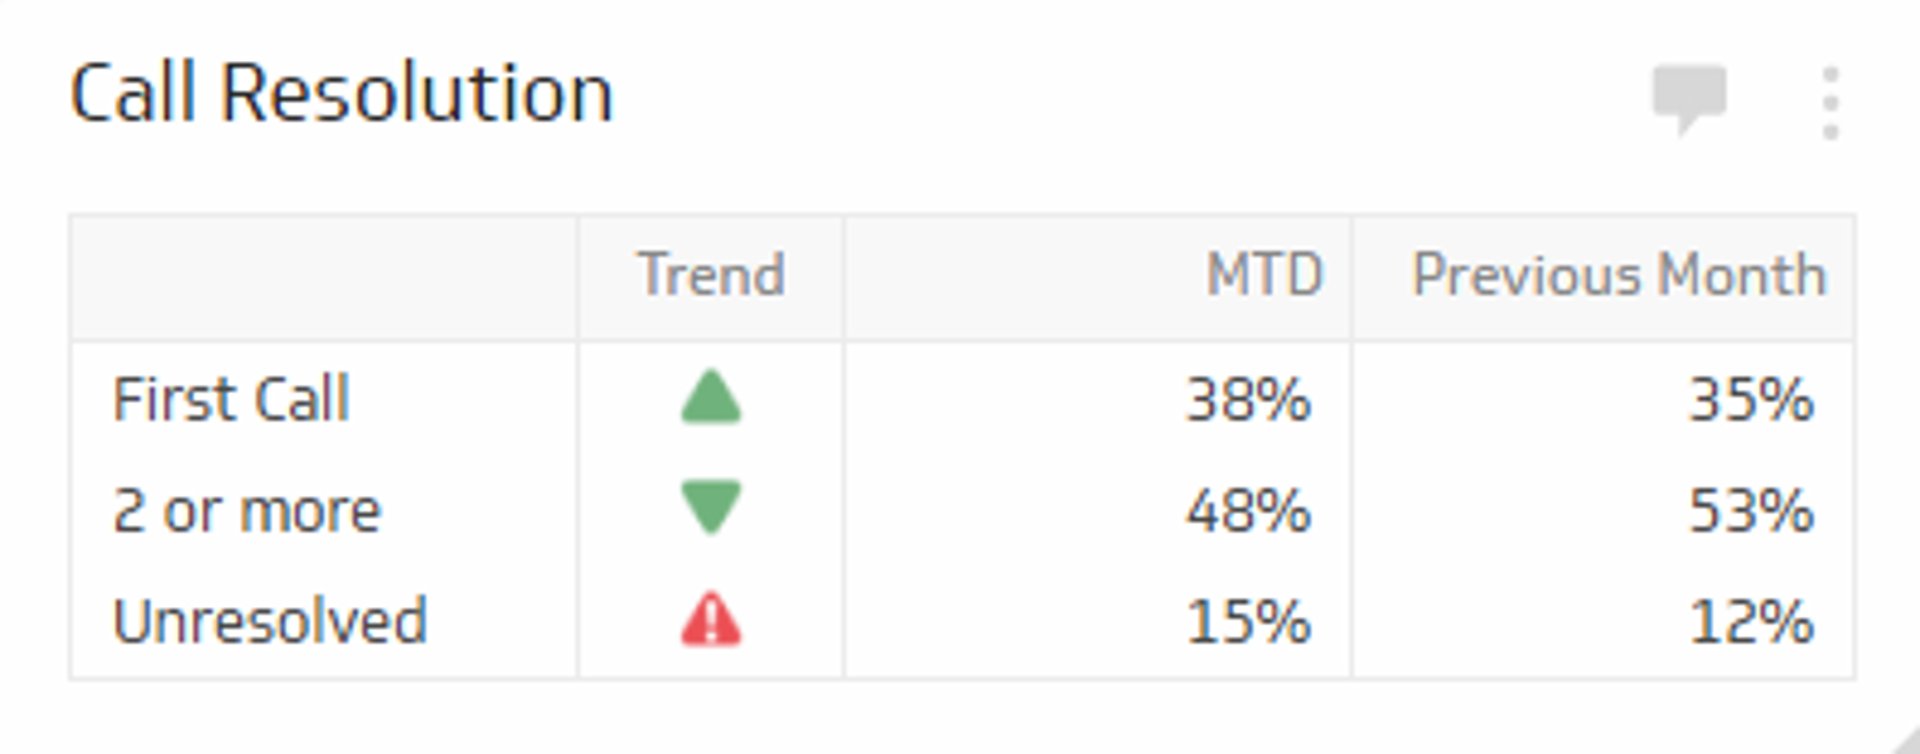
Shows resolution rates, including first contact resolution and repeat contacts.
18. Average Sales per Agent
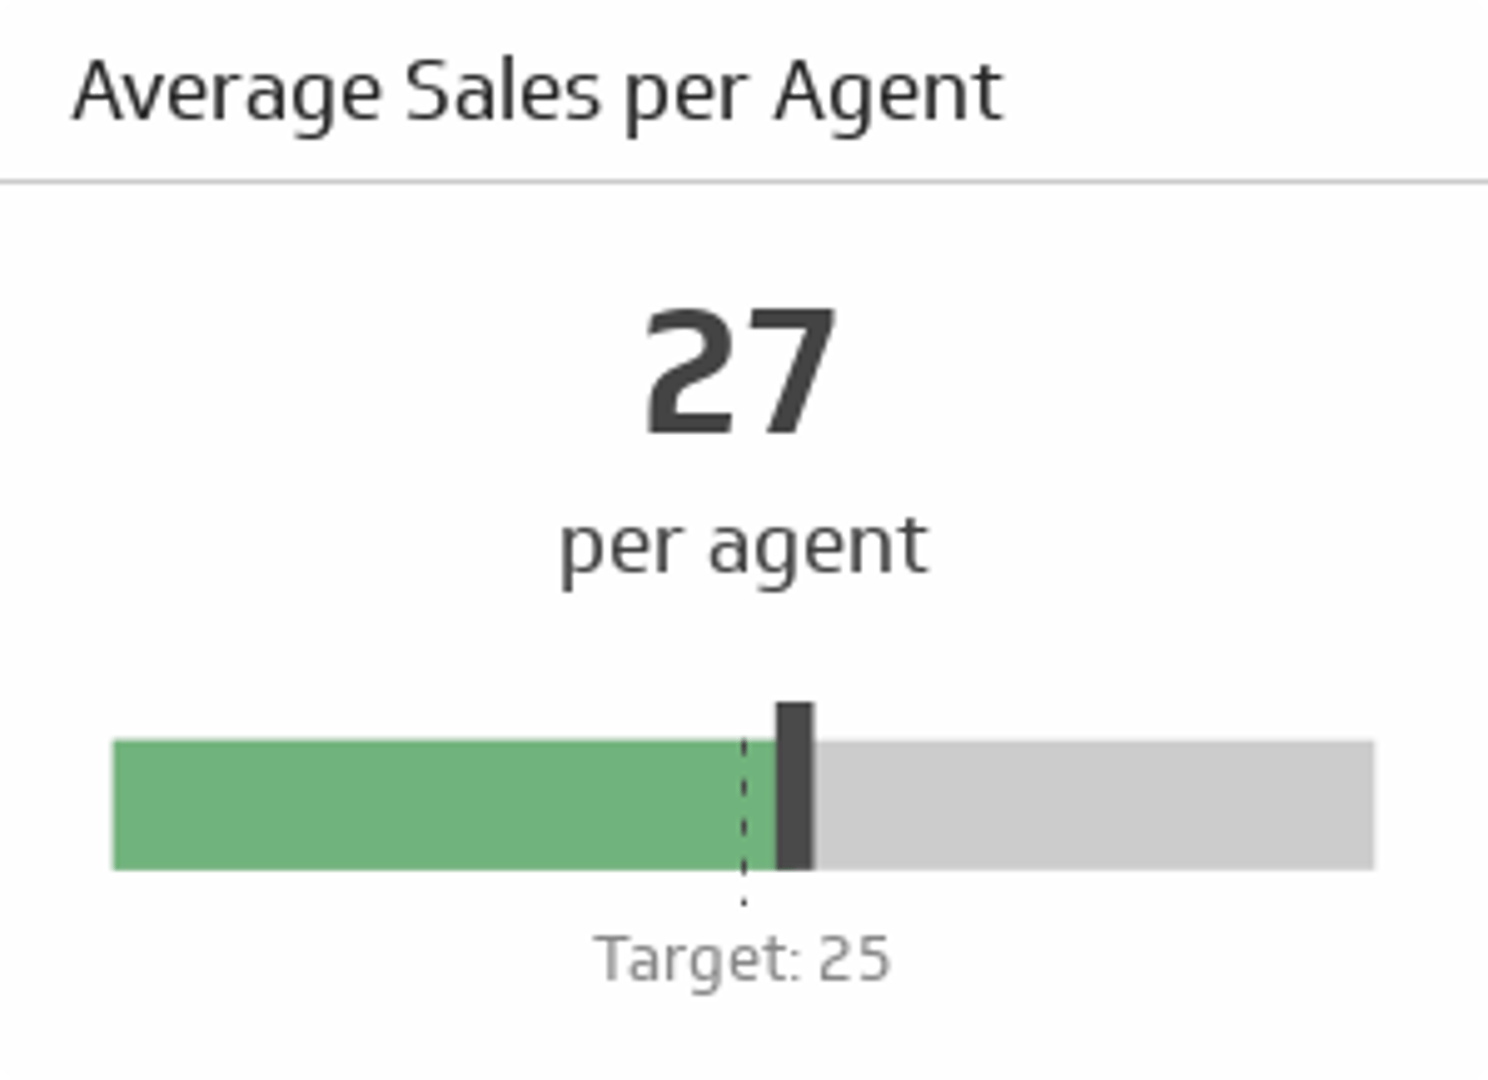
Tracks average sales per agent to gauge effectiveness and inform coaching.
19. Call Setup Success Rate (CSSR)
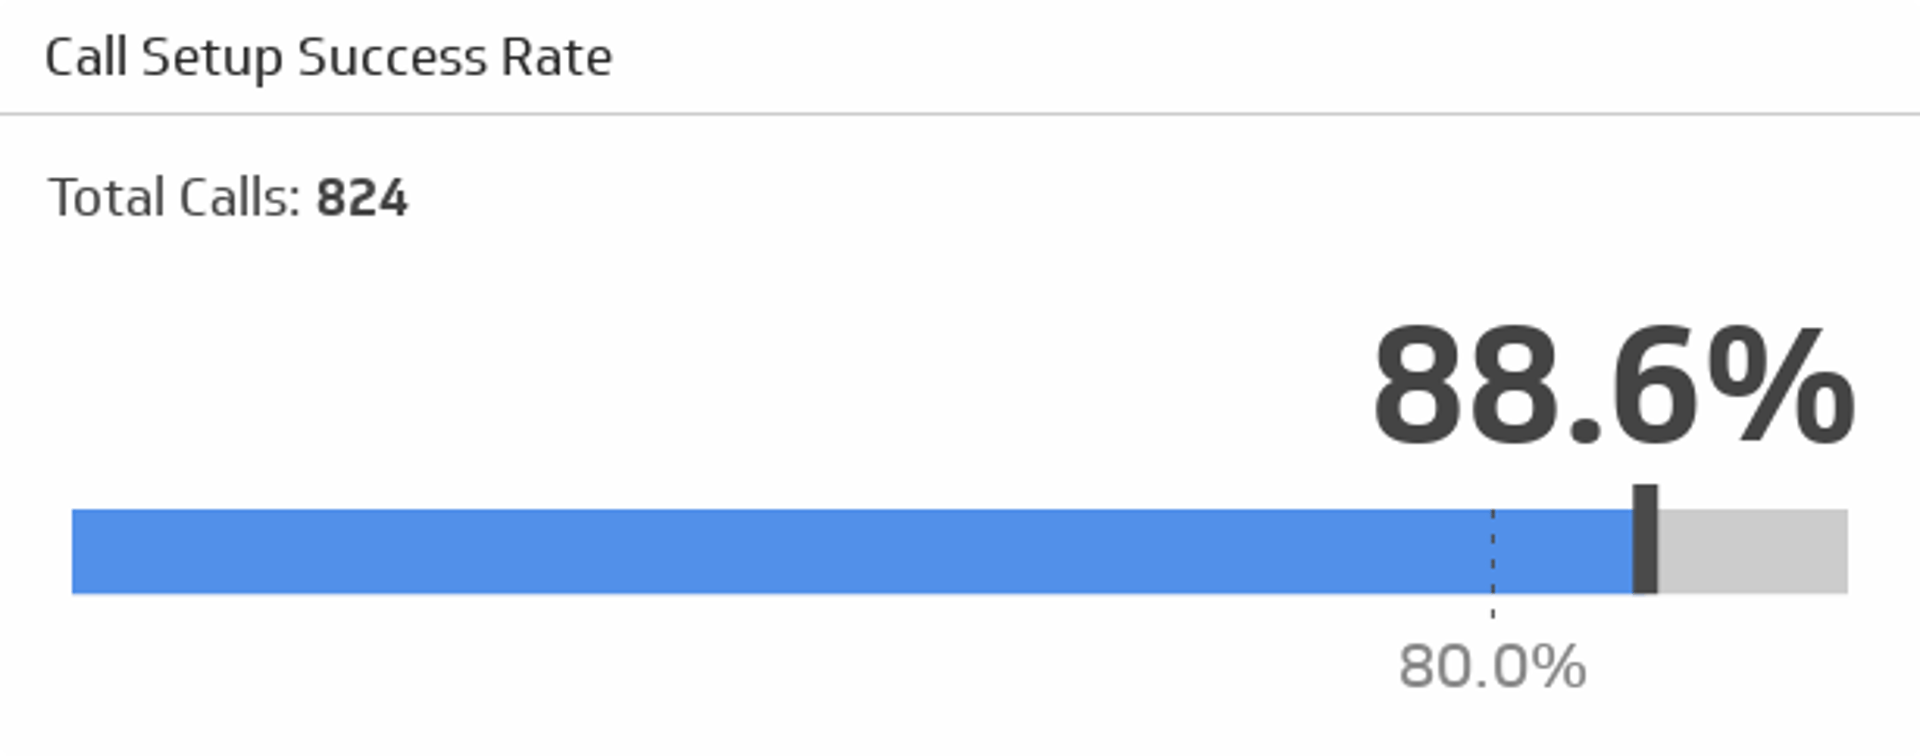
Shows the rate of successful connections. Useful for capacity planning and vendor SLAs.
20. Time Lost Due to Technology Issues
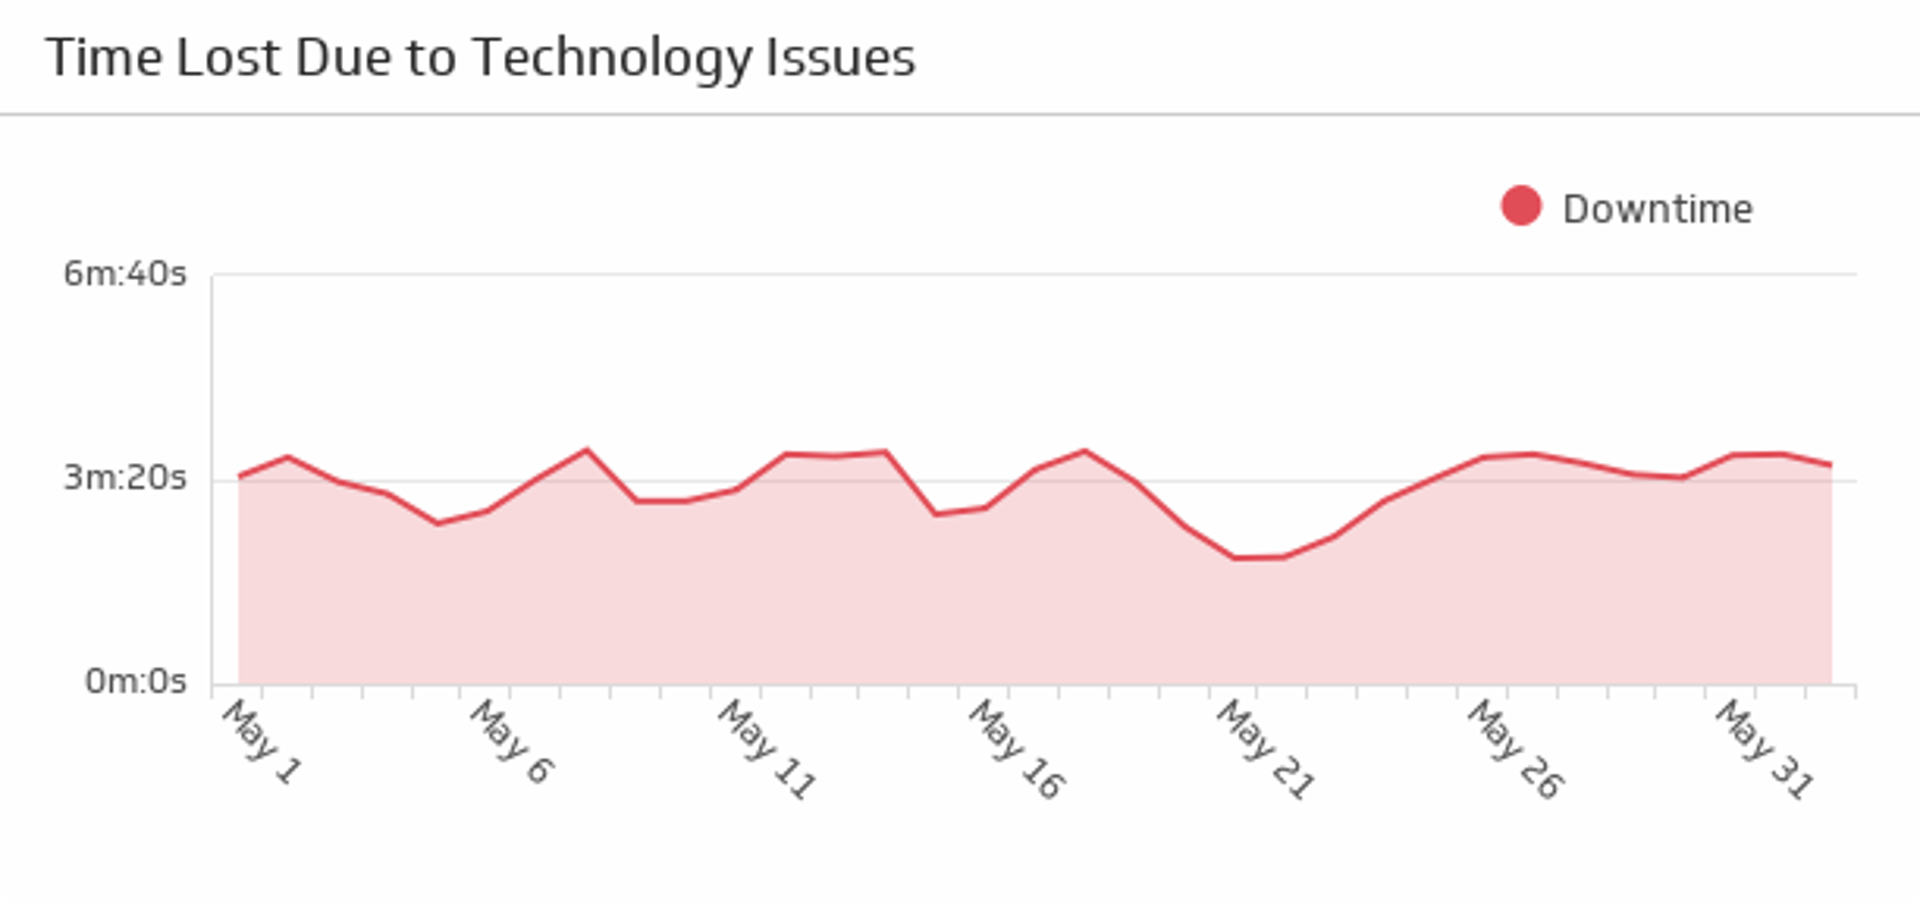
Captures total downtime tied to technology problems so you can fix root causes.
21. Call Arrival Rate (rolling trend)
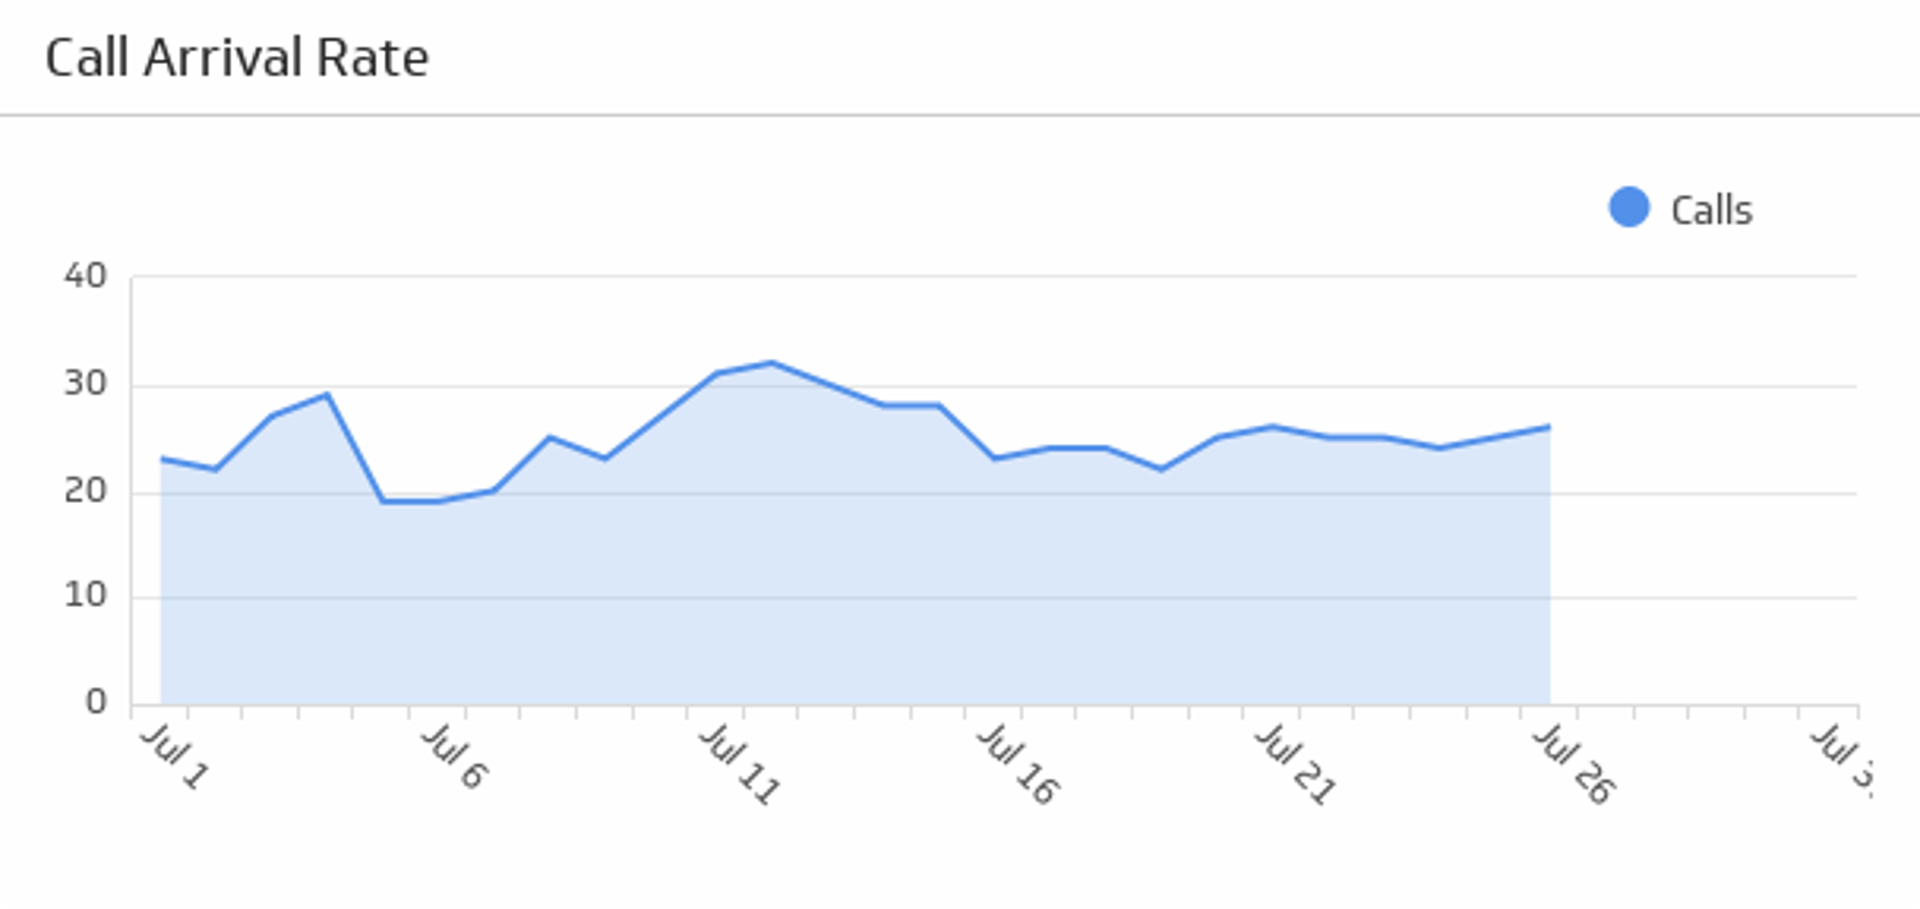
A focused trend view for forecasting and staffing models.
22. Callback Messaging
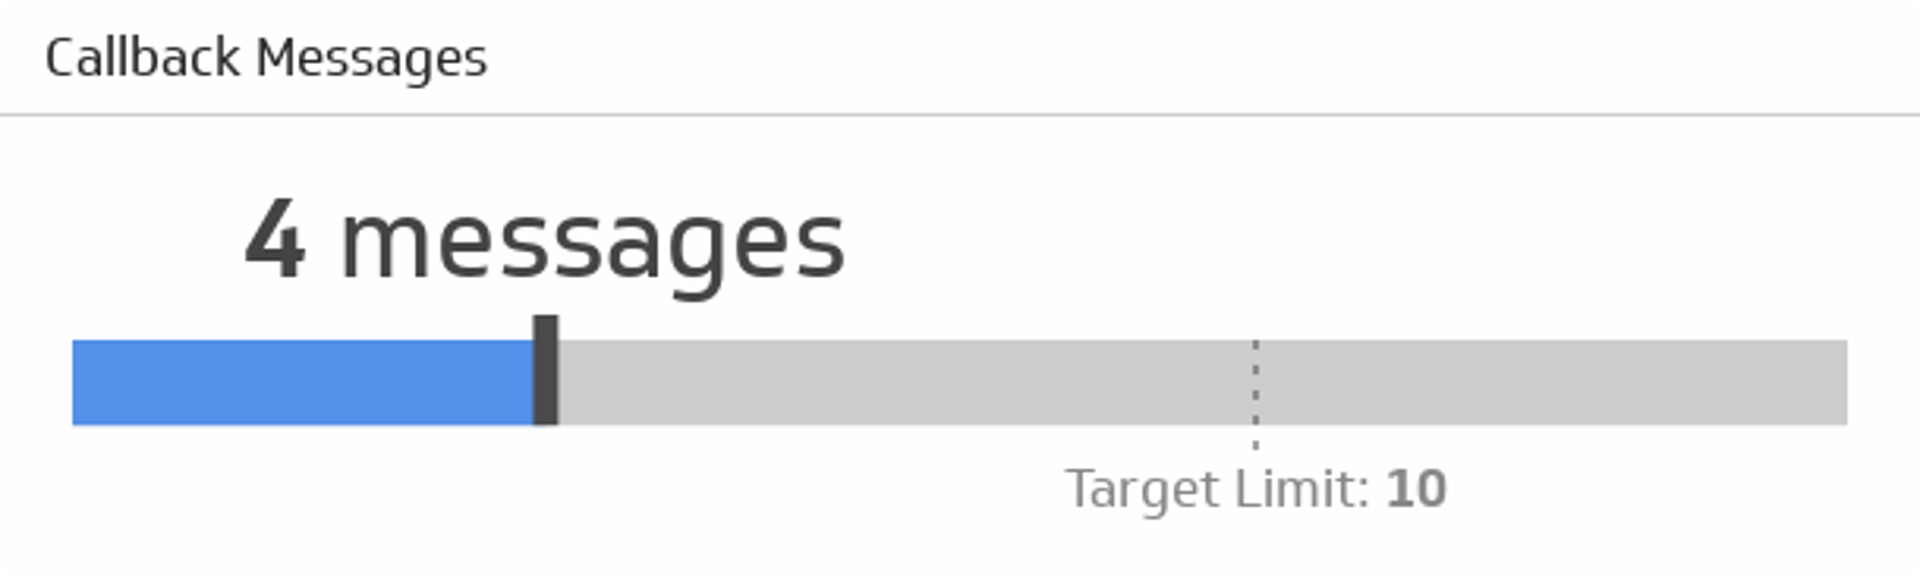
Counts messages requesting a callback. Use it to size follow?up work and protect CSAT.
23. Repeat Calls
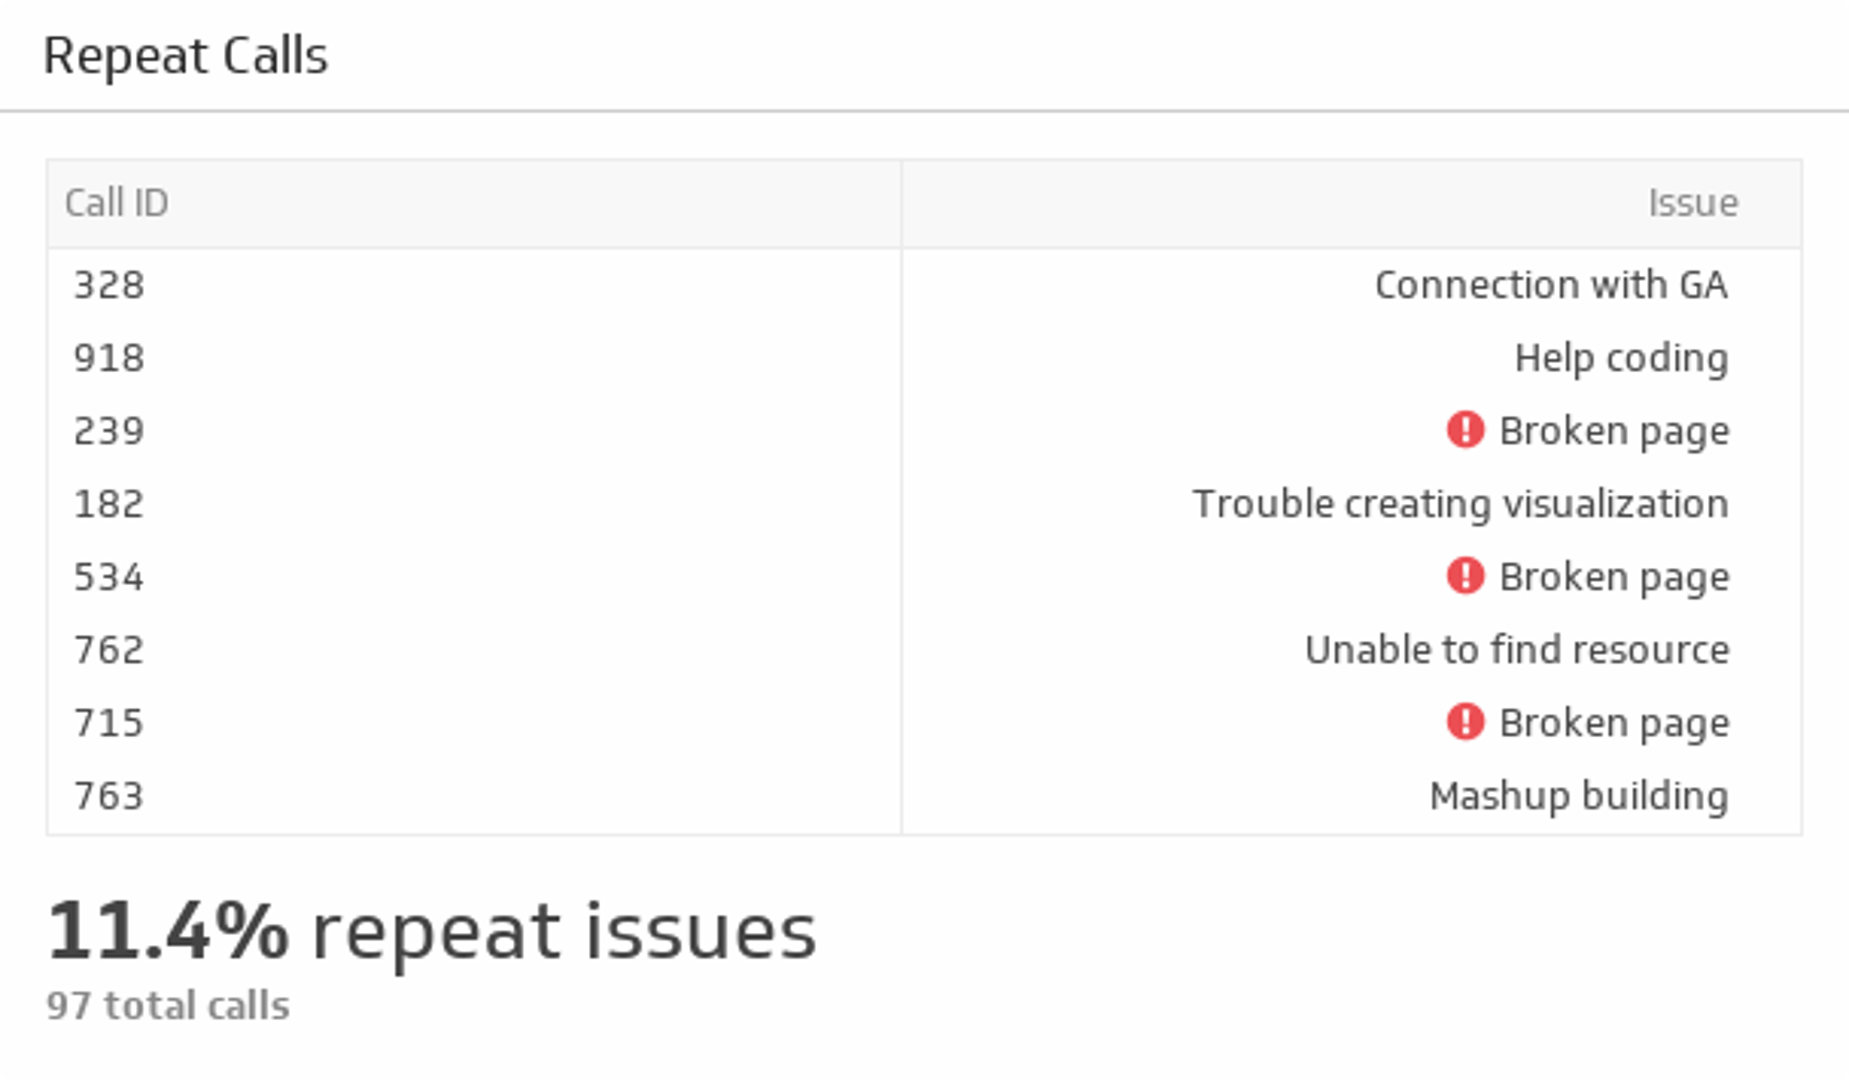
Surfaces recurring issues. Prioritize fixes that remove the largest contact drivers.
24. Agent Utilization

Shows the share of time agents spend on calls or call?related work. Track it with wellbeing and turnover to avoid overloading the team.
Create custom dashboards for you and your team.
Get started with Klips25. Call Completion Rate
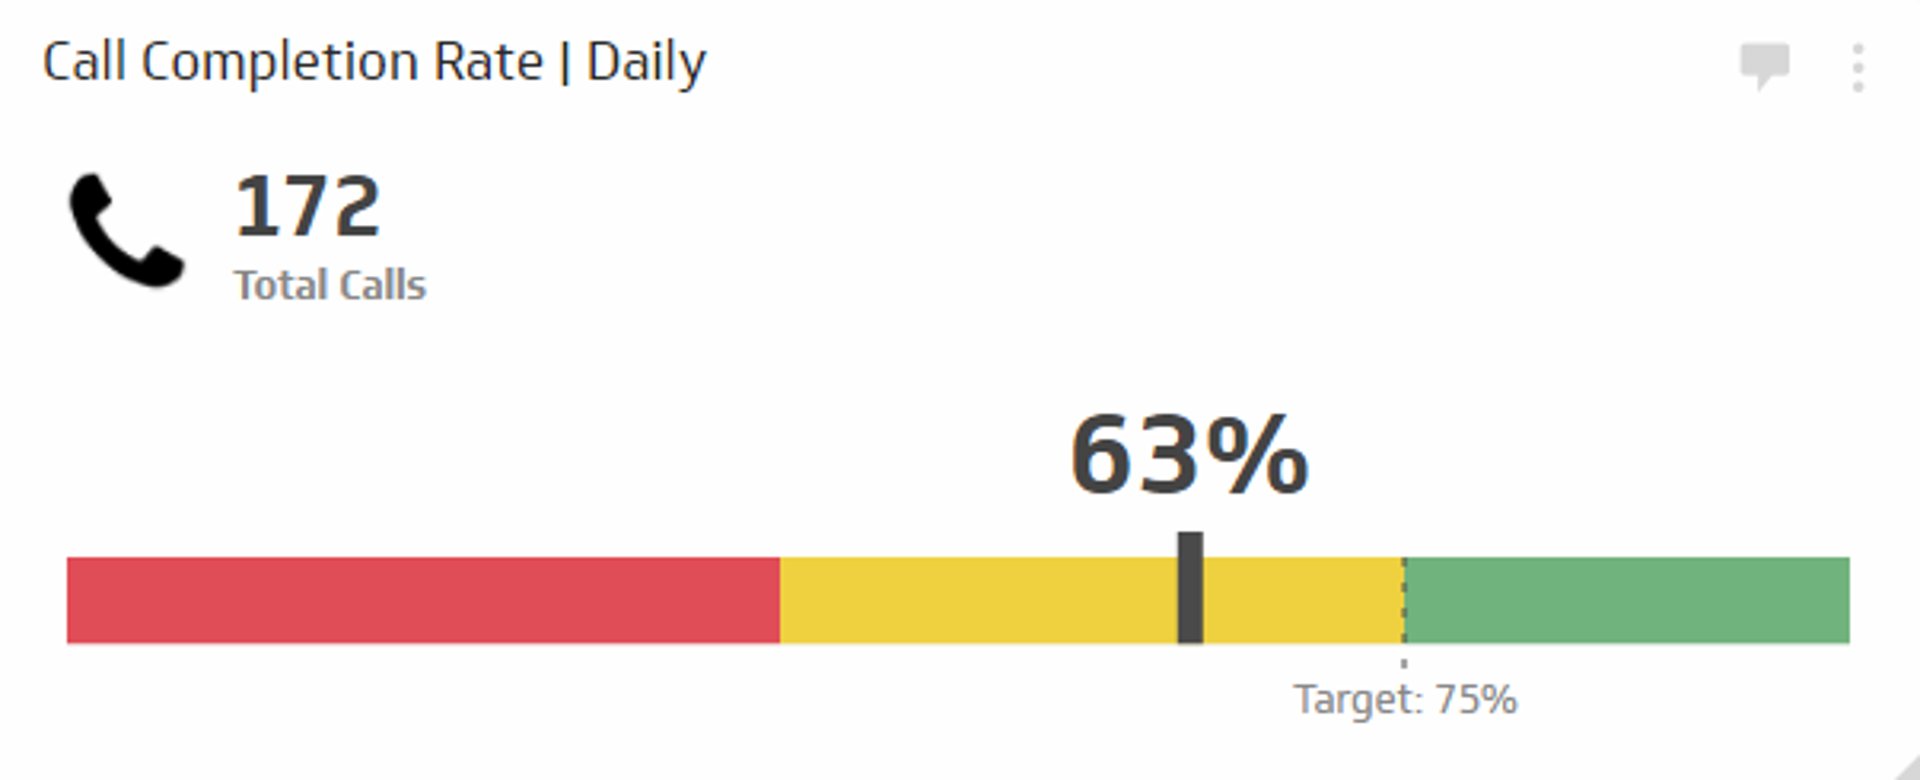
Compares successful connections to failed attempts so you can resolve systemic issues.
Want more call centre KPIs? Explore the full library on KPI Examples.
Track these KPIs live with Klips dashboards, share them on TV or mobile, and schedule email snapshots to your stakeholders.
For more discussion on the metrics that help businesses succeed with data, listen to the Metric Stack podcast.
Published 2026-03-09




Most recent
- AUG 11Beyond simple sign-ups: how True Trials and Activation predict growth
- JUL 7Why business leaders miss important trends in their dashboards
- JUN 19The best chart for the job: Visualizing data for non-technical users
- JUN 95 tips to understand (and organize) your restaurant data
- MAY 26Think in Horizons, Not Seconds
- MAY 2010 Cloud BI Dashboard Tools for Small Businesses in 2026