

The top 12 metrics for social media managers
Get the top 12 KPIs for social media managers to measure the key metrics that will help you answer the question: "How are we doing?" Covers followers, reach, engagement, impressions, shares, views, and subscribers across Facebook, X, Instagram, LinkedIn, and YouTube, plus 10 tactics to increase social media engagement.
Social media is often the first touchpoint consumers have with a company. As platforms multiply and audiences grow, knowing which numbers actually matter is what separates confident reporting from guesswork.
The challenge isn't access to data. Every platform gives you more metrics than you can act on. The challenge is knowing which key social metrics tell you something real about performance, and which ones just fill a slide.
Understanding the right social media KPIs means you can answer "how are we doing?" with clarity, whether you're presenting to leadership, adjusting a campaign mid-flight, or planning what comes next. That answer shouldn't require pulling numbers manually, explaining your business context from scratch, or stitching together reports from five different tabs.
These 12 metrics are a reliable starting point. Most apply across Pinterest, Snapchat, TikTok, and other platforms too.
Followers
Facebook Content Engagement
Facebook Post Likes
Facebook Page Reach
X Mentions
X Reposts
Instagram Account Impressions
Instagram Account Reach
LinkedIn Post Shares
LinkedIn Post Engagement Rate
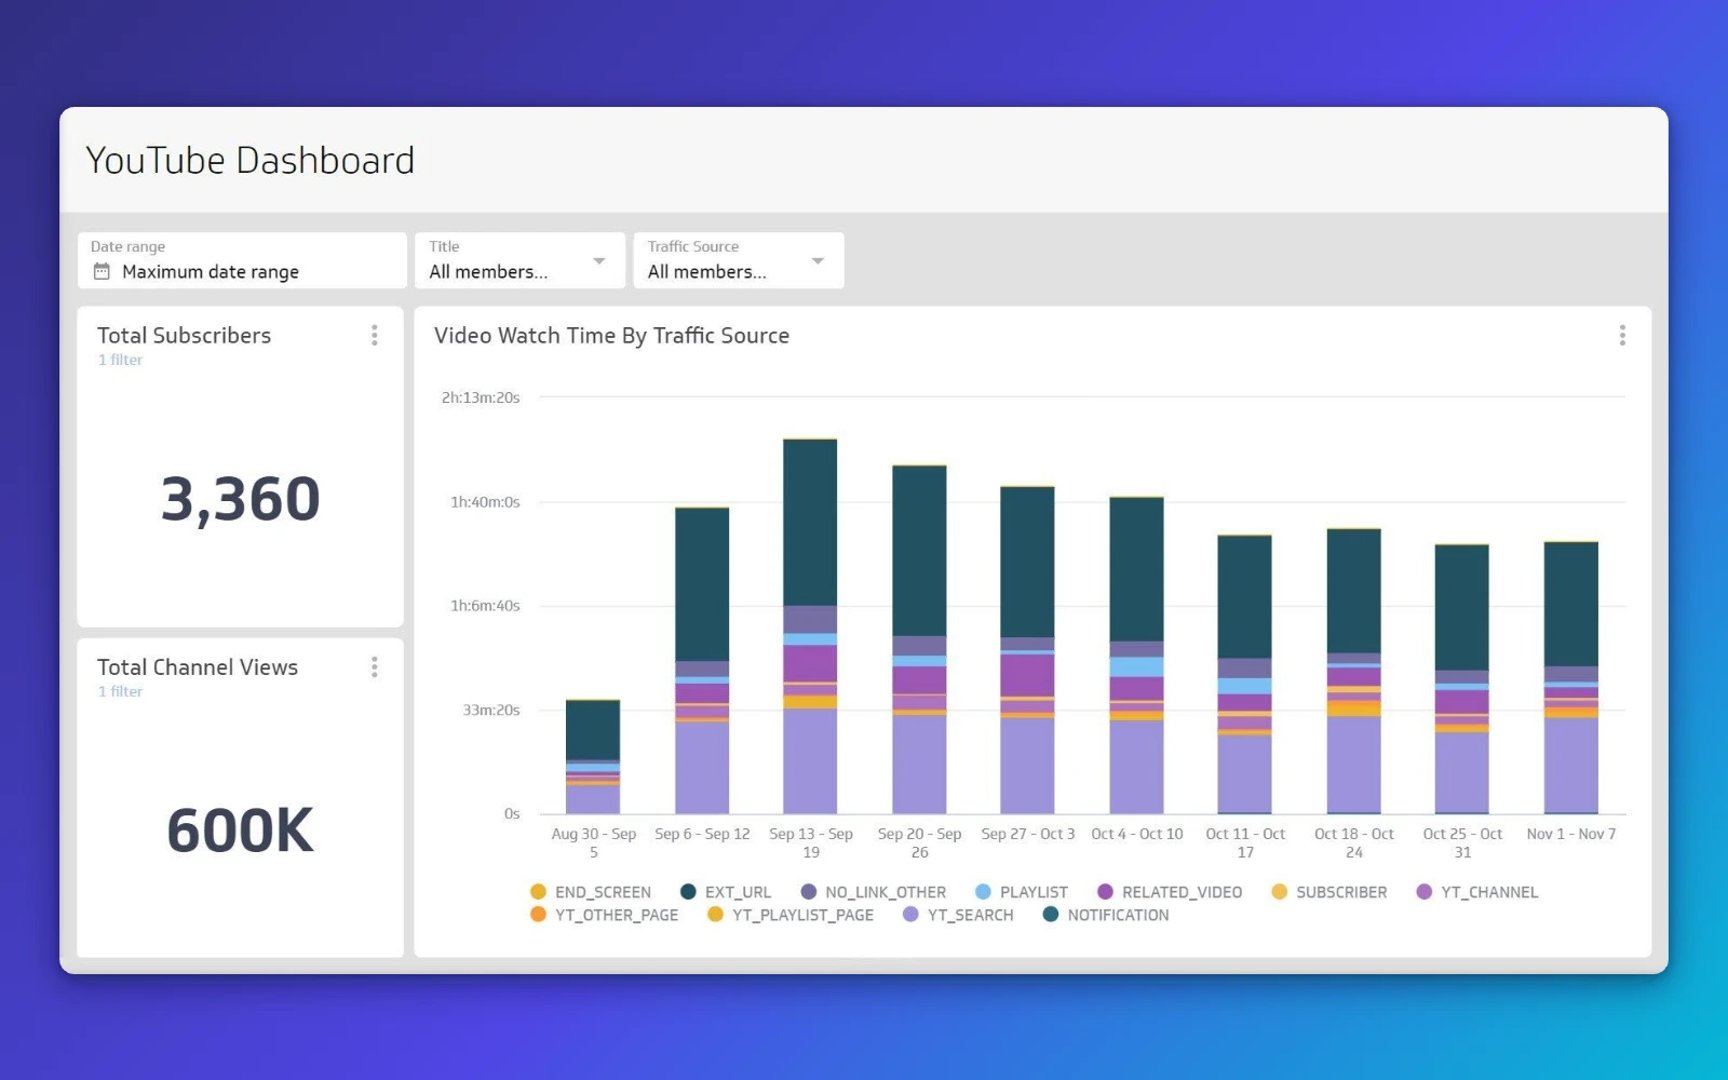
YouTube Video Views
YouTube Subscribers
Why measure social media metrics?
Social media metrics tell you whether your content is reaching the right people, earning their attention, and building momentum for your brand.
The impact of social media marketing is easy to underestimate, especially when results are scattered across platforms. Once you know how to define your organization's KPIs and track them consistently, social media stops being a gut-feel channel and starts being a measurable driver of growth.
The metrics below give you that consistency. They also make it easier to spot what's working without waiting for someone to pull a report.
The top 12 social media metrics for social media managers
1. Followers
Followers applies across LinkedIn, Facebook, X, and Instagram. It measures the total number of people who follow your account or page. At a glance, it tells you the size of your potential audience on each platform and how that audience is growing over time. Track it consistently and you'll know whether your content strategy is expanding your reach or holding steady.
2. Facebook Content Engagement
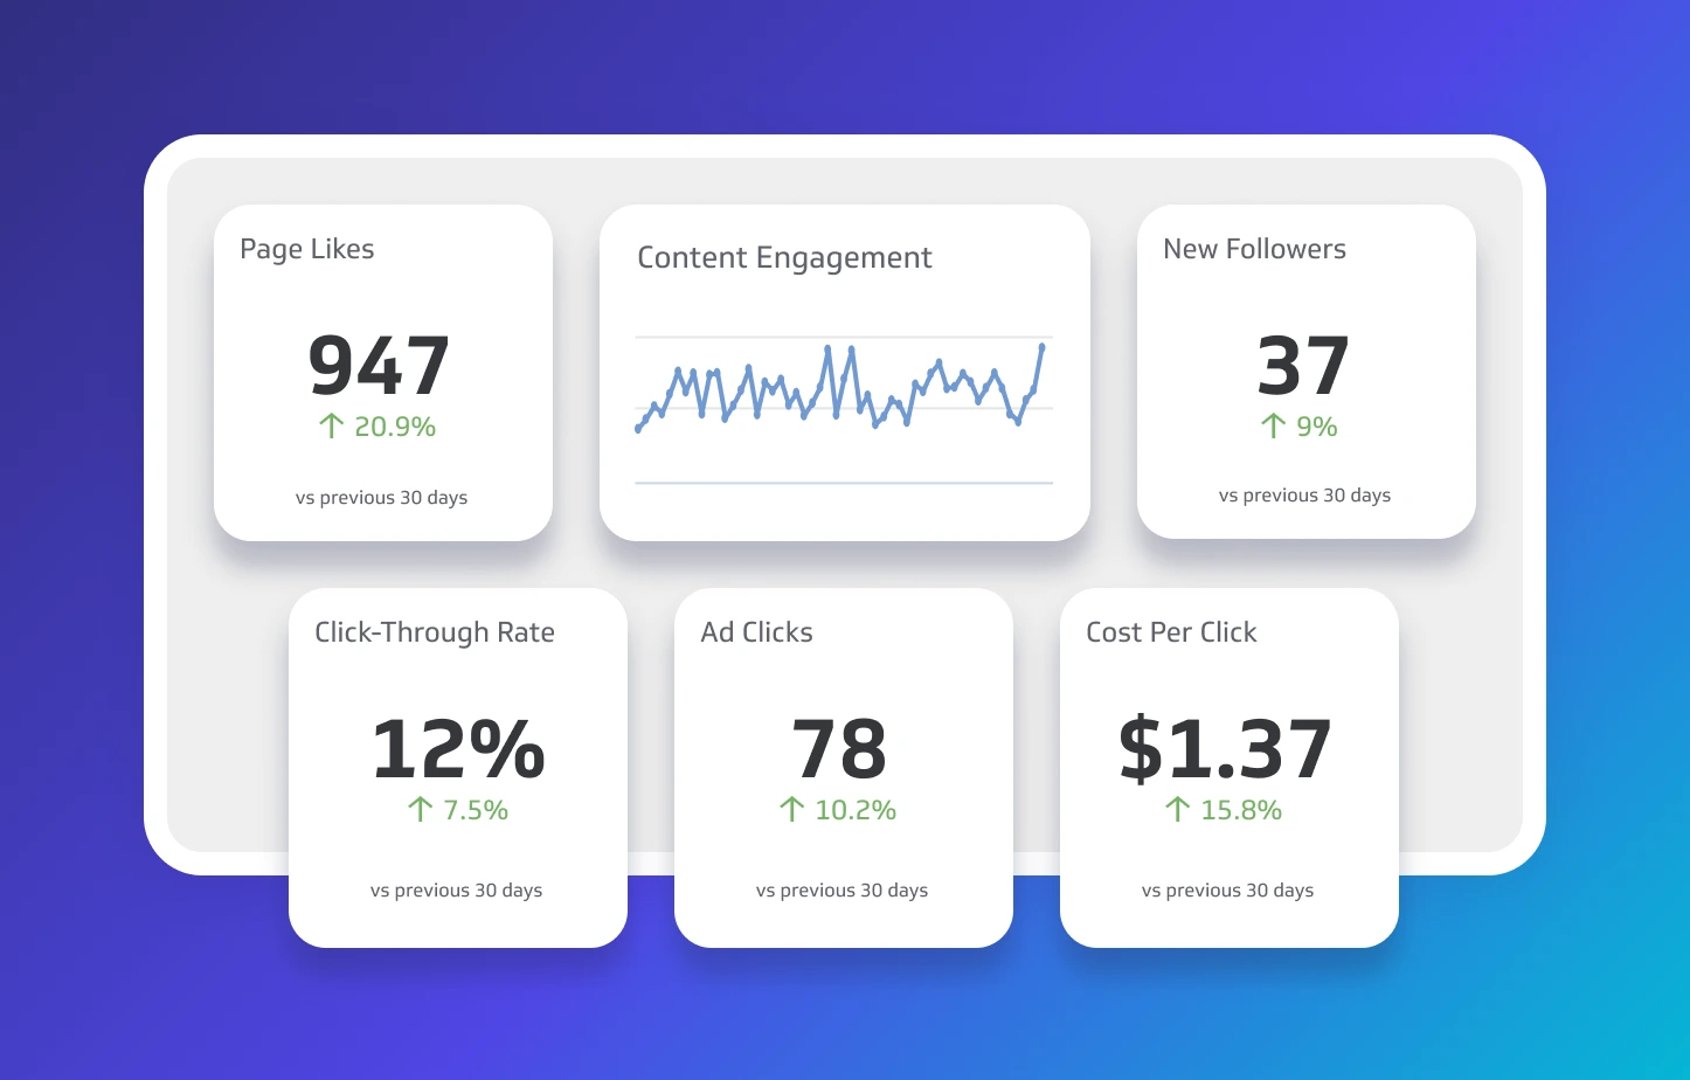
Content engagement captures all interactions on your Facebook page: likes, shares, and comments. It shows not just how many people saw your content, but how many did something with it. Tracking engagement over time reveals which content types earn real attention and which ones scroll past unnoticed.
3. Facebook Post Likes
Facebook post likes are a quick signal of how your content lands with your audience. With billions of daily active users on the platform, not every post reaches every follower. Likes help you identify which content resonates and give you a read on sentiment without waiting for a full engagement breakdown.
4. Facebook Page Reach
Page reach counts the number of unique users who saw your content. A growing reach means your content is moving beyond your existing followers, which tends to lift engagement rates and build social proof over time. Track it alongside engagement to understand whether your audience is growing and responding.
5. X Mentions
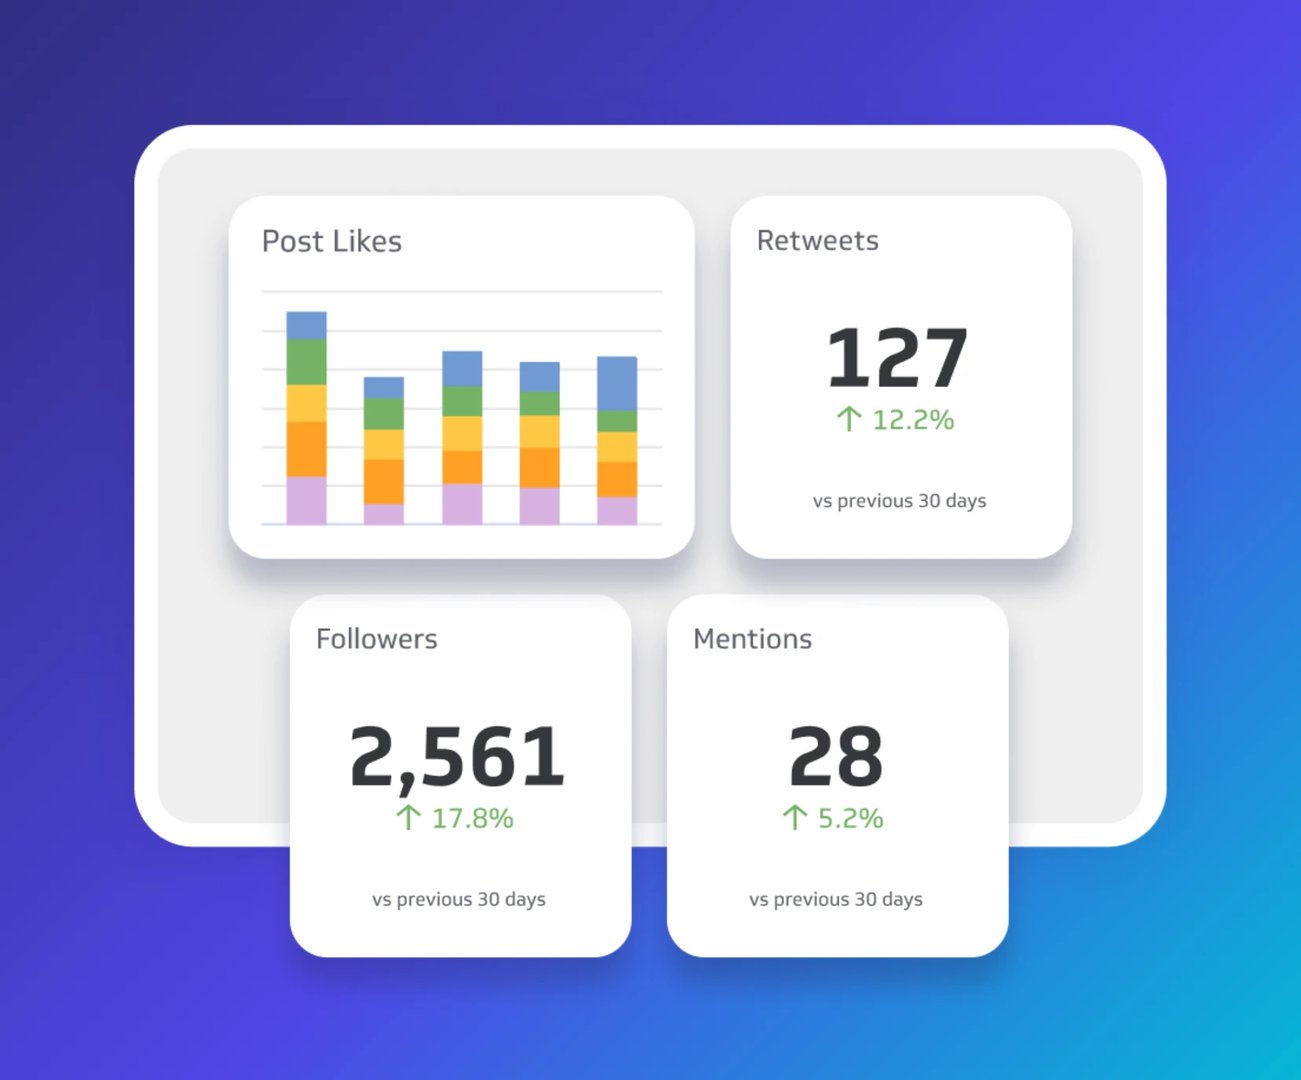
X mentions track who is talking about your brand in real time via the @ function, branded hashtags, or plain text references. For example, we track #MetricStack to monitor conversations about our podcast and newsletter. Mentions let you respond in the moment, stay visible in relevant conversations, and build customer loyalty by showing up when people talk about you.
6. X Reposts
Reposts count how many people reshared your content to their own timelines. Each repost extends your reach to an entirely new audience without any additional effort on your part. A high repost count is a reliable signal that your content is worth sharing, which is one of the clearest indicators of audience trust.
7. Instagram Account Impressions
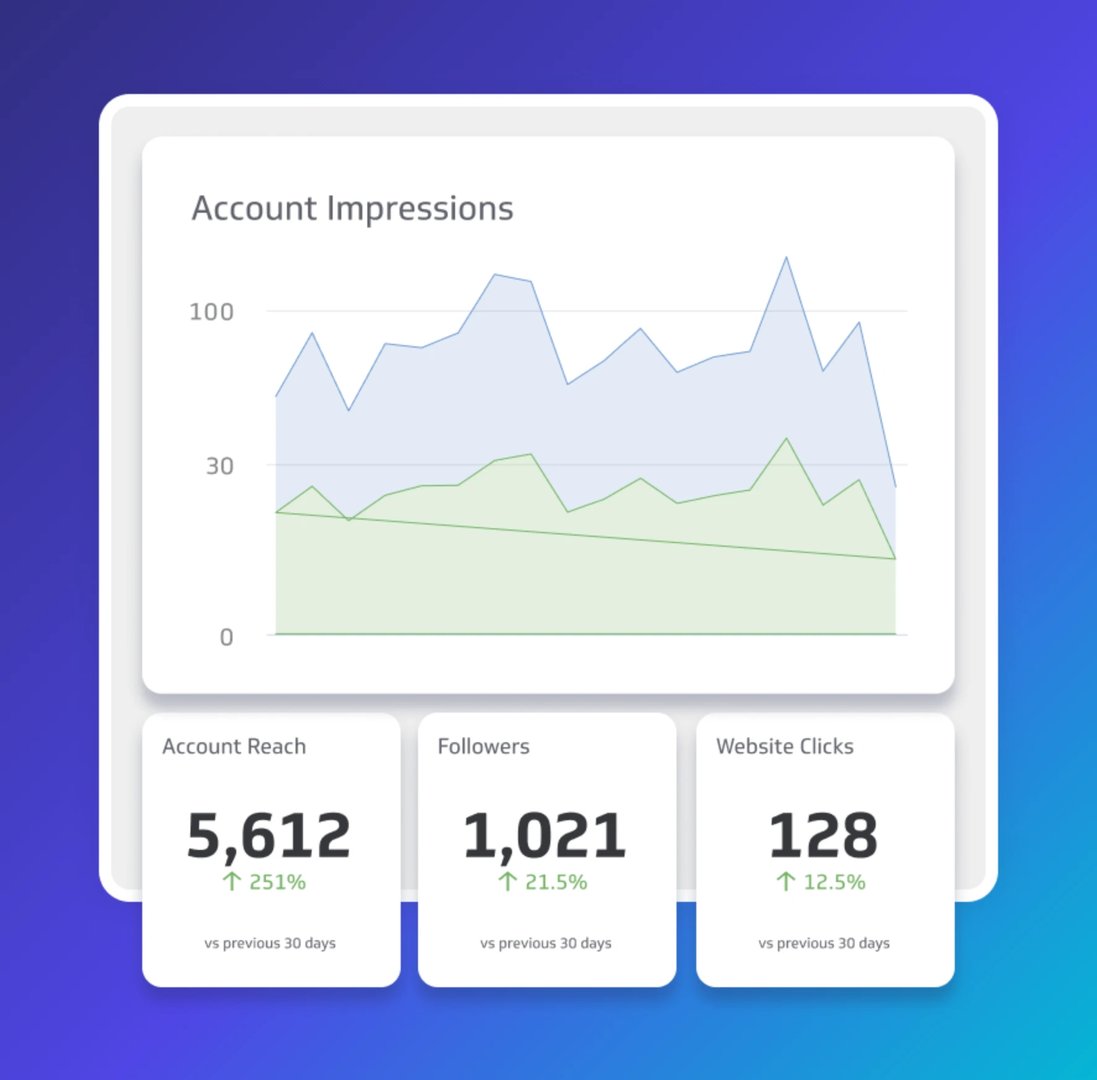
Account impressions give you a holistic view of how often your content is being seen across all posts and ads. It's an indicator of overall account visibility and content popularity. Track impressions alongside reach to understand the difference between how often your content appears and how many unique people it reaches.
8. Instagram Account Reach
Account reach counts the total number of unique accounts that saw your content. Unlike impressions, reach doesn't count the same person twice. It's the metric that tells you how far your content is travelling beyond your existing followers, and whether certain content types are helping you grow into new audiences.
9. LinkedIn Post Shares
Post shares measure active engagement: a follower didn't just scroll past or tap a like, they put your content in front of their own network. That's a meaningful signal. Track shares over time to understand what your audience considers worth passing on, and use that insight to shape future content.
10. LinkedIn Post Engagement Rate
Post engagement rate is the ratio of total interactions (likes, comments, and shares) to your total follower count. It tells you how effectively your content is connecting with your audience, not just how many people saw it. Compare month-over-month to identify trends and spot which post formats consistently outperform.
Learn more about LinkedIn Analytics
Create custom dashboards for you and your team.
Get started with Klips11. YouTube Video Views
Video is now one of the primary ways people consume information, and YouTube is where a large share of that happens. Video views counts how many times a specific video has been watched. Pair it with minutes watched or average view duration to understand not just whether people clicked, but whether they stayed.
12. YouTube Subscribers
YouTube calls its followers subscribers. This metric tracks the total number of users who have subscribed to your channel. Subscriber growth tells you whether your video content is building a loyal audience over time, and sets the baseline for how many people your next video can reach from the moment it goes live.
How to increase social media engagement
Tracking these metrics is the first step. Acting on them is where results come from. These 10 tactics will help you move the numbers that matter.
1. Go niche
Brands often chase relevance by commenting on topics outside their lane. A clothing brand posts about TV shows. A food brand weighs in on tech trends. The result is diluted messaging and a confused audience.
Going niche works better. When your content consistently covers one subject area, your audience knows exactly what they're getting from you. That clarity builds trust, and trust drives engagement. Whether your focus is business advice, product inspiration, or industry news, establish your brand as the go-to place for that subject and your audience will keep coming back.

2. Be useful
Useful content doesn't just answer questions after someone asks them. It surfaces answers before the question forms.
What that looks like depends on your product or service, but useful content formats include:
Practical tips or hacks your audience can act on immediately
Live sessions that let people ask questions in real time
Behind-the-scenes previews that build familiarity and trust
Creative uses for your product or service
Q&A sessions that address real objections
Social proof in the form of results from previous customers
Providing information your audience can actually use establishes your brand as an authority, keeps your content relevant, and gives people a reason to engage rather than scroll past.
3. Review your insights
Knowing what's working is more valuable than guessing what might. If you're not reviewing your analytical data regularly, you're likely putting energy into the wrong places.
Audiences shift. The customer persona you defined last year may no longer reflect who's actually engaging with your content. Regular data reviews help you spot those changes early, so you can adapt before your engagement drops.
Look beyond reach and follower counts. Dig into which content formats, topics, and posting times generate the most interaction. That's the information that tells you what to do next, not just what happened.

4. Don't be afraid to experiment
Some tactics hold up over time. Many don't. The pace of change in social media means what worked last quarter may already be stale, and what seemed risky six months ago might be exactly what your audience wants now.
Experimentation doesn't have to mean overhauling your strategy. Host a live discussion on Instagram. Invite a follower behind the scenes. Try a format you've never used. Small tests reveal big insights.
The one rule: don't force your brand onto a trend just because it's popular. Every experiment should still connect back to tip 1. Relevance matters more than novelty.
5. Use all of social media's features
Social platforms add new features constantly, and most brands use only a fraction of what's available.
Instagram alone now supports stories, reels, carousels, live video, polls, stickers, Q&A prompts, countdown timers, and shopping integrations. Each of these is an opportunity to engage your audience in a different way, not just broadcast to them.
The brands that earn the most engagement are the ones that treat these tools as conversation starters, not just content formats. Experiment and find the features your audience actually responds to.
6. Set SMART goals
Posting without a goal is just noise. Every piece of content you publish should connect to something you're trying to achieve, whether that's opening a new communication channel, increasing conversions, or driving traffic to a specific page.
That means setting SMART goals: specific, measurable, actionable, realistic, and time-bound.
Without that structure, you can't tell whether your social media effort is working. And without that clarity, you can't make confident decisions about where to invest next.

7. Make your content accessible
Accessibility isn't just a best practice. It's how you signal to a wider audience that your content is meant for them.
A few straightforward changes make a meaningful difference:
Add subtitles to every video
Write alt text for every image you upload
Caption your stories rather than relying on audio alone
Include audio descriptions alongside visual content
Accessible content expands your reach to audiences who would otherwise scroll past, and it shows your audience you value them.
8. Start a discussion
People engage with content that invites them in. Giving your audience a chance to share their opinion, vote on something, or see their feedback reflected in your content creates a sense of participation that passive posts never will.
Ways to get the conversation going:
Polls that surface what your audience actually thinks
Q&A sessions that address real questions
Competitions that reward participation
Interviews that bring in outside perspectives
Requests for feedback that show you're listening
Sharing user-generated content, such as photos or posts featuring your product
Any of these creates a direct line between your brand and the people who follow it. That's where real engagement comes from.
9. Optimize your posting times
Most analytics dashboards will tell you your audience is most active in the morning, at lunch, and in the evening. That's true for most brands, which is exactly the problem.
If you post at 7 am on a Tuesday because the data says that's peak activity, so do a hundred other brands. Your content competes in a crowded window instead of standing out in a quieter one.
Experiment with posting times beyond the obvious peaks. Test different days, different hours, and different time zones if your audience spans regions. Use a LinkedIn Analytics tool to track which post times generate the strongest engagement rates, then adjust from there. The sweet spot for your specific audience is rarely the same as the industry average.
10. Invest in your social media strategy
Social media managers are community managers and data analysts, and the quality of your social presence reflects the resources behind it.
Building a strategy that actually works takes time, skill, and ongoing attention. That means being willing to invest in the team responsible for it.
What that investment looks like will vary. It might mean hiring someone with deep platform expertise. It might mean training, better tools, or carving out time for your team to stay current by reading authority blogs and testing new approaches. Whatever form it takes, teams with the right resources consistently outperform those running on instinct alone.
Create custom dashboards for you and your team.
Get started with KlipsSee your social metrics in one place
Tracking these metrics across platforms is manageable. Tracking them manually, across tabs, every week, is not.
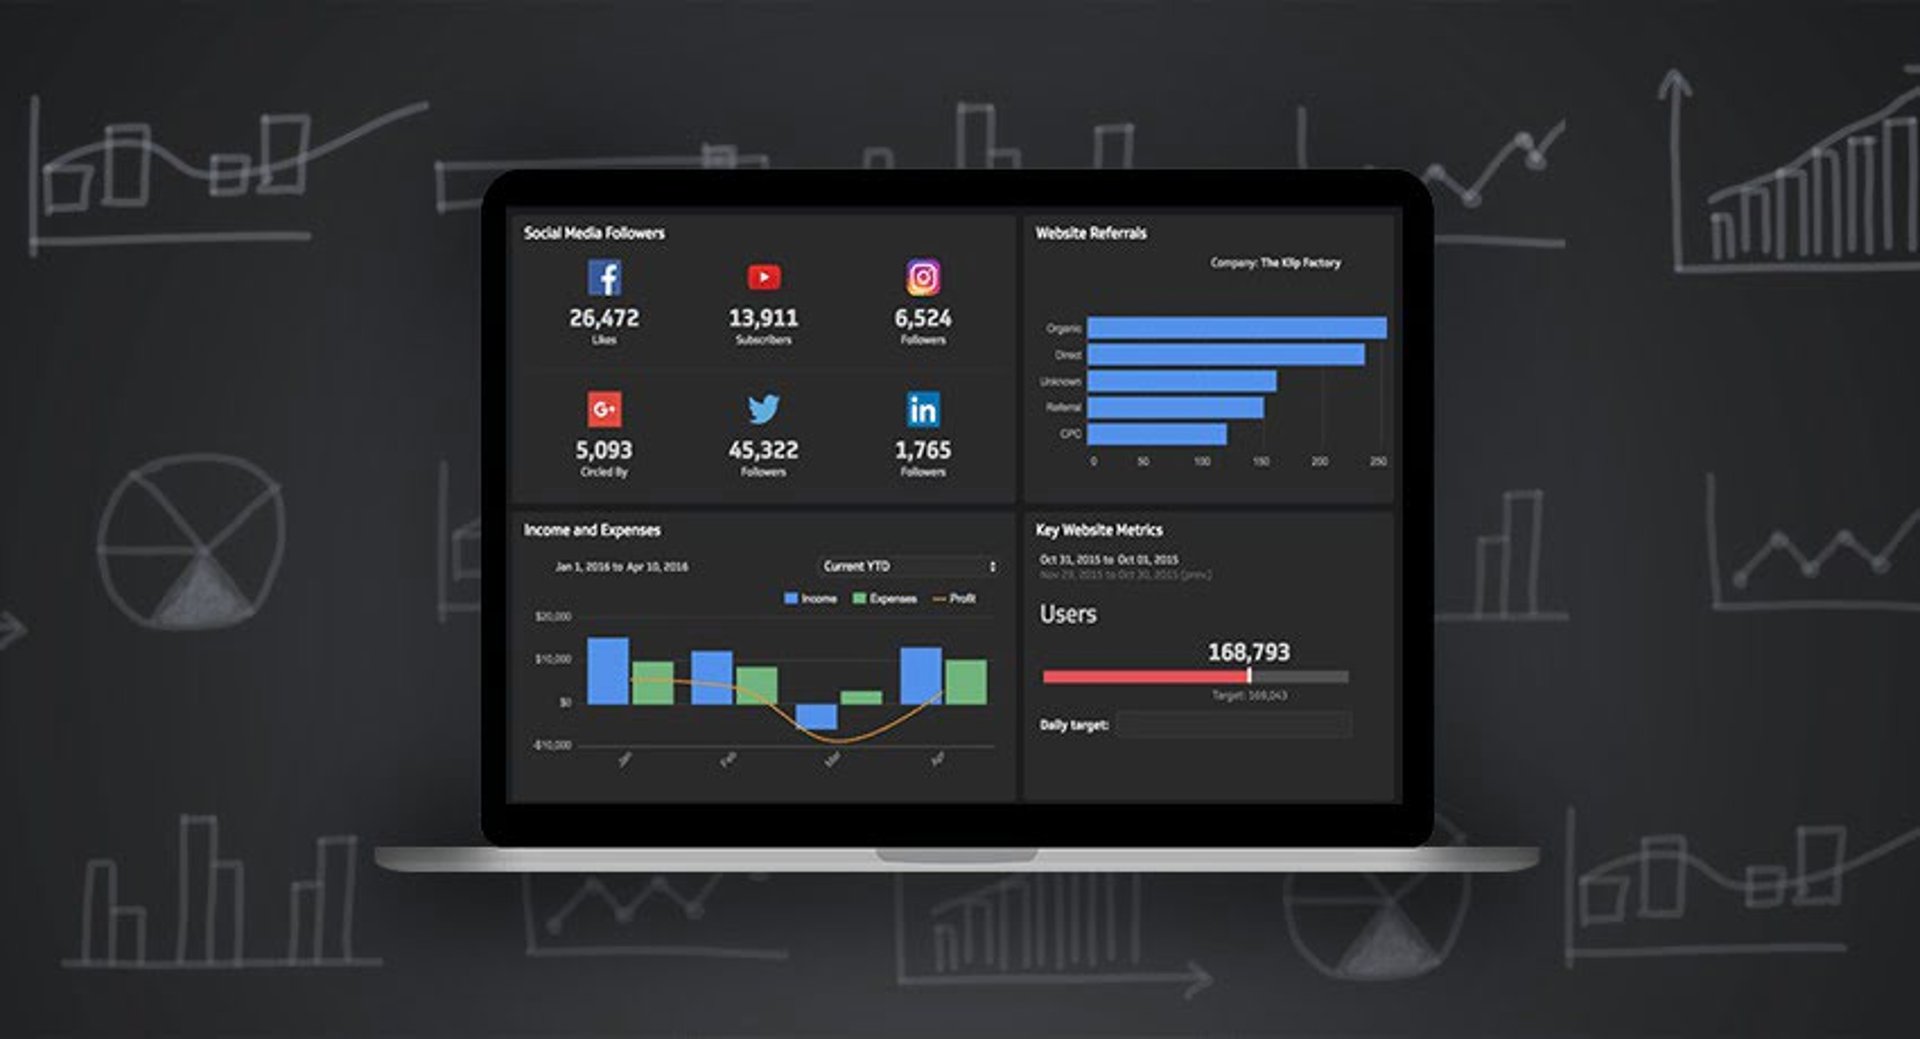
A real-time social media dashboard pulls everything into one view, so you know where things stand without having to go looking. The numbers are consistent, current, and ready to share, whether that's with your team, your leadership, or a client.
For a deeper look at building your social strategy around the right KPIs, read How to Establish the Best Social Media KPIs. You'll find more guidance on choosing social media metrics that match your goals, not just your platform defaults.
Also see
Published 2026-08-26


Most recent
- AUG 11Beyond simple sign-ups: how True Trials and Activation predict growth
- JUL 7Why business leaders miss important trends in their dashboards
- JUN 19The best chart for the job: Visualizing data for non-technical users
- JUN 95 tips to understand (and organize) your restaurant data
- MAY 26Think in Horizons, Not Seconds
- MAY 2010 Cloud BI Dashboard Tools for Small Businesses in 2026