

How WernerCo saves 7-10 days of marketing report building per month
WernerCo's digital marketing team used to spend 7 to 10 days each month manually assembling an 80-page report across 14 brands, 20+ websites, and multiple social media accounts. By implementing Klipfolio dashboards, they eliminated manual data collection, reduced human error, and won back those days every month so the team could focus on acting on insights rather than building reports.
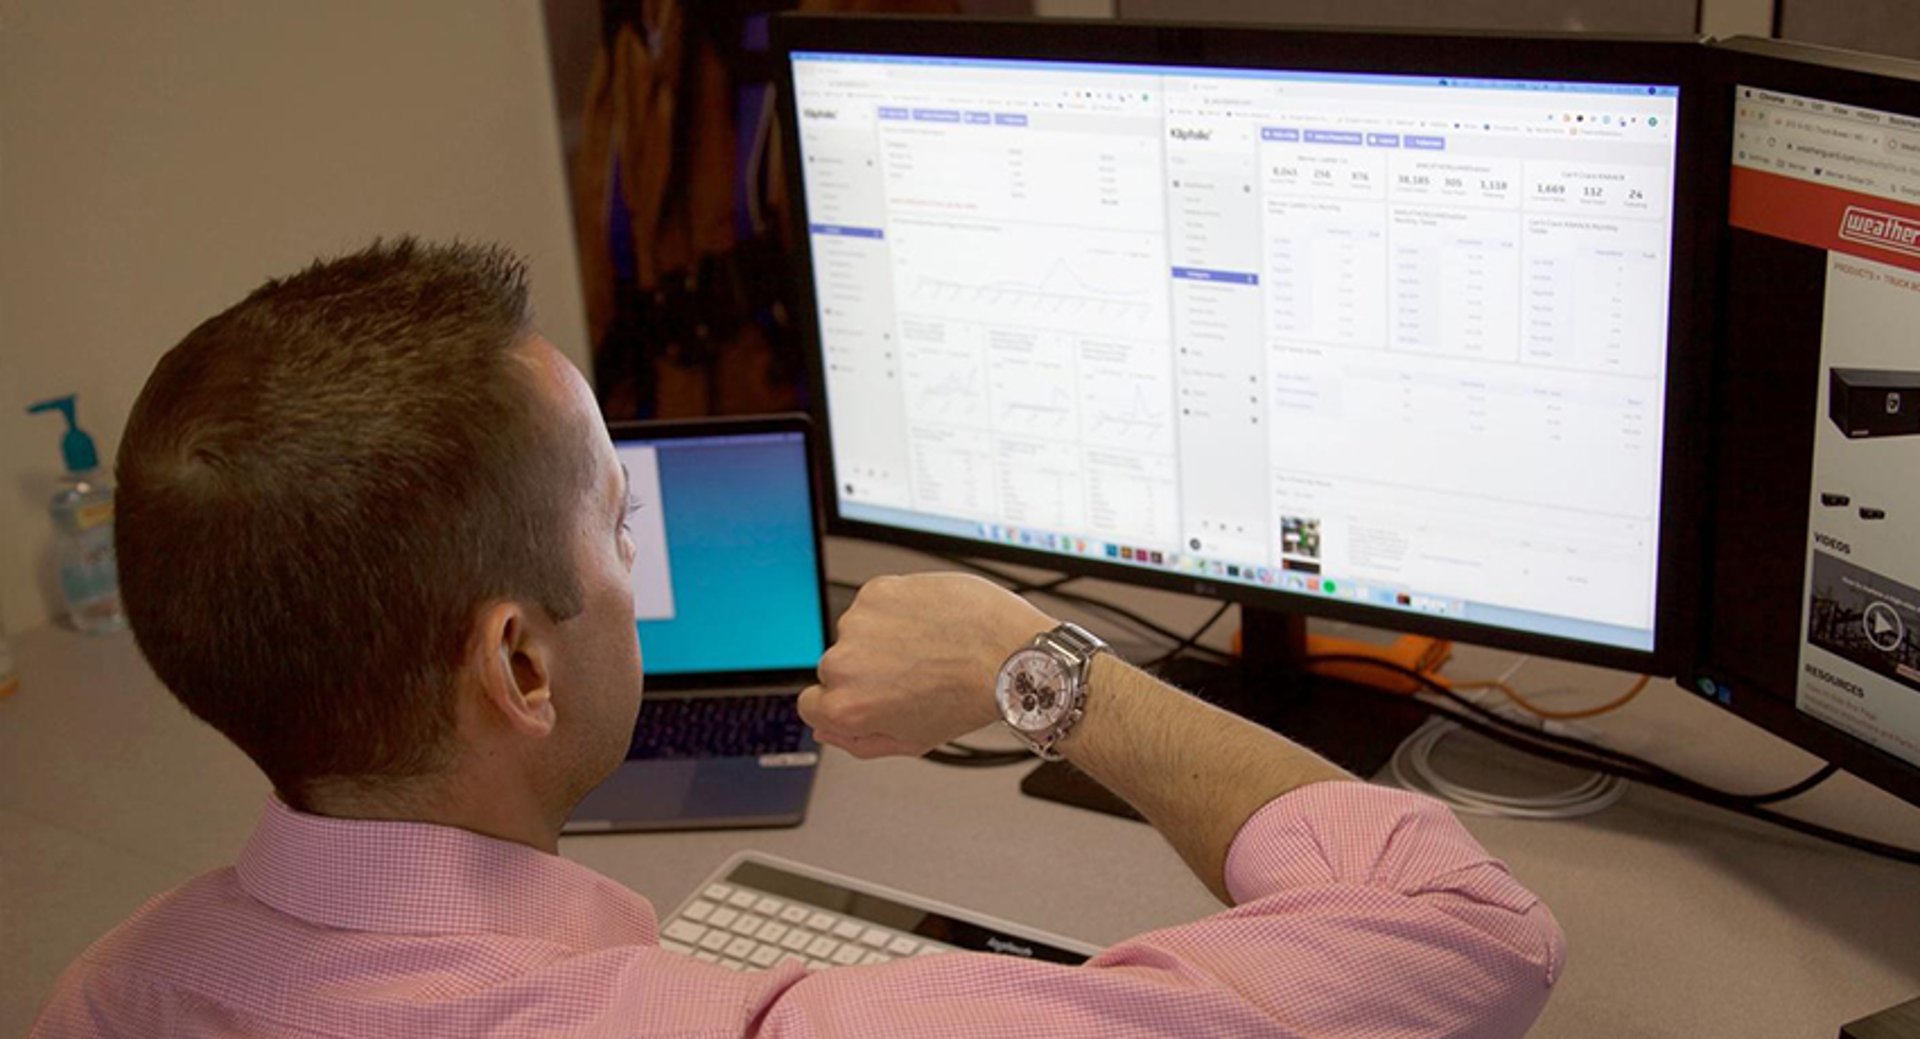
WernerCo is a privately owned, fully-integrated, international manufacturer and distributor of access products, fall protection equipment, secure automotive storage systems, and light duty construction equipment. WernerCo's business model and growth are defined by innovation and continuous improvement of the products, processes, and services they deliver.
Spreadsheet reporting would take 7-10 days to complete per month
As a global company, WernerCo has 14 brands, 20+ websites, and multiple social media accounts across a variety of platforms. They also track and report on customer questions and reviews, email marketing campaigns, eLearning initiatives, and a range of other digital marketing metrics.
"I used to create a manual report each month that was nearly 80 pages long. Due to our high number of accounts and data points, I had to log in to each platform and account, pull the data, add it to an Excel spreadsheet, perform some calculations and then put it into PowerPoint to present the data in a meaningful way. This was extremely cumbersome and typically took between 7-10 days each month to complete. It was also very prone to human error, as I was doing everything manually."
The digital marketing team realized they needed a reporting approach that would buy back those hours every month. It had to be relatively easy to set up while still delivering a flexible, powerful experience, and it had to give leadership reliable numbers without anyone manually assembling them.
During the evaluation process, the team looked at about ten other analytics platforms. What they found was that the options were either extremely expensive and required extensive IT support to install and implement, or were too basic and could not present data in a way that was concise and meaningful.
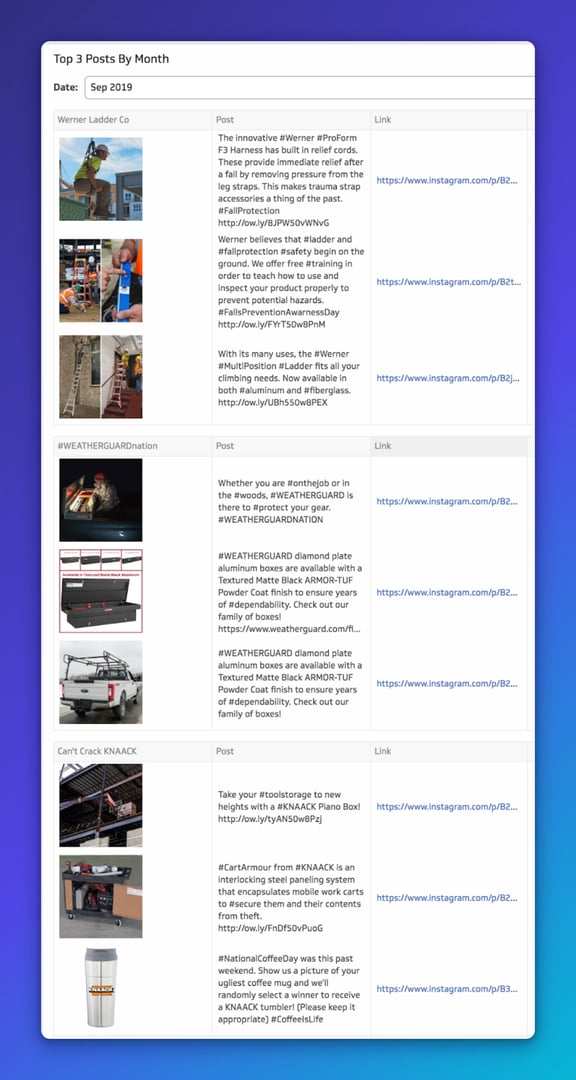
Implementing customizable dashboards that display dozens of data points in one view
"Klipfolio seemed to be the perfect middle ground. Being that it is 100% web-based, easy to use, and has a tremendous support team, it was a no-brainer."
WernerCo works with a multitude of websites and social media accounts. Getting all of that data into a single, trustworthy view, without manual assembly, was the goal. No pasting numbers into a spreadsheet, no chasing down a colleague for a figure, no wondering whether the number in the slide deck matches the one in the platform.
"Utilizing Klipfolio's awesome Data Hero services, we were able to build out highly complex dashboards that displayed all of our data in one place. We use this data to not only report our performance to senior leadership but also to spot trends and make adjustments to our websites and social media posts."
The result: leadership gets a clear picture of what's working, and the team spends time acting on that picture rather than building it.
Go-to marketing metrics for every digital team
Every strong digital marketing team spends significant time working in Google Analytics and across their social media channels. WernerCo tracks a consistent set of metrics that gives leadership the context to make decisions, not just a data dump.
Here are the metrics the WernerCo digital team tracks on a regular basis:
Create custom dashboards for you and your team.
Get started with KlipsGoogle Analytics metrics
Users
Sessions
Pageviews
New sessions
Average session duration
Highest viewed pages
Traffic sources
Referring sites
Social metrics
Impressions
Likes
Clicks
Followers
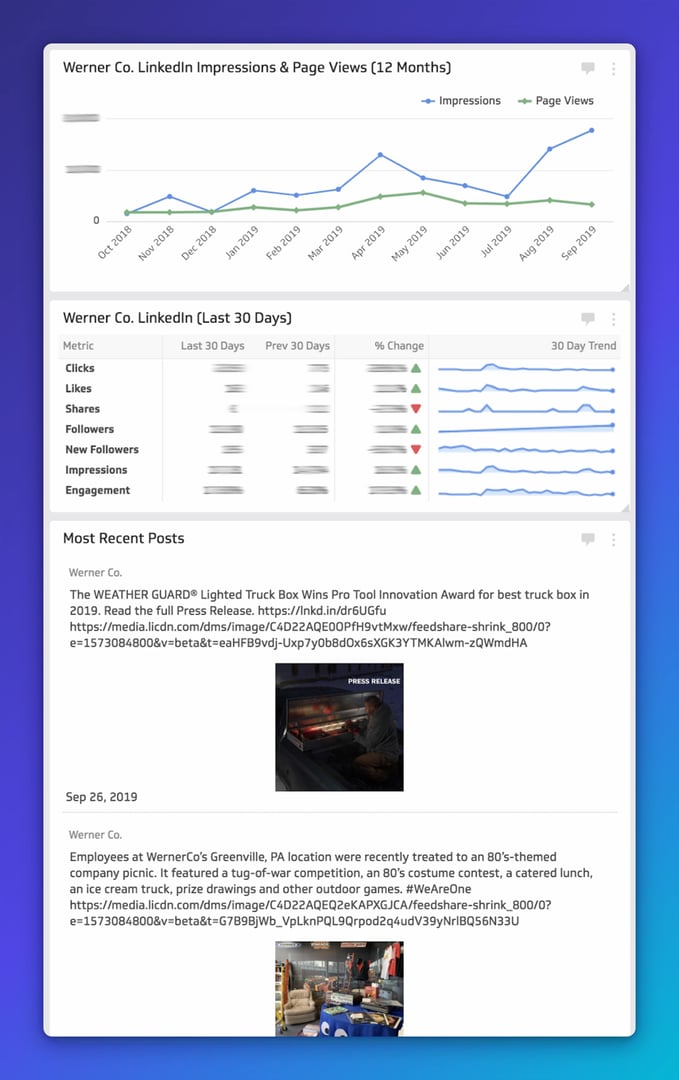
Top posts per month (a team favourite for understanding what content actually resonates)
The team has also worked with a Klipfolio Partner to build out email marketing campaign metrics, adding another layer of visibility across their marketing channels.
Win back days of report-building with automated marketing dashboards
"Our Google Analytics Klipfolio dashboard is extremely powerful. We can see over 20 web properties together at one time to compare and analyze the data. This alone used to take me about three days to complete and I could only display one web property at a time."
That shift, from spending three days on one property at a time to seeing all 20+ side by side in a single view, is where the time savings become real. The team is not checking a dashboard; they are getting an answer. Numbers leadership can trust, without anyone having to ask for them.
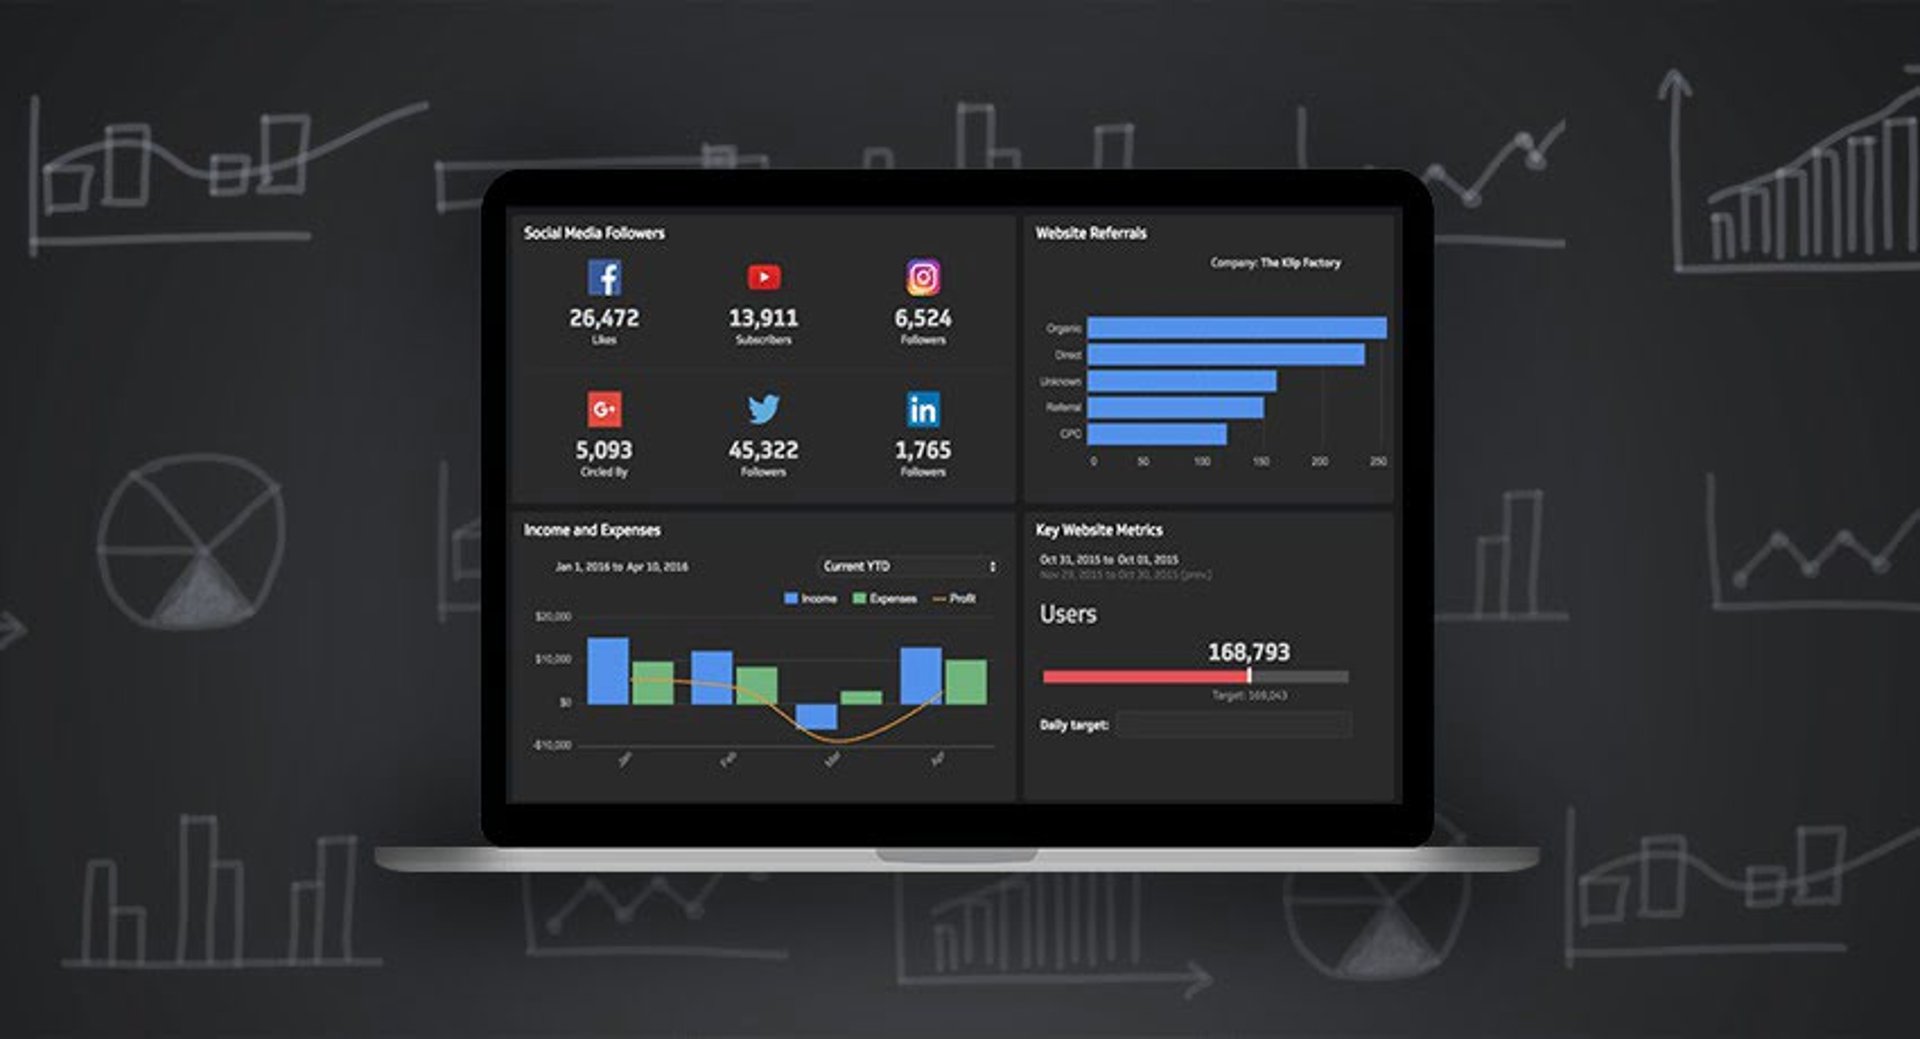
WernerCo's social media dashboard shows historical data alongside the top three posts per month for each account, complete with a photo, the post content, the number of likes, and a link to view the post. It tells the team what has been working well, and they have used that data to improve their social content on an ongoing basis.
"Klipfolio has saved me 7-10 days per month, which has freed me up to do more in my newly expanded role. We've used the data to spot trends and improve our websites and social content."
Dashboards are shared with the right people by assigning them to specific user groups in Klipfolio. As new dashboards are created, they are released to the appropriate groups, so everyone who needs a number has it without having to ask for it.
"I love how Klipfolio presents our data in real-time in a way that is meaningful to our business. It has also saved me a ton of time and has eliminated human error in our data collection process."
Tips for getting started with Klipfolio
For teams managing complex, multi-brand reporting, the WernerCo experience points to one consistent lesson: the dashboards that deliver the most value are the ones built with the right support from the start.
"I highly recommend Klipfolio's Data Hero Services and Partner program. While Klipfolio is relatively easy to use, many of the dashboards we wanted to create were highly complex and customized and took a little more expertise. Our Data Hero has become a valuable resource in helping to build some extremely unique dashboards and we're currently working with a Klipfolio Partner to create some API connections and build dashboards with a few third-party systems that are not native out-of-the-box connections with Klipfolio."
The payoff is not just a cleaner report. It is days returned to the team every month, numbers leadership can trust, and a marketing operation that stays on top of what matters without anyone having to chase it down.
Published 2026-08-25




Most recent
- AUG 11Beyond simple sign-ups: how True Trials and Activation predict growth
- JUL 7Why business leaders miss important trends in their dashboards
- JUN 19The best chart for the job: Visualizing data for non-technical users
- JUN 95 tips to understand (and organize) your restaurant data
- MAY 26Think in Horizons, Not Seconds
- MAY 2010 Cloud BI Dashboard Tools for Small Businesses in 2026