

How dashboards help agile software development teams
Agile software development teams generate data from sprint trackers, build systems, source control, and more. Dashboards aggregate those sources into a single, always-current view so teams can move from gut feel to concrete metrics, spot bottlenecks early, and make confident decisions about velocity, cycle time, WIP limits, and sprint planning.
Agile software development teams produce more data than most leaders know what to do with. This post looks at how dashboards help teams cut through that noise and make decisions based on facts, not feelings.
Agile software teams generate too much data
Agile teams rely on many different tools: sprint trackers, build systems, release managers, source control, code review platforms, and quality monitoring. Each one generates data. Together, they generate more than most teams can meaningfully watch.
Without a way to aggregate that data, spotting a bottleneck or a trend means digging through multiple tools manually. A team tracking close to 100 tasks at any given time, each moving through coding, review, QA, and release, can't do that without a proper monitoring layer. Left unmanaged, the data either goes unused or causes problems that surface too late to fix cleanly.
Klipfolio connects those sources into a single dashboard, so the picture is always visible without anyone having to go looking for it.
An interview with an agile team using dashboards
Karl Hughes, head of engineering at Packback, wrote a post about this very topic on building an agile sprint tracking system. His team integrated Klipfolio into their development process to solve real problems. We reached out to talk through how they did it and what they learned.
The conversation below covers their process, the metrics they track, and the decisions those metrics support.
What does your agile process look like?
Karl: We started with Kanban to establish throughput and get things in order. As the team gelled and planning became more predictable, we moved to Scrum. We're not strict about every rule, but we do use the standard artifacts: sprint planning, standups, demos, and retrospectives. We've run both one and two-week sprints depending on what's planned.
Ali: That's a common evolution. At Klipfolio we use Scrumban, which combines elements of both. In a continuous delivery environment, a single prioritized backlog reduces the overhead of sprint planning considerably.
Why does tracking data matter in agile projects?
Karl: Any project management framework tries to answer two questions: what can we do, and when can we do it? Agile encourages smaller pieces of work and constant re-evaluation. Without data, you can't tell whether a change actually improved things. We try not to rely on how fast things "feel." We want concrete metrics to back up those feelings.
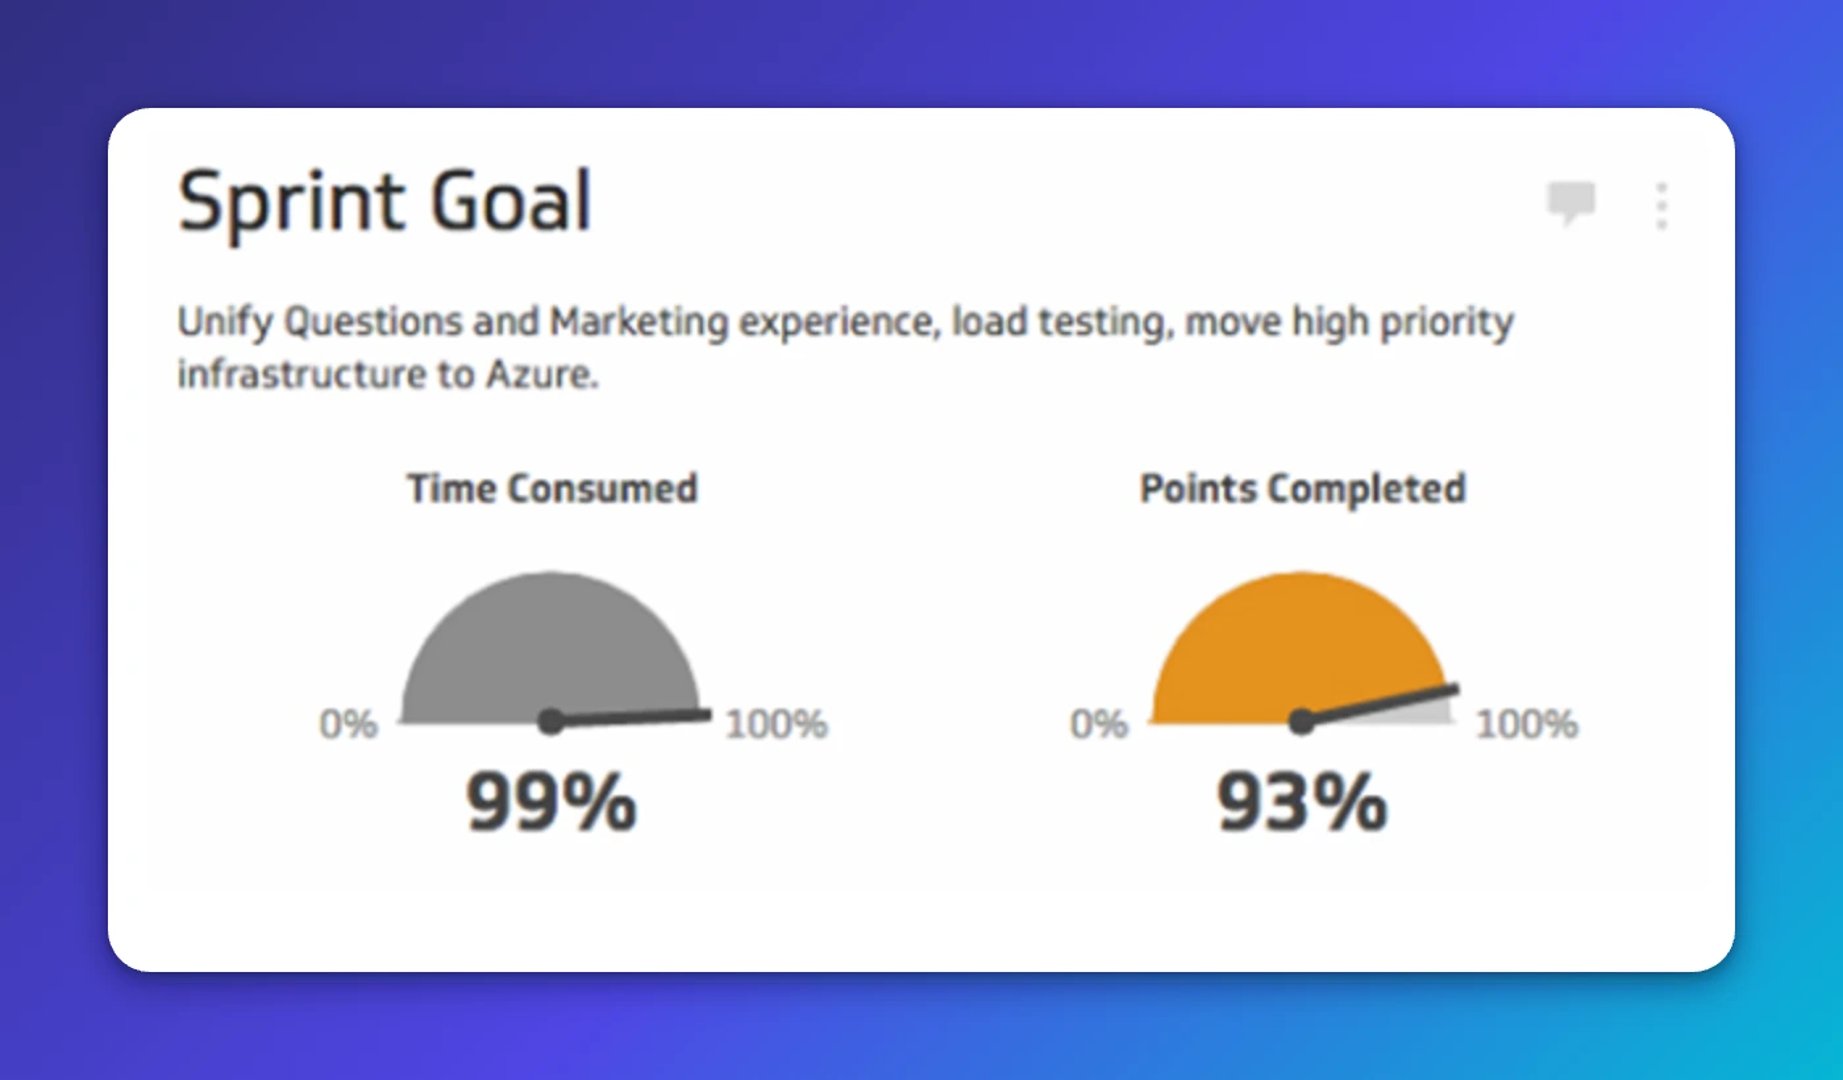
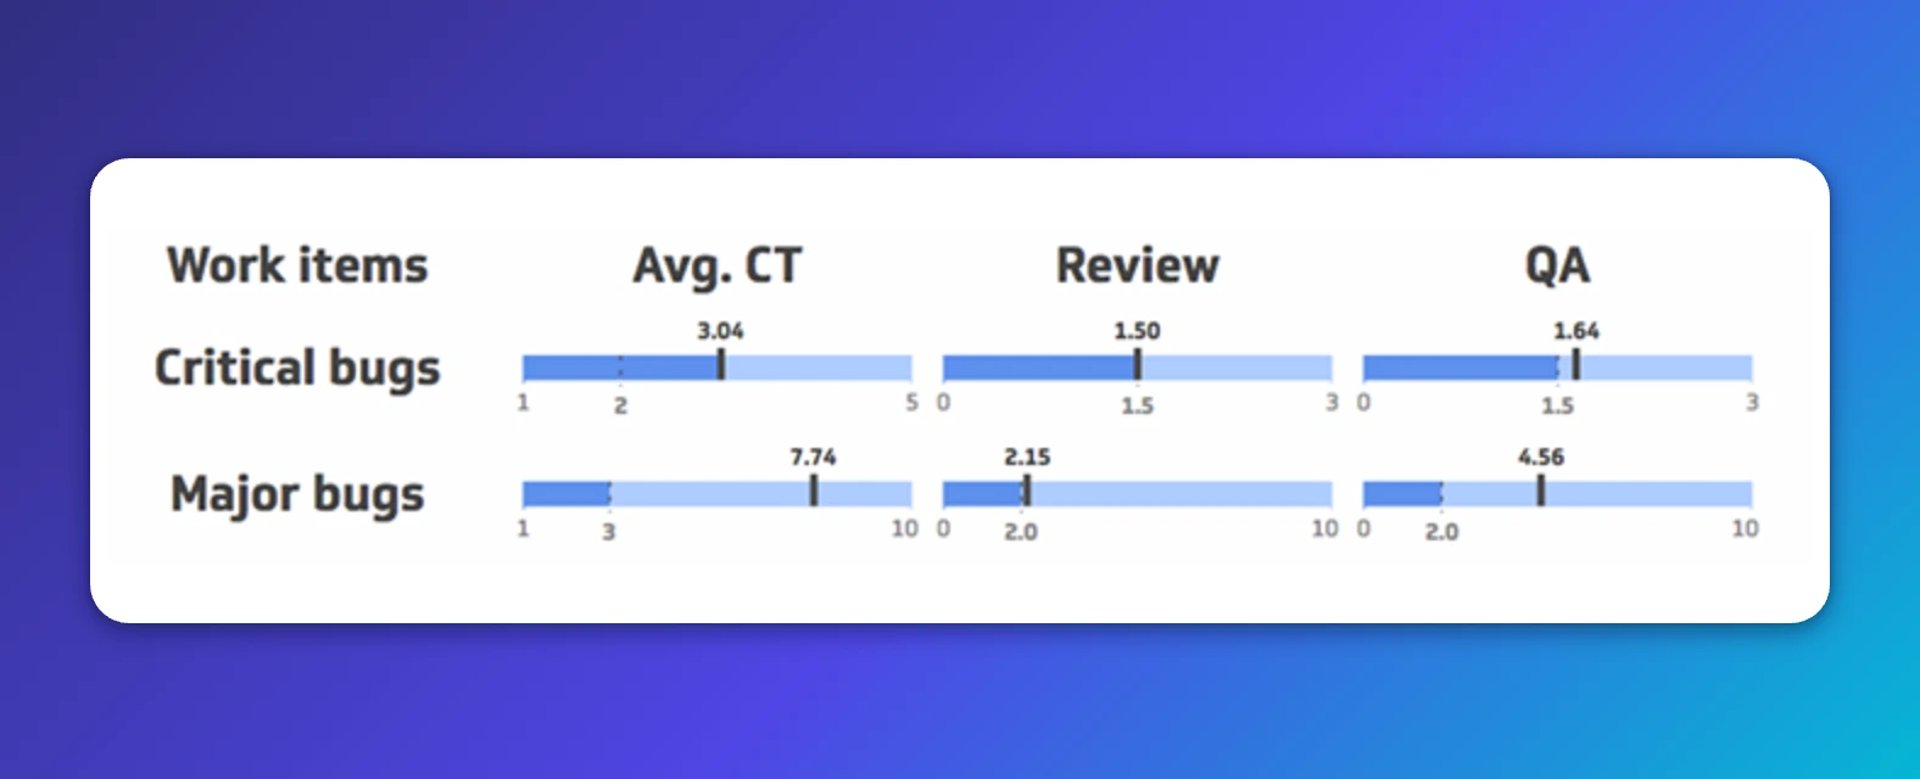
Ali: The data surfaces things that gut feel misses. Tracking Cycle Time and time spent in each pipeline state, including wait time, revealed a bottleneck in our QA step. We had a sense something was slow, but the data gave us something concrete to act on.
The Klip below shows average Cycle Time for Critical and Major defects, along with time spent in code review and QA.
What metrics do you track daily, weekly, and per sprint?
Karl: As the engineering lead, I check these metrics several times a week:
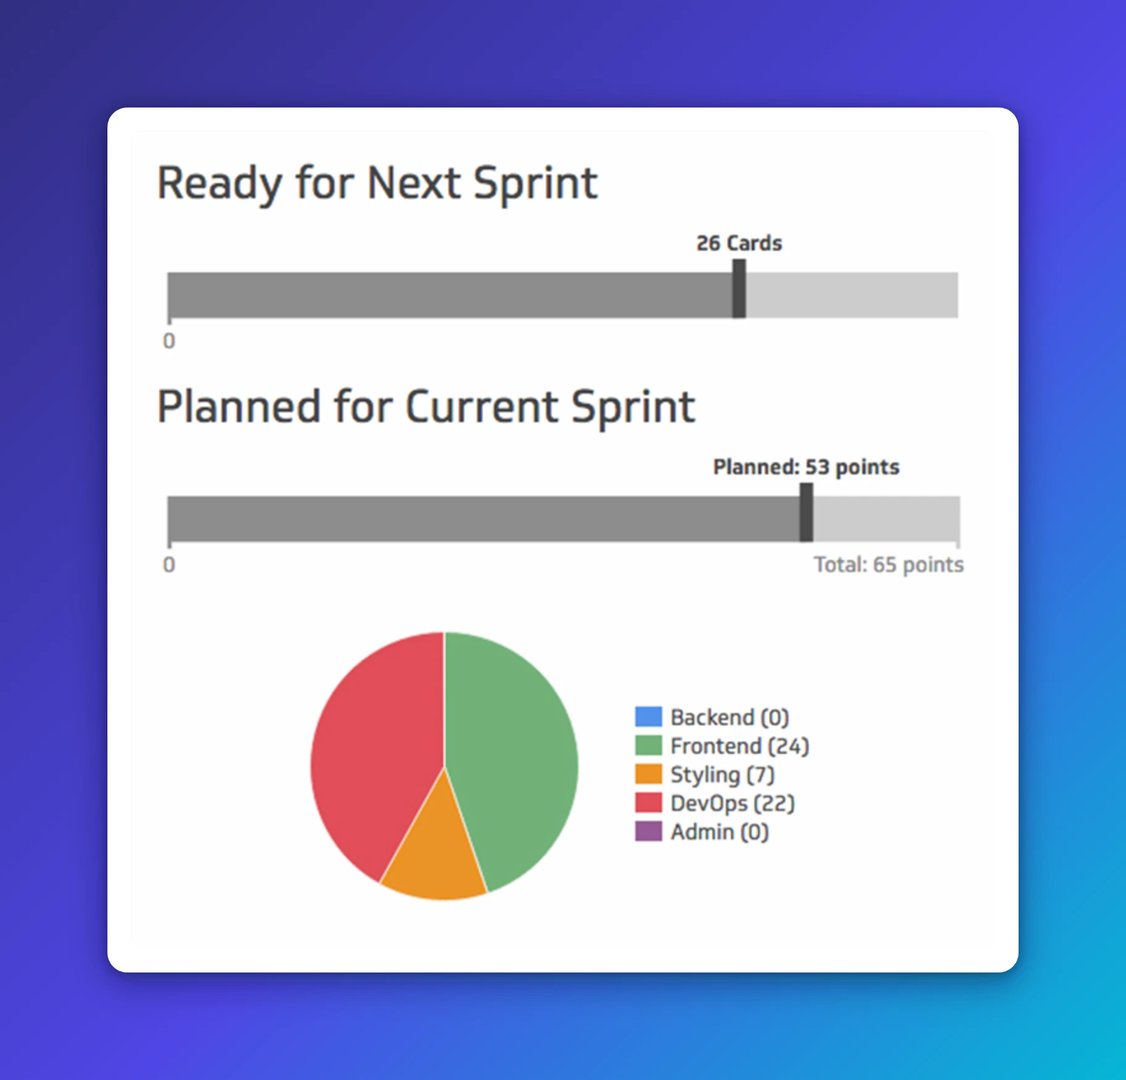
Number of items ready for the next sprint planning meeting
Backlog size for the current sprint
Point breakdown by type: backend vs. frontend, bugs, late additions, items stuck in QA
Burndown: time left in the sprint vs. points remaining
Output per team member: items and points completed
Accuracy: time taken vs. estimated points
Keeping up with big-picture trends helps us make better estimates on future work without spending hours analyzing data.
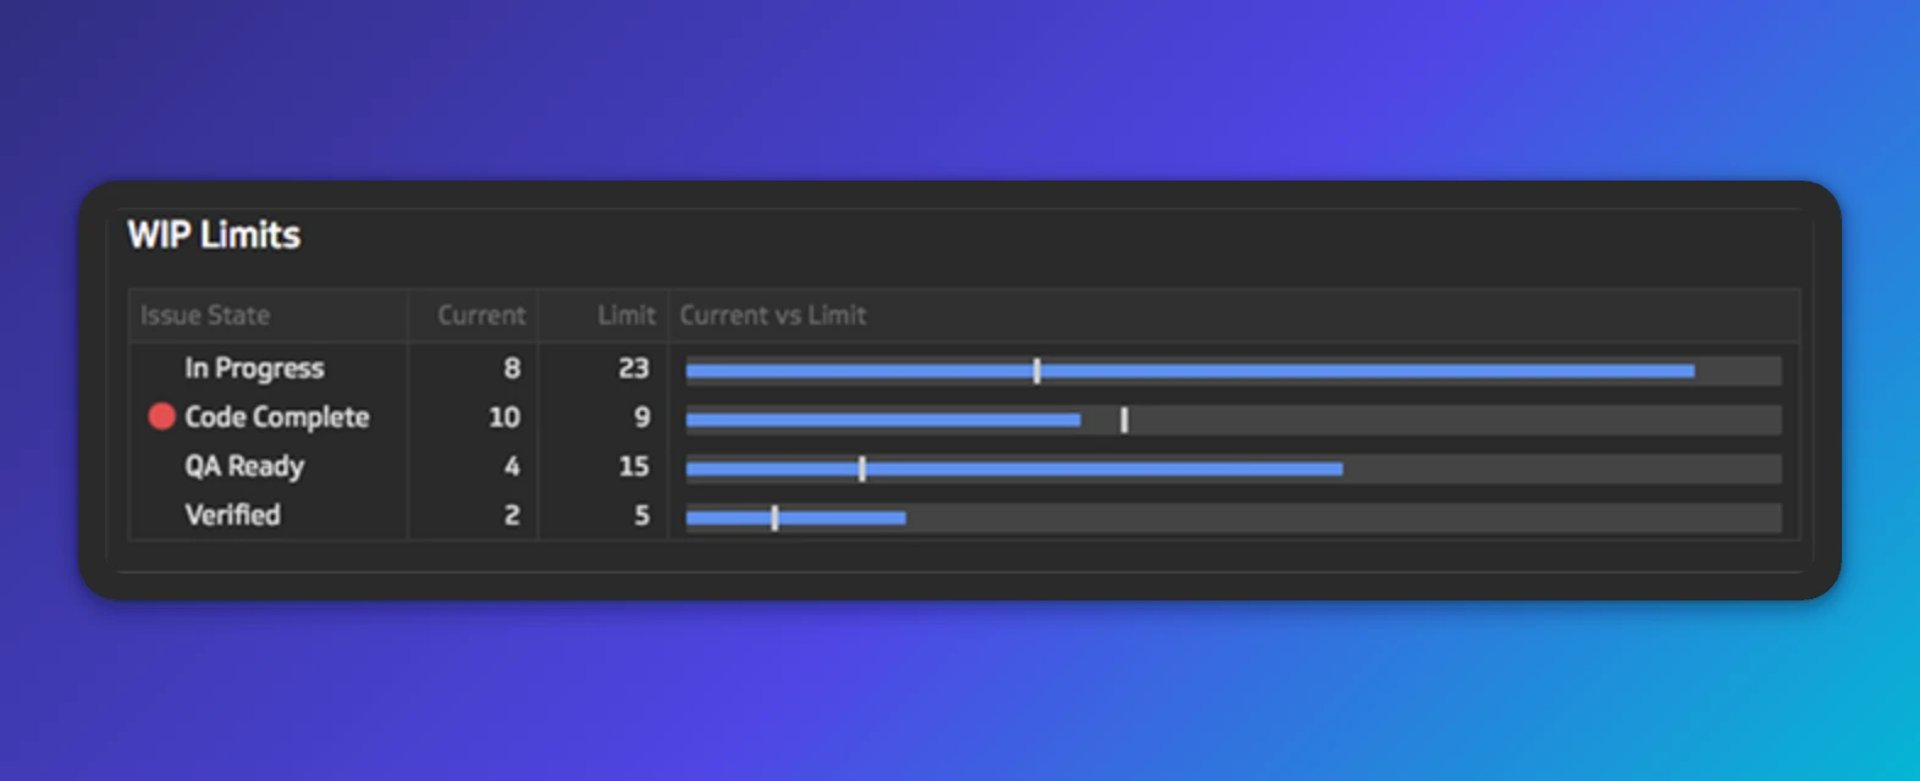
Ali: Those are solid. One metric worth adding is WIP (Work in Progress) limits, which reflects the Kanban side of a hybrid process. Here is a live dashboard showing a WIP limit visualization.
Create custom dashboards for you and your team.
Get started with KlipsHow do you track longer-term projects?
Karl: For large projects, we break the work into smaller pieces and map each piece onto a sprint-by-sprint roadmap. The goal isn't to lock everyone into a timeline, which just encourages cutting corners on testing. It's to ask: is it even possible to finish this by date X?
We update the timeline based on what we actually complete each sprint, and remove or push features if needed. Reality shapes the plan, not the other way around.
Ali: Having the data makes that kind of honest planning easier. It sets realistic expectations and gives the whole team visibility into where a project actually stands.
How often do you check your dashboards, and what do you do with what you see?
Karl: We have several dashboards at Packback, including our agile sprint tracking dashboard, all rotating on TVs in the office so everyone can see how things are going at any moment.
I check the sprint progress dashboard every day or two. If something looks off, I dig into the sprint board directly. Being able to move from the high-level view to the detail quickly is the part that saves time.
Ali: That's a good instinct: start with the aggregated picture, then drill down to the root cause only when something flags. The dashboard does the watching so you don't have to.
How has using Klipfolio improved your agile process?
Karl: Our biggest weakness was sprint planning. We consistently entered sprints with too much work for frontend engineers and not enough for the backend team. The sprint tracking dashboard made that imbalance visible, which was the first step to fixing it. It also helps track velocity relative to team size and planned workload.
Ali: On our side, one of the clearest wins has been staying on top of Critical and Major defects reported by customers. Pairing that with number of releases and number of regression issues per release lets us move faster without losing sight of quality.
What tools do you connect, and how does the data flow?
Karl: We use Trello for sprint tracking. Klipfolio works with any API, so we initially piped Trello data in directly. As our dashboards became more complex, we built an internal API to handle data manipulation before passing it to Klipfolio. Some of that could be done inside Klipfolio, but we preferred having version control over the logic.
We also connect NewRelic, Google Analytics, and internal test coverage reports for application health monitoring. The sales team uses Salesforce and Google Sheets to track campaign progress.
Ali: Klipfolio supports many different integrations, and the ability to push data via the API makes it easy to pre-process data before it reaches the dashboard. That flexibility matters when the data model gets complex.
What agile teams get from dashboards
Agile teams customize Scrum, Kanban, and everything in between to fit how they actually work. What stays consistent across all of them is the need to move from how things "feel" to what the data actually shows.
The metrics that tend to matter most include velocity, number of ready stories, story points per team member, WIP limits, and Cycle Time. Those are a starting point, not a ceiling. The most useful metrics are often the ones a team identifies itself, based on what it's trying to improve.
A dashboard doesn't just display those numbers. It keeps them current, keeps them visible, and means no one has to wait for someone to pull a report or paste numbers into a spreadsheet to answer a basic question about where a project stands.
Next steps
Want to go deeper on dashboards for software development and DevOps teams?
Published 2026-08-22



Most recent
- AUG 11Beyond simple sign-ups: how True Trials and Activation predict growth
- JUL 7Why business leaders miss important trends in their dashboards
- JUN 19The best chart for the job: Visualizing data for non-technical users
- JUN 95 tips to understand (and organize) your restaurant data
- MAY 26Think in Horizons, Not Seconds
- MAY 2010 Cloud BI Dashboard Tools for Small Businesses in 2026