

Most click-through data is wrong, and here's why
Most teams calculate email click-through rate by dividing clicks by total recipients, but that formula includes people who never opened the message. The result is a number, not an insight. Dividing clicks by unique opens gives you a true CTR that reflects actual content performance. The difference can be dramatic: a campaign that looks like 0.334% CTR by the traditional method becomes 25.2% when measured correctly. Accurate CTR data helps you assess copy and calls to action, spot underperforming campaigns, and segment by real engagement.

Like all things, measuring email effectiveness means picking the right metrics. According to research from Demand Metric and Return Path, poorly defined metrics are a major challenge for marketers. Many teams default to high-level indicators like open rate and click-through rate (CTR).
Open rate helps you assess subject lines and body copy. For inboxes like Gmail and Apple Mail, it also tells you how your company logo renders. Both matter when you're trying to understand what's working.
CTR is how you judge whether your email content is actually persuading people to act. That's the whole point of an email: get the reader to do something. The problem is that most teams calculate CTR in a way that produces a number, not an insight.
Why your click-through rate is probably misleading you
The most common CTR formula is also the most misleading one.
Only recipients who open your message can click. Full stop. Including non-openers in your email click-through rate calculation doesn't make the number more accurate. It makes it less useful.
How marketers incorrectly calculate unique click-through rate
Unique recipients who clicked ÷ Total recipients
Here's what that looks like in practice. A client ran a re-engagement campaign to a list of more than 100,000 contacts, targeting people who hadn't opened an email in 18 months. Only 1,423 recipients opened the first message. The campaign performed well, but the CTR math didn't reflect that.
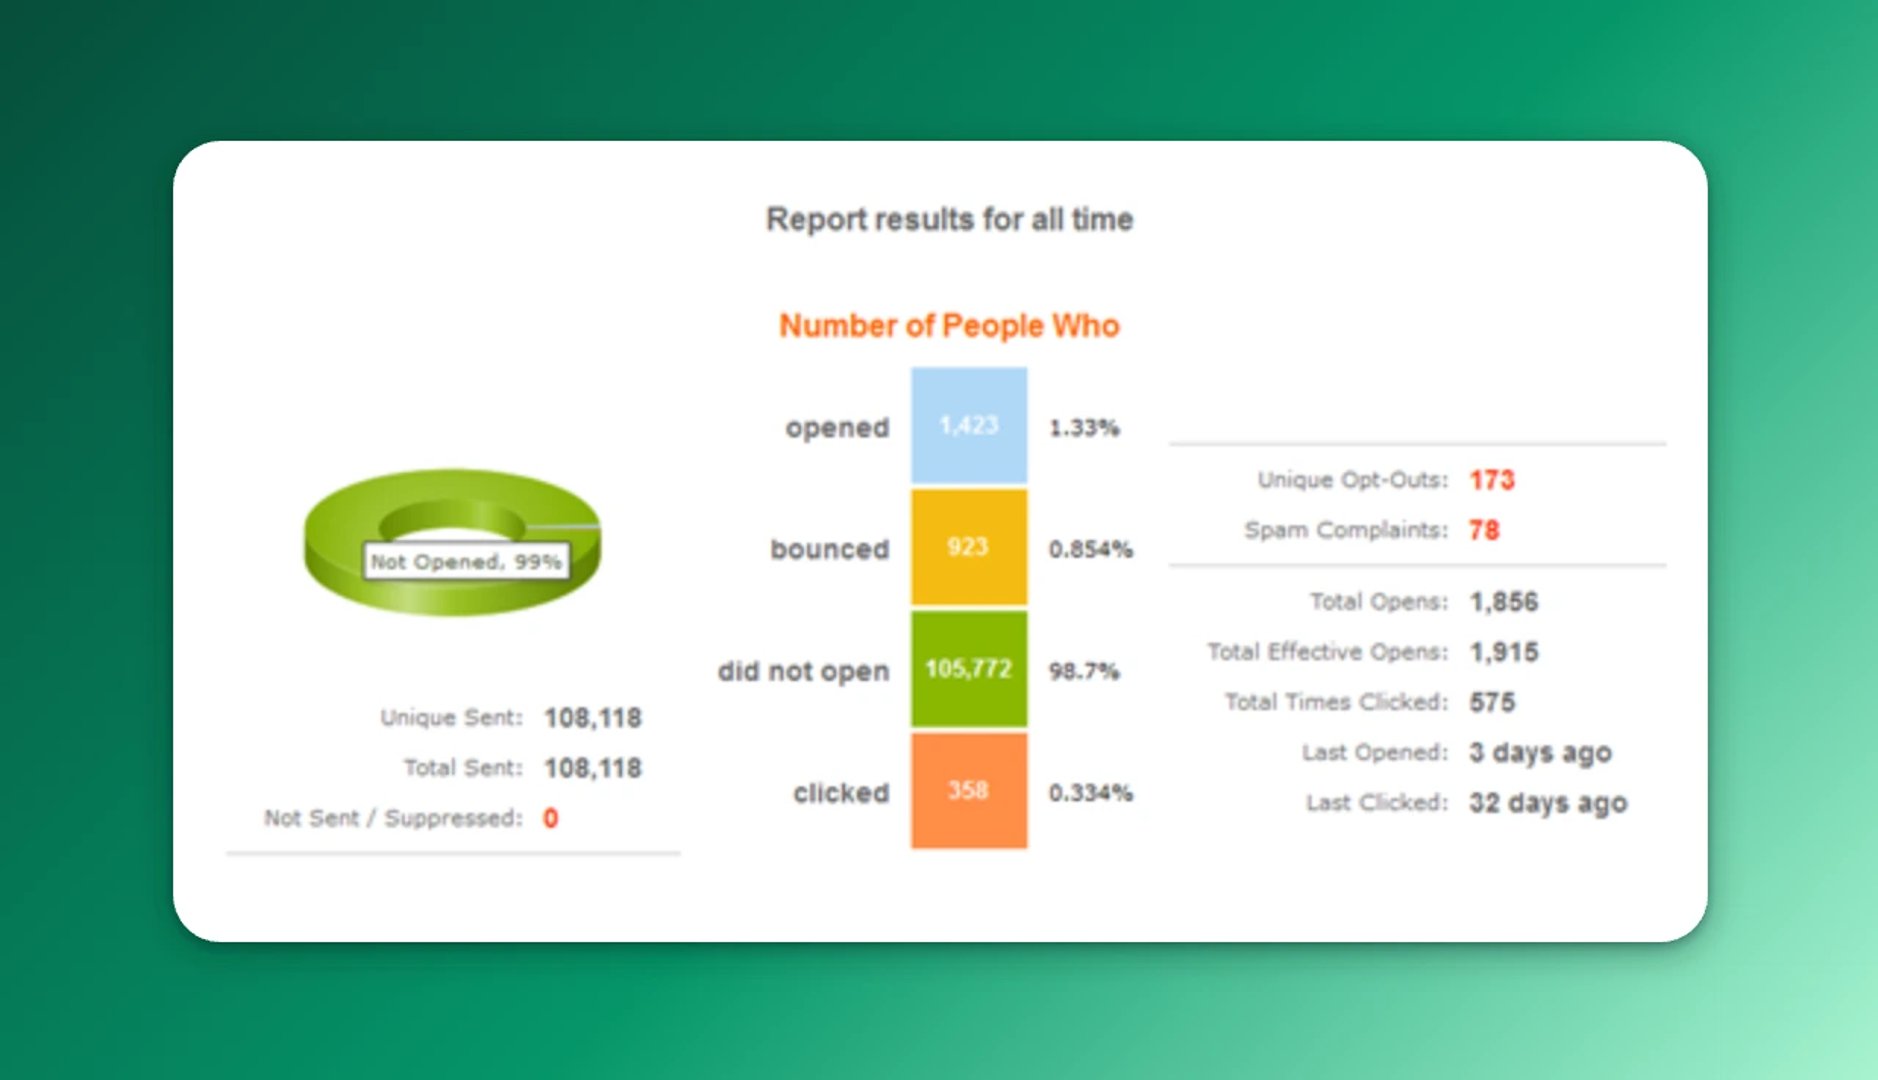
Dividing clicks by total recipients produced a CTR of 0.334%. Technically correct. But does that number tell you anything meaningful about content performance when only 1,423 people ever saw the message?
It doesn't. And if you're making decisions based on that number, you're flying blind.
How to calculate a true click-through rate
When you evaluate email content, ask yourself: if a recipient didn't open the message, should they factor into your CTR at all? The answer is no. Non-openers belong in your email deliverability metrics analysis, not your content performance calculation.
The formula is straightforward:
True unique click-through rate
Unique recipients who clicked ÷ Unique recipients who opened
Using the same example above, the client's true click-through rate was 25.2%. Benchmarks vary by audience and campaign type, but that's a strong result for any re-engagement send. The content was working. The old formula just hid it.
Why the difference matters for decisions
Say you send a prospect newsletter to 100,000 people.
Using the traditional method (clicks ÷ sends), you might see 3.1%, 2.9%, 3.2%, 3.5% month to month. Was the first email really 0.2% better than the second? There's no way to know.
Now calculate CTR as clicks ÷ opens. You might see 23.4%, 19.5%, 27.3%, 33.3%. The picture becomes clearer. The last email performed at least 21% higher than the rest. Now you have a number you can act on, not just report.
"I find this method not only a great way to quantify our program successes," said Brandon Palmer, digital marketing specialist at Access Marketing Company, "but also a great starting point when digging deeper into what caused the increase in engagement."
Create custom dashboards for you and your team.
Get started with KlipsWhat accurate CTR data lets you do
Once you're working with a CTR that reflects actual email content performance analysis, you can:
- Assess email effectiveness accurately: know whether your copy, offer, and calls to action are doing their job
- Identify what needs attention: spot underperforming campaigns without false positives from list size
- Segment with confidence: group recipients by real email engagement segmentation and send messages you know resonate
The goal isn't a better-looking dashboard. It's knowing which emails are worth repeating and which ones need rethinking, without having to dig through a spreadsheet or ask someone to pull the numbers for you.
Published 2026-08-23
More in Data Analytics

5 tips to understand (and organize) your restaurant data

The 5 ways to make your business partnership last a lifetime

The 5 most important SEO KPIs for digital marketing success

What are the best inbound marketing KPIs?

Top 10 Marketing Dashboard Ideas for Tech Companies

17 KPIs Every Data-Driven Manager Needs to Lead Their Team
Most recent
- AUG 11Beyond simple sign-ups: how True Trials and Activation predict growth
- JUL 7Why business leaders miss important trends in their dashboards
- JUN 19The best chart for the job: Visualizing data for non-technical users
- JUN 95 tips to understand (and organize) your restaurant data
- MAY 26Think in Horizons, Not Seconds
- MAY 2010 Cloud BI Dashboard Tools for Small Businesses in 2026