

The 6 must-have metrics to bring your email marketing program to the next level
Without tracking the right email marketing metrics, you're guessing. These six metrics, including email ROI, deliverability, open rate, click-through rate, subscriber trends, list rating, and web traffic from emails, give you the clarity to stop guessing and start improving your campaigns.
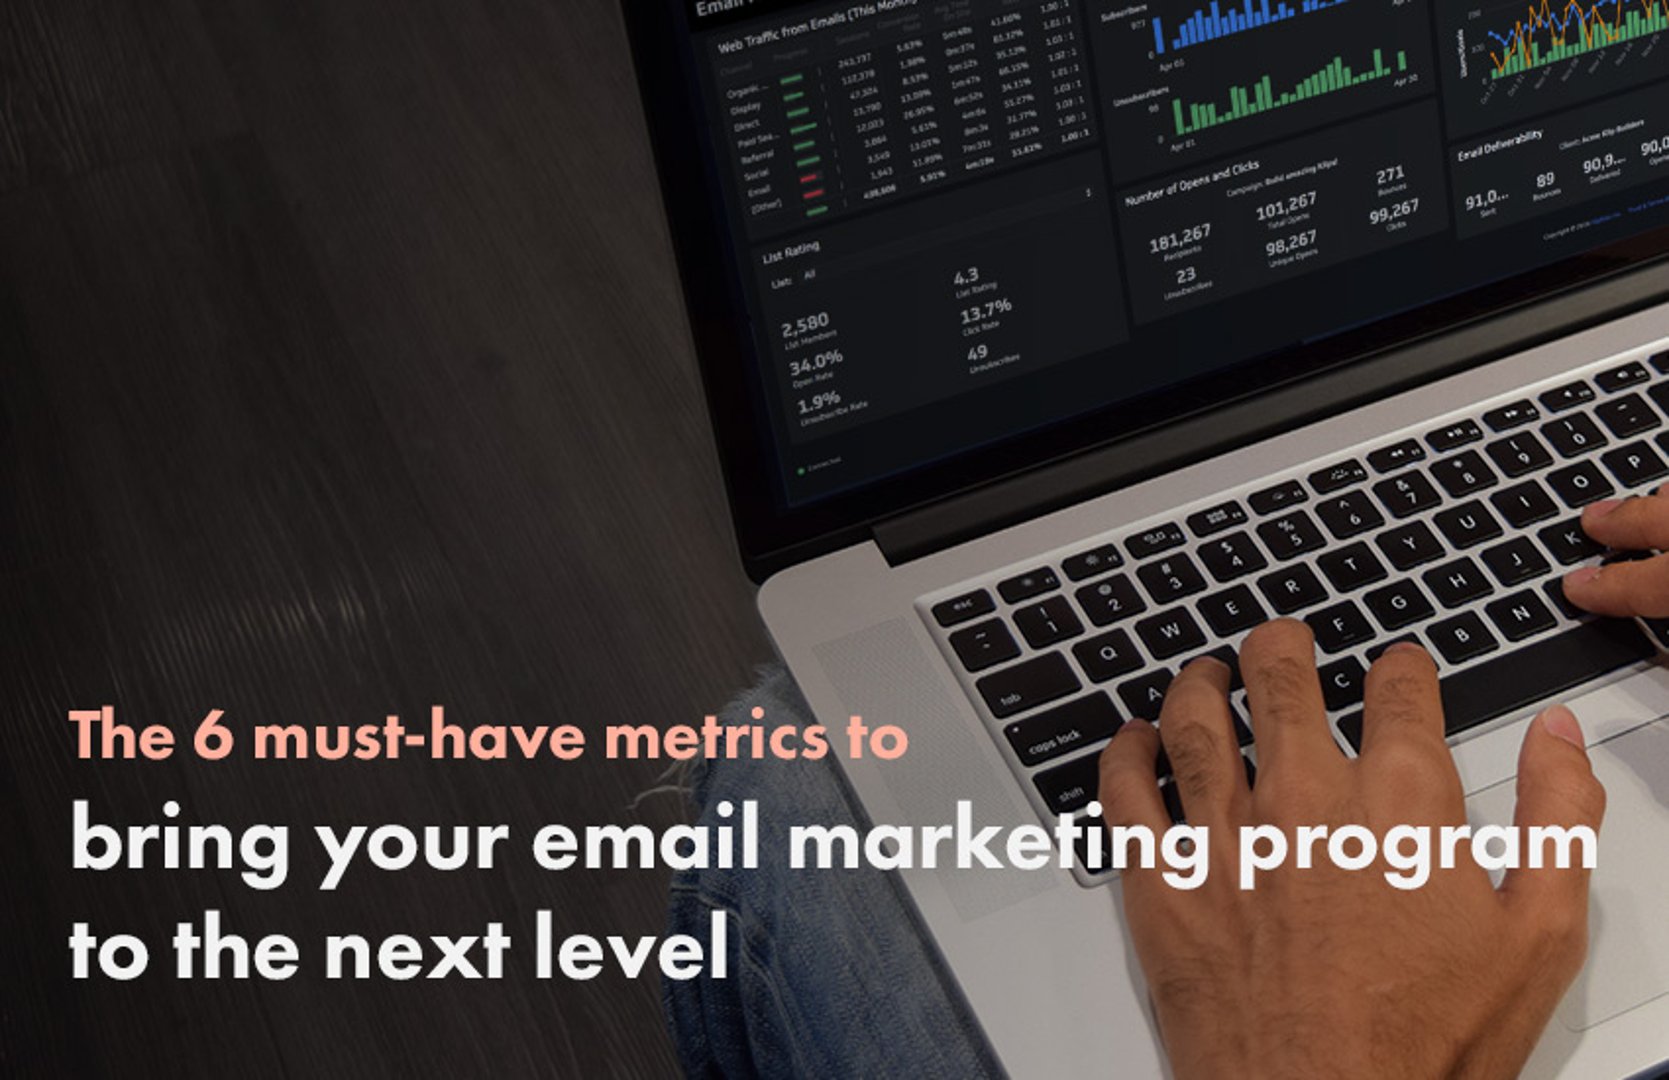
Email marketing has a reputation problem it doesn't deserve. Most people think of spam, clumsy automated messages, and batch-and-blast campaigns that get your name wrong. But the channel itself is not the issue. Done right, email marketing is one of the most reliable ways to turn subscribers into paying customers.
The real problem is measurement. Without tracking the right email marketing metrics, you're guessing. You don't know what's working, what's wasting budget, or where to focus next. These six metrics give you the clarity to stop guessing and start improving.
Key email marketing metrics
1. Email ROI
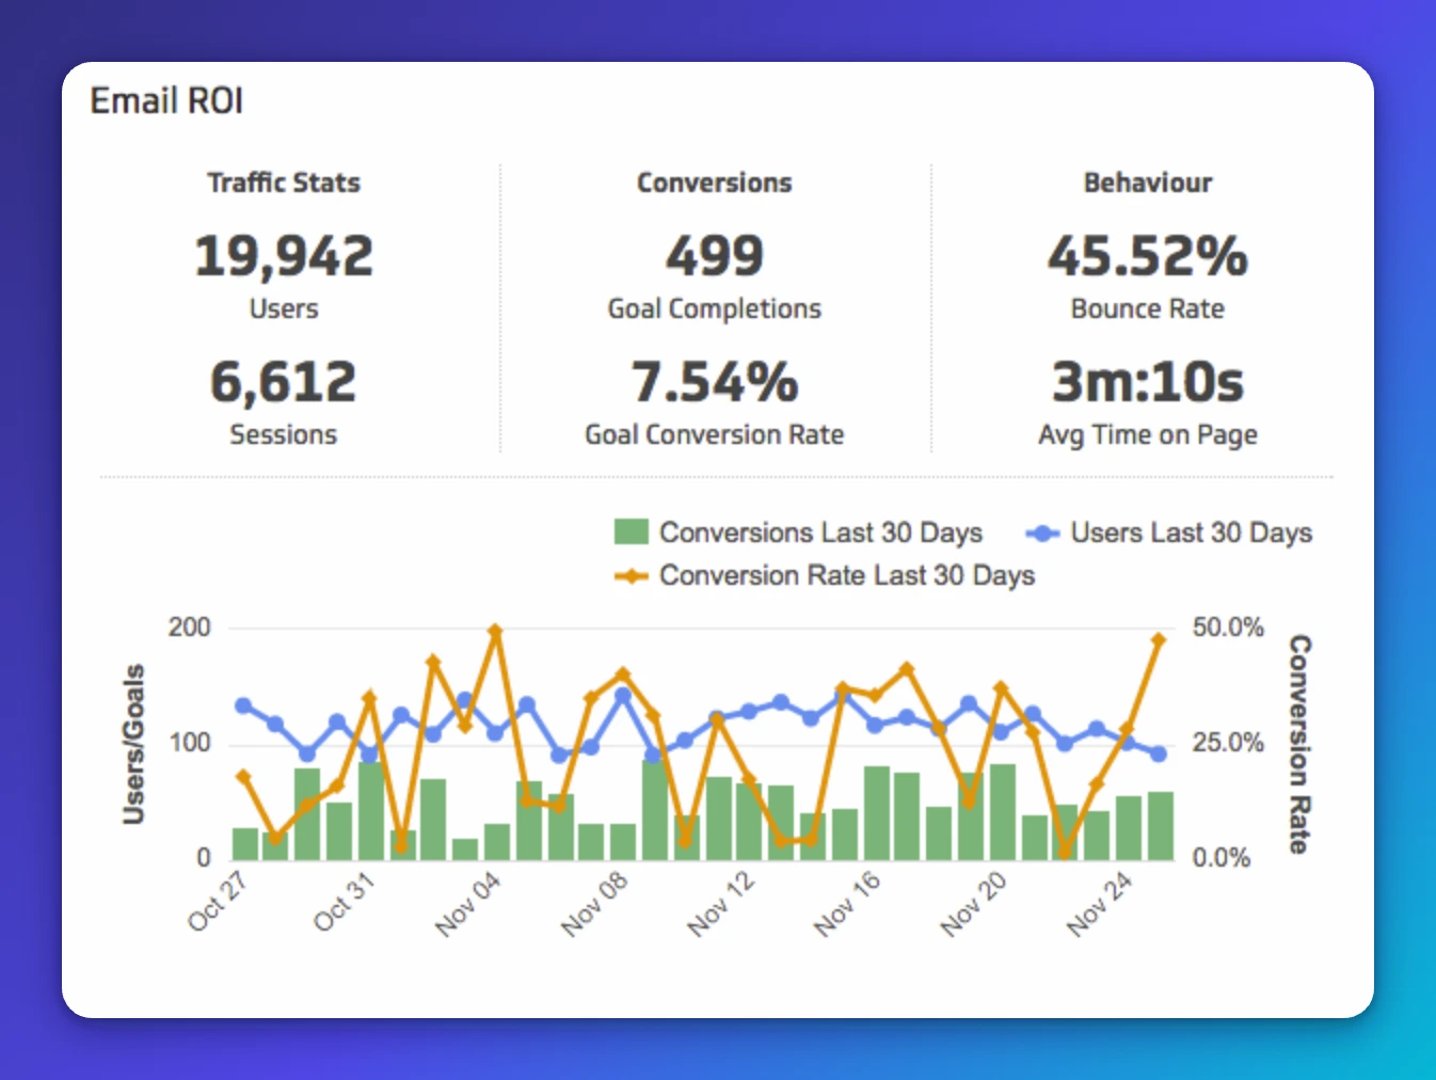
Email ROI tells you whether your campaigns are generating real business results, not just opens and clicks. Track how many conversions your email campaigns produce, whether that's a purchase, a form fill, or a booked call. Compare that against what you're spending on the program.
If you're pasting numbers into a spreadsheet or asking a generic AI tool to make sense of disconnected data, you're adding work instead of getting answers. A live dashboard surfaces this number automatically, so you always know where email stands in your revenue mix.
2. Email deliverability
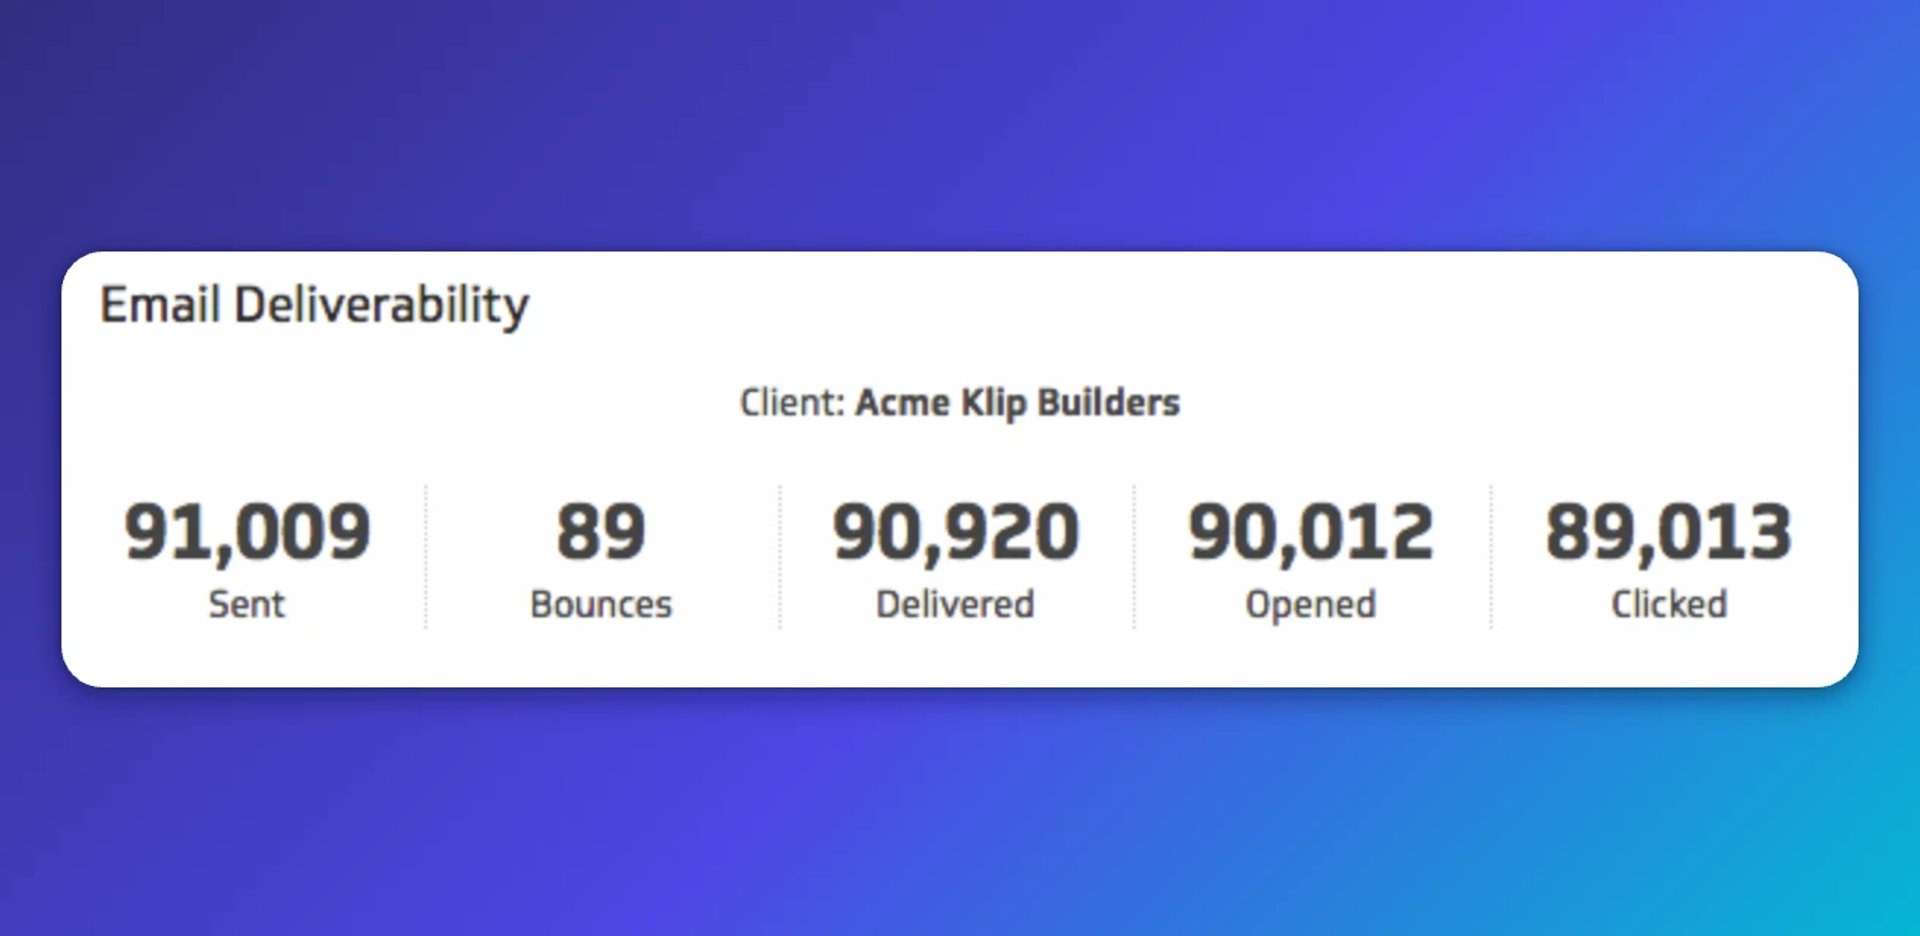
A campaign can't convert if it never arrives. Deliverability tracks how many of your sent emails actually reach inboxes versus bouncing. High bounce rates signal list health problems, and enough of them can get your account flagged or suspended by your email service provider.
Check both hard bounces (invalid addresses) and soft bounces (temporary delivery failures). Cleaning your list regularly keeps your sender reputation intact and your deliverability high. The data below pulls from Campaign Monitor.
3. Open rate and click-through rate
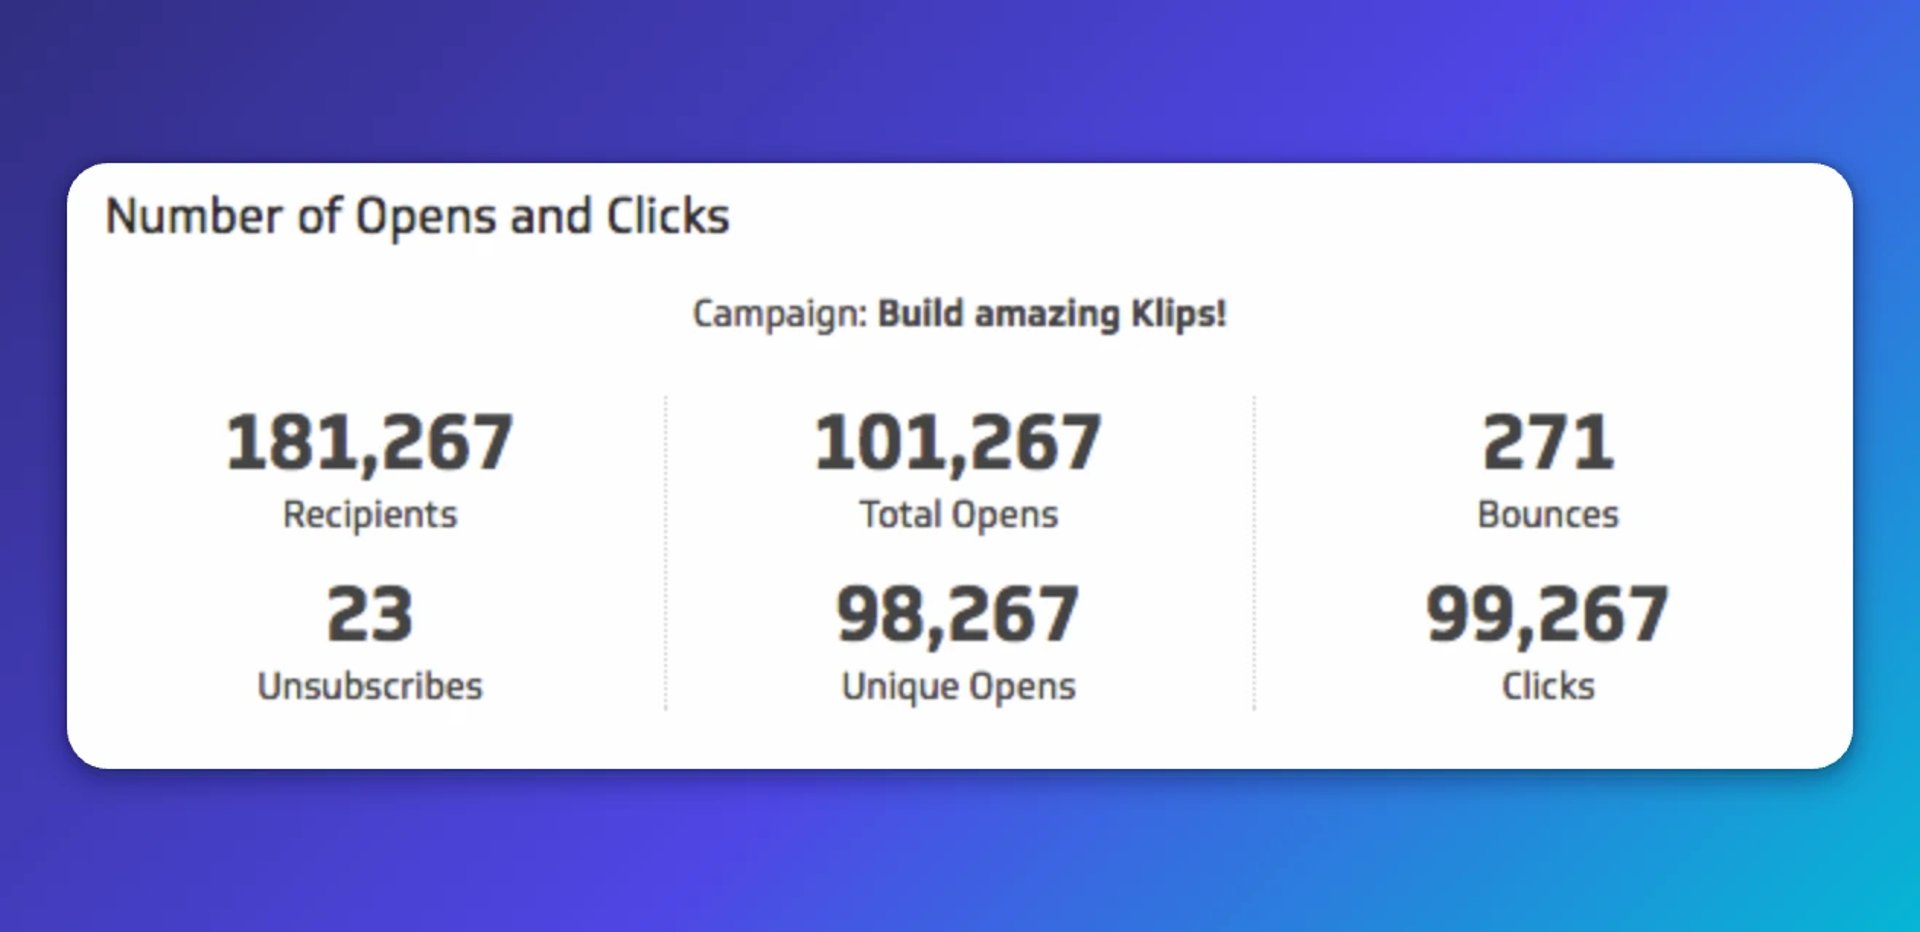
Open rate and click-through rate (CTR) tell you how well your subject lines and content are landing. Strong open rates mean your subject line earned attention. Strong CTR means the content inside delivered on that promise.
When both numbers are healthy, your campaign is resonating. When one lags, you know exactly where to focus: subject line testing, content relevance, or call-to-action clarity. The data below pulls from Campaign Monitor.
4. Subscribers vs. unsubscribers
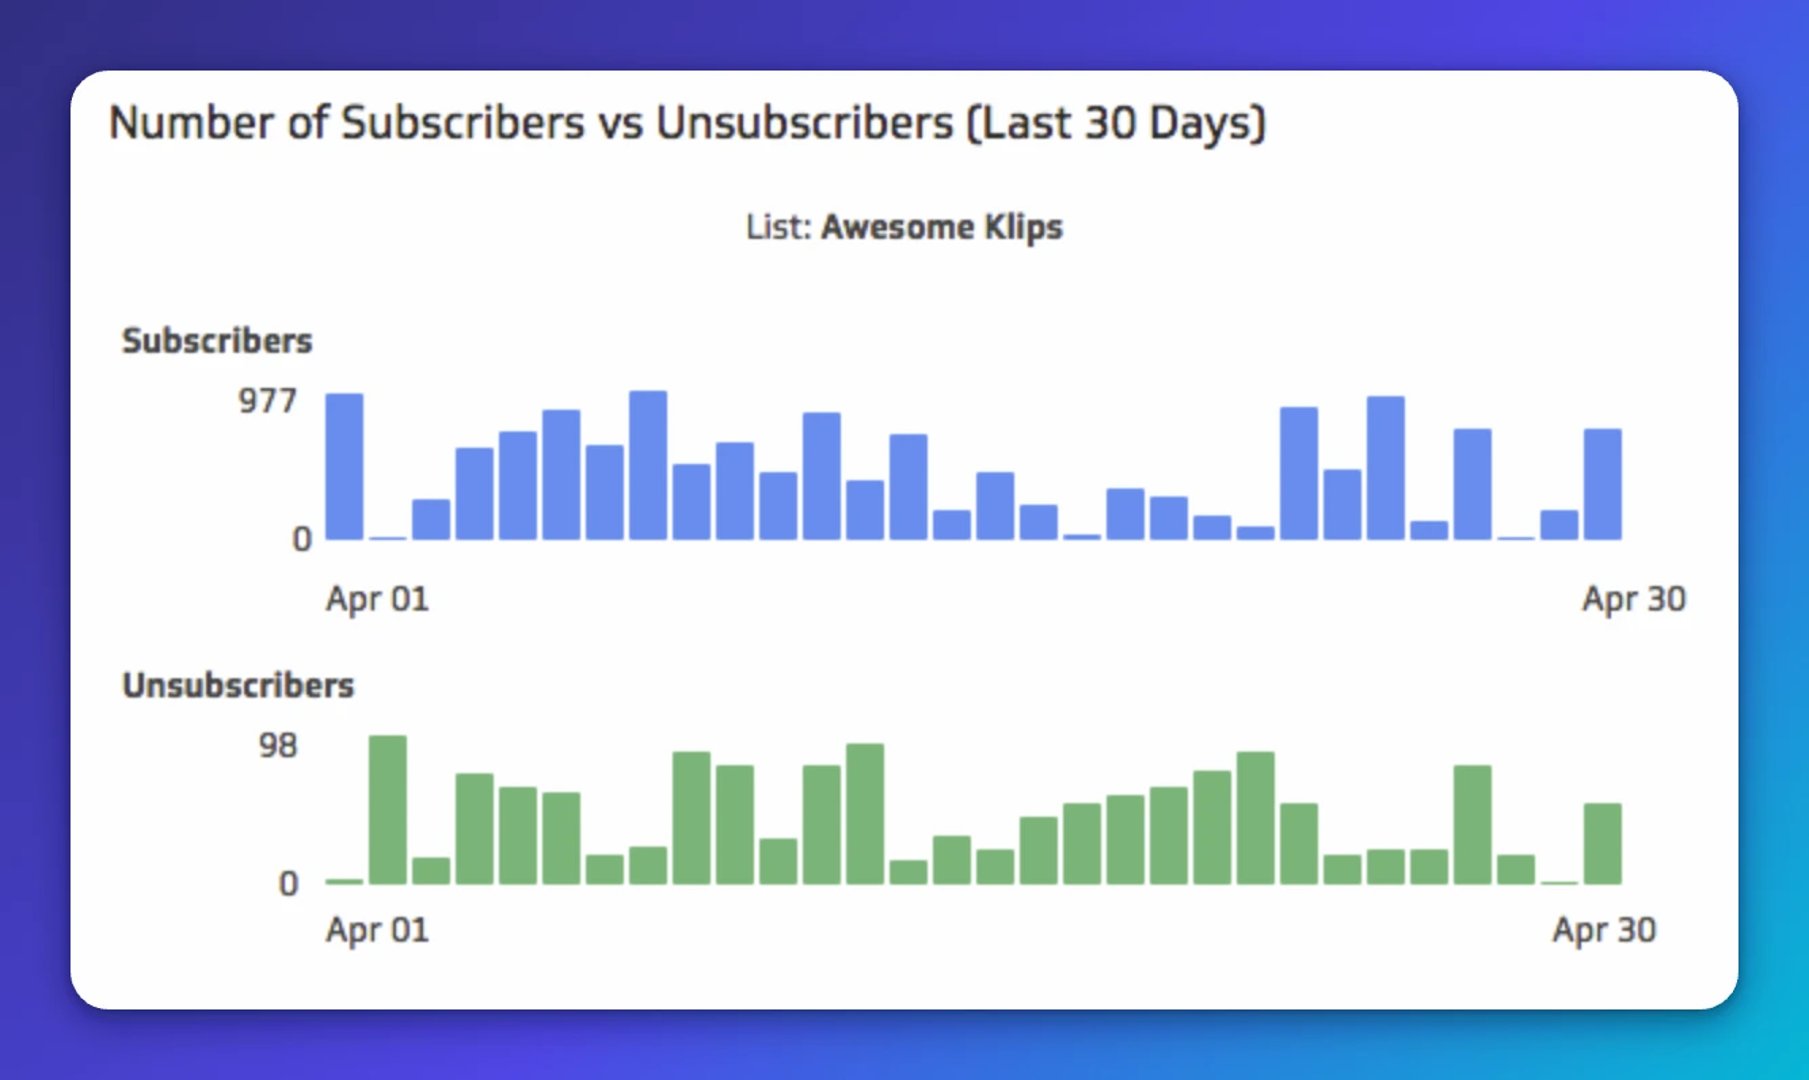
Your subscriber trend is a direct signal of audience health. If you're gaining more subscribers than you're losing, your content is earning its place in people's inboxes. If unsubscribes are climbing, something in the cadence, relevance, or content isn't working.
Track both numbers together, not in isolation. A spike in unsubscribes after a specific campaign is worth investigating immediately. The data below pulls from Campaign Monitor.
5. List rating
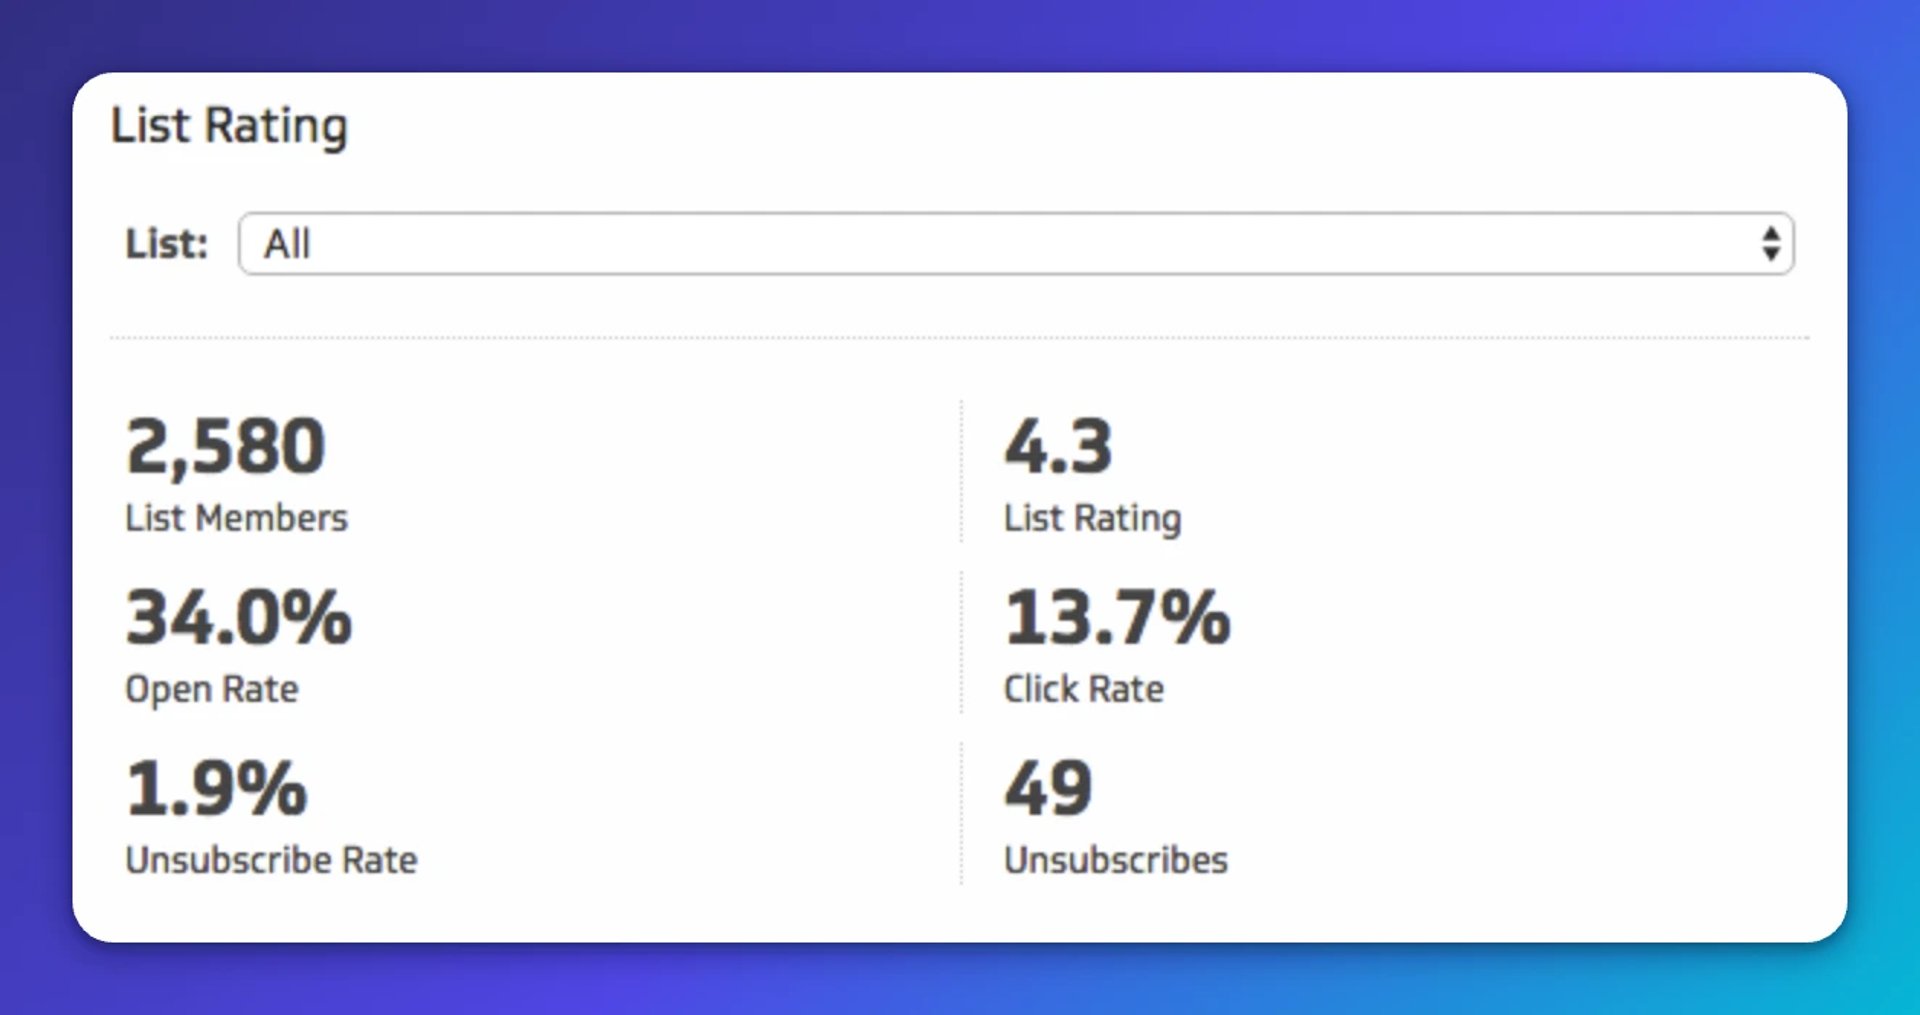
Not all lists perform equally. List rating combines open rate, click-through rate, and unsubscribe rate into a single score that reflects how engaged a specific audience segment is. A low list rating tells you the audience and content aren't aligned, before you burn more sends on a disengaged group.
Use list rating to prioritize your best-performing segments and diagnose the ones that need work. The data below pulls from Mailchimp.
6. Web traffic from emails
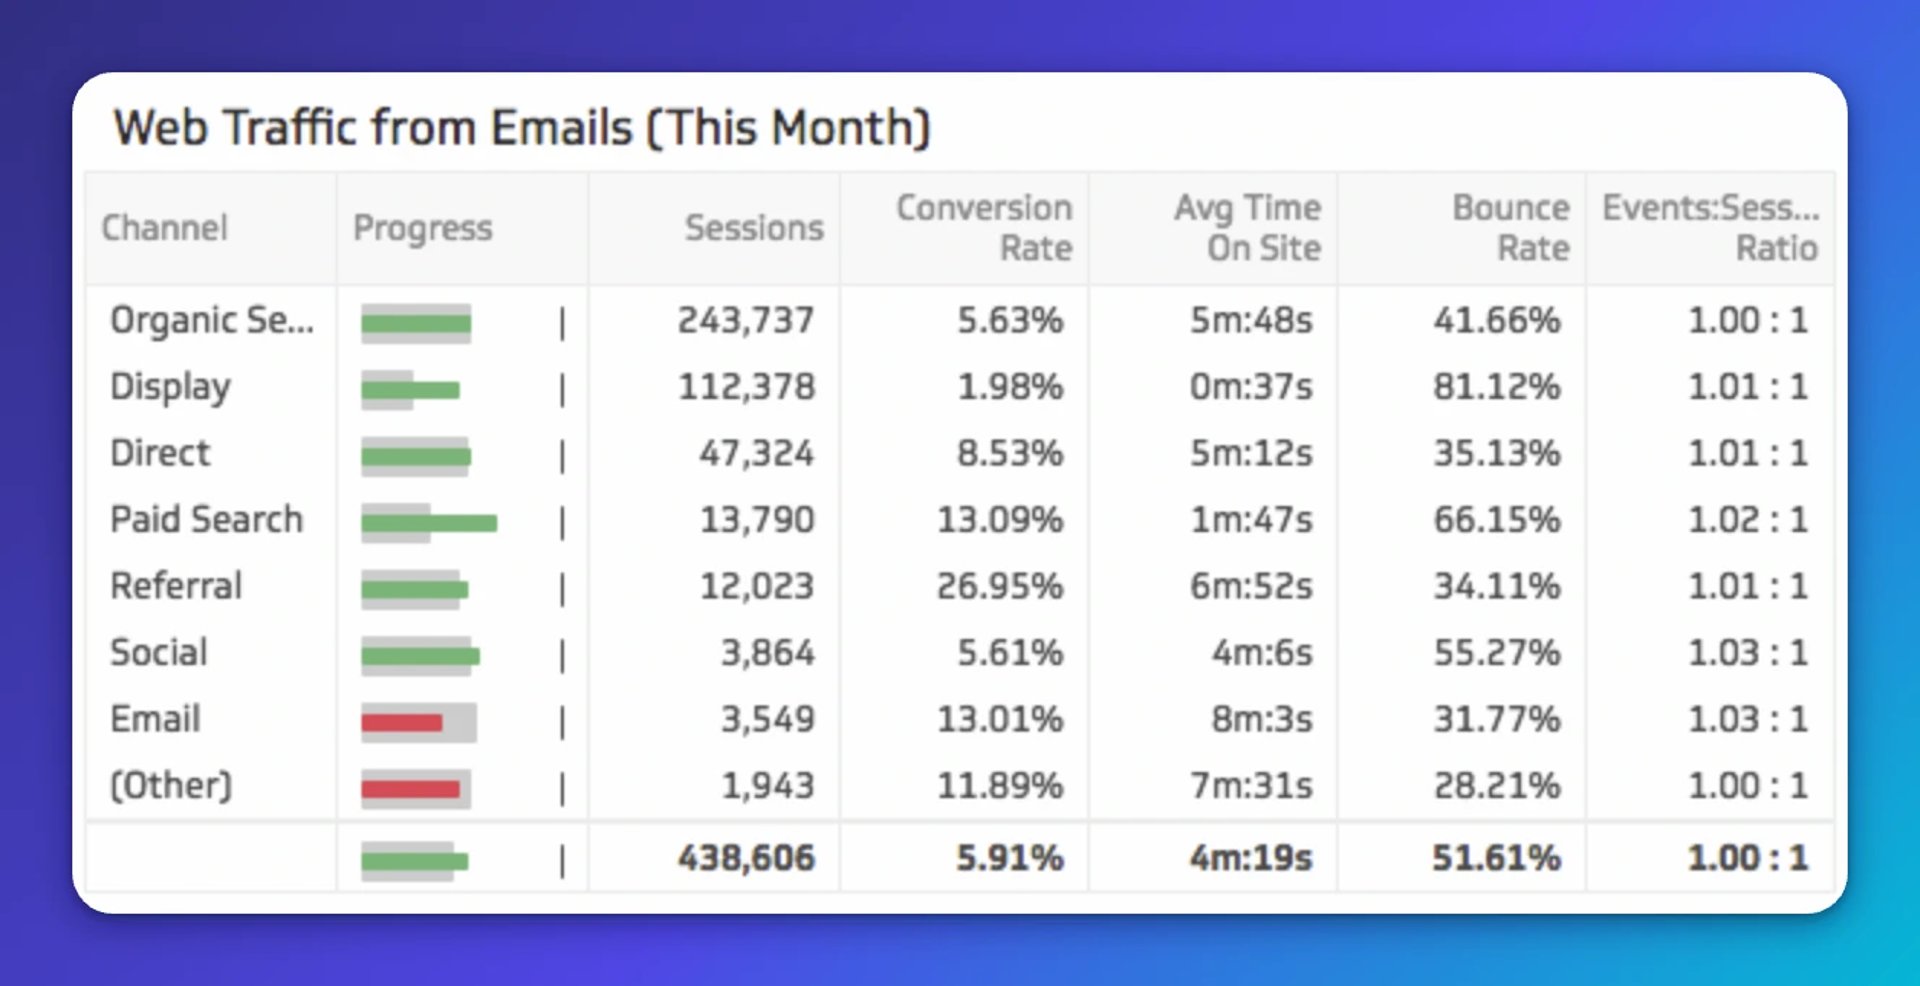
Clicks inside an email are only part of the story. What happens after the click matters just as much. Tracking web traffic from email campaigns shows you whether recipients are engaging with your site, reading more content, and moving toward a conversion.
Monitor time on site and pages per visit alongside raw traffic volume. These numbers tell you whether your email content is setting the right expectations for what comes next. The data below pulls from Google Analytics.
Create custom dashboards for you and your team.
Get started with KlipsBuild your email marketing dashboard
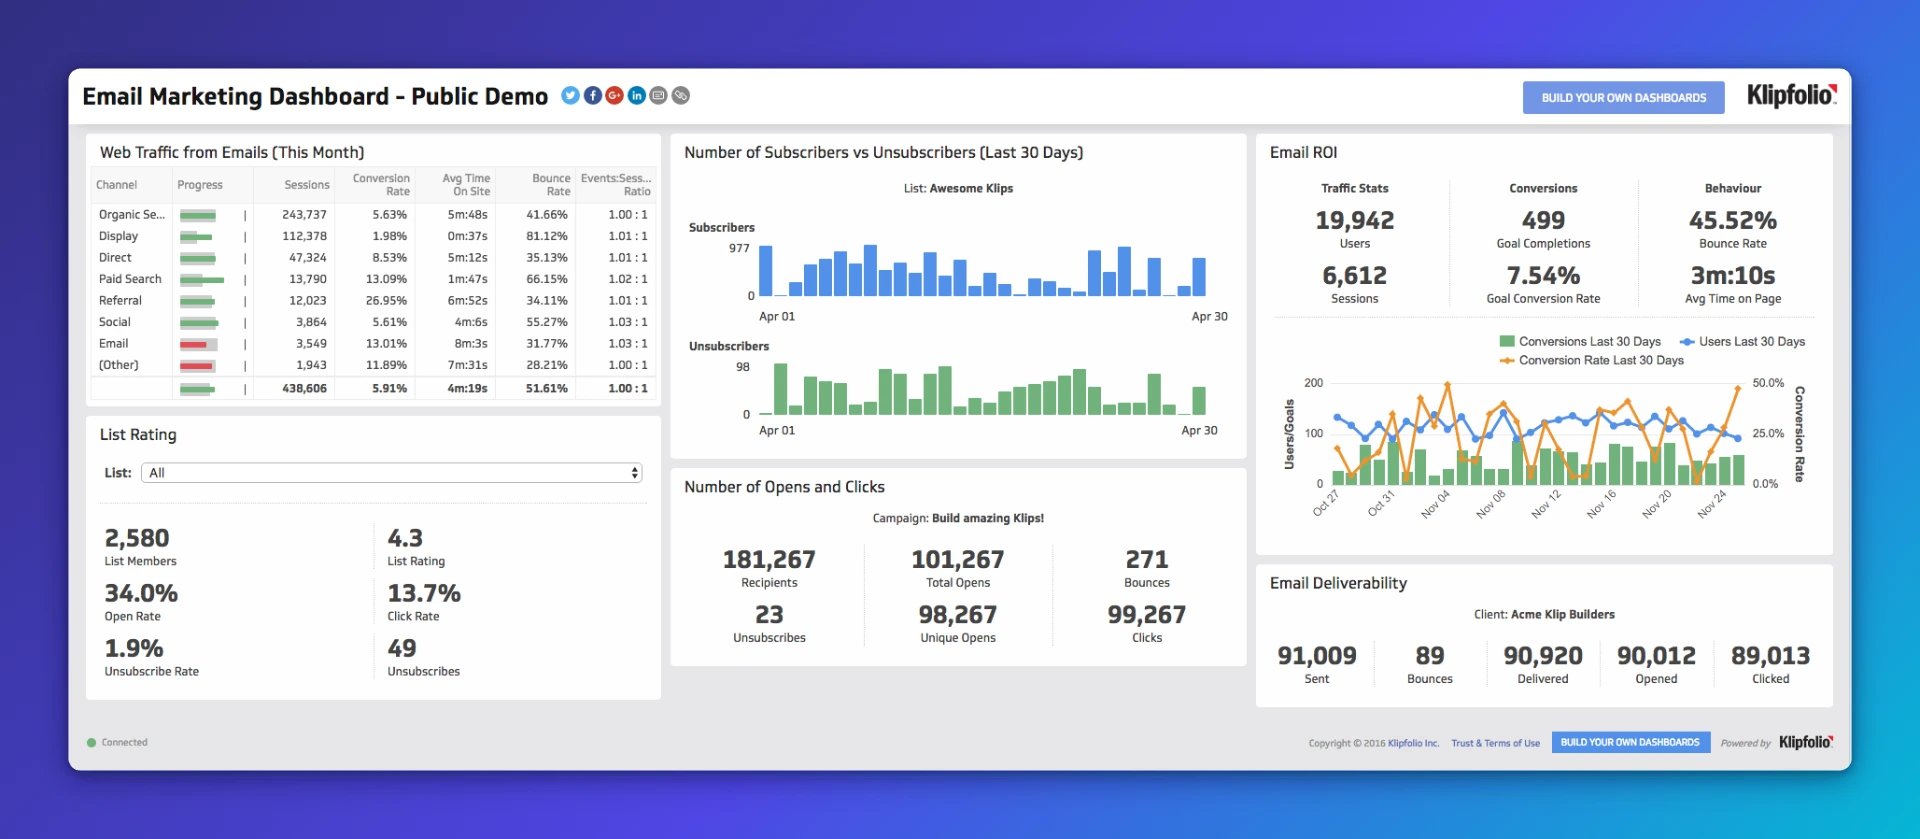
Tracking these six metrics in separate tools means you're always a few steps behind. Bringing them into one data dashboard means you see the full picture at once, without having to pull reports or piece together numbers from different platforms.
With Klipfolio, you can connect to Campaign Monitor, Mailchimp, HubSpot, Marketo, and more, then build a live email marketing dashboard in minutes using ready-made Klips. Your numbers stay current, your team stays aligned, and you spend less time chasing data and more time acting on it.
View the live email marketing dashboard example
Also see:
Published 2026-08-24




Most recent
- AUG 11Beyond simple sign-ups: how True Trials and Activation predict growth
- JUL 7Why business leaders miss important trends in their dashboards
- JUN 19The best chart for the job: Visualizing data for non-technical users
- JUN 95 tips to understand (and organize) your restaurant data
- MAY 26Think in Horizons, Not Seconds
- MAY 2010 Cloud BI Dashboard Tools for Small Businesses in 2026