

5 KPIs to track your e-commerce store success
Tracking the right ecommerce KPIs removes guesswork and helps you make faster, more confident decisions about where to invest and what to fix. This article covers five essential KPIs for e-commerce store success: traffic, cart abandonment, average order value, conversions, and customer lifetime value. For each KPI, you'll find how to measure it in GA4, what benchmarks to expect, and practical steps to improve performance. You can monitor all five on live dashboards in Klipfolio Klips so your team always works from the same data.

Blind spots kill e-commerce growth. You might be spending on the wrong channels, losing sales at checkout, or winning customers who never come back. Tracking the right ecommerce KPIs tells you where the gaps are and what to do about them.
A data-driven approach removes guesswork. It helps you make faster, more confident decisions about where to invest and what to fix.
These five KPIs give you a clear picture of what's working across your store:
- Traffic. Improve your marketing and advertising mix to bring in more visitors.
- Cart Abandonment. Find and fix issues that stop customers from completing checkout.
- AOV. Identify channels that bring higher spenders.
- Conversions. Turn more sessions into sales.
- CLV. Attract and retain high-value customers.
You can track all five on live dashboards in Klipfolio Klips and share reports with your team, so everyone sees the same numbers without anyone having to pull them manually.
1. Traffic
Getting visitors to your site is the first hurdle. You likely use a mix of channels. When you measure traffic, you see which channels are earning their place and which ones aren't.
Online retailers get most of their traffic from organic and paid search. Email and social also contribute:
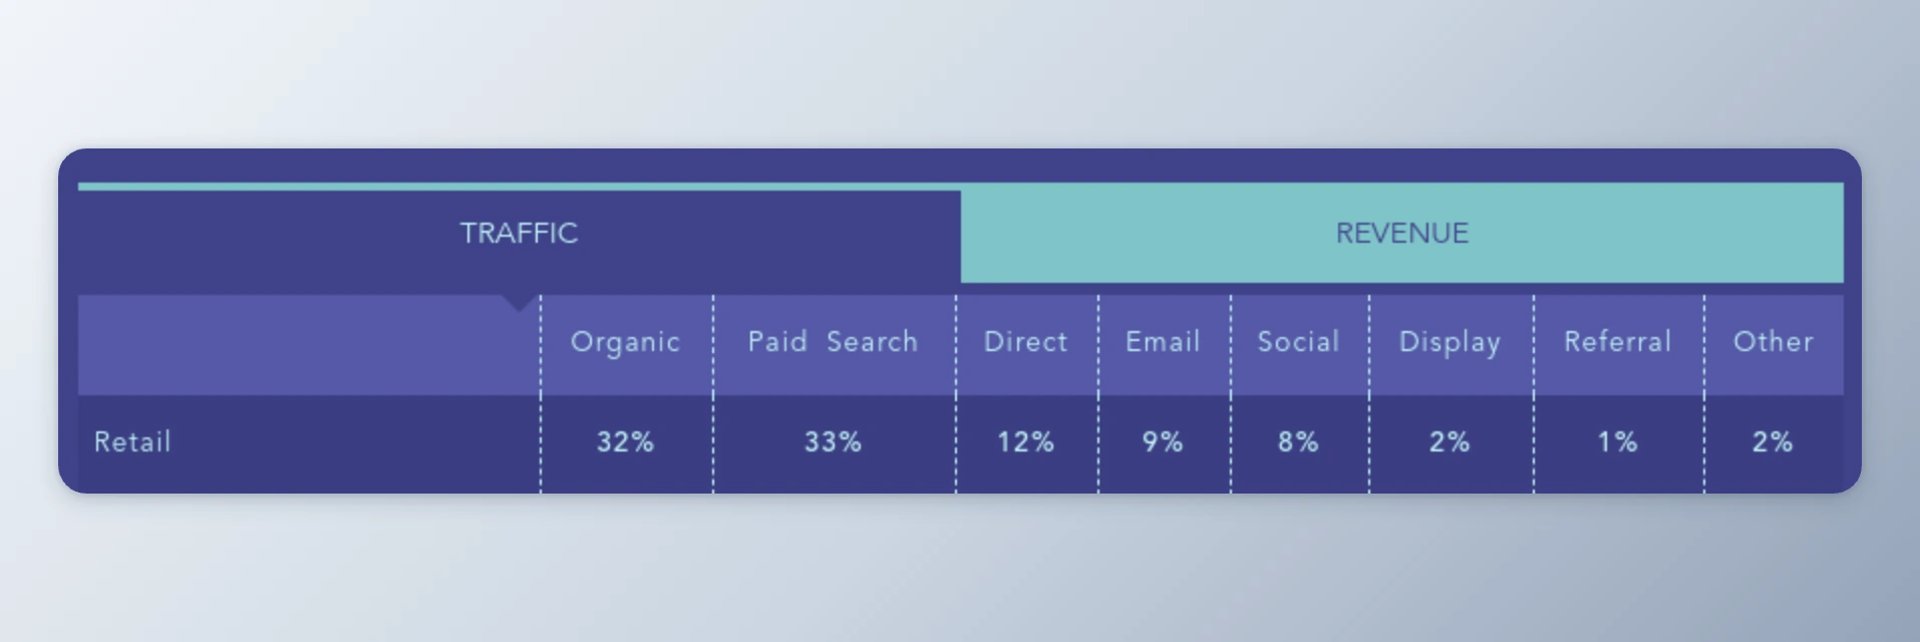
In Google Analytics 4 (GA4), use Reports > Acquisition to review trends, sources, and campaigns. The screenshot below shows a legacy view for context:
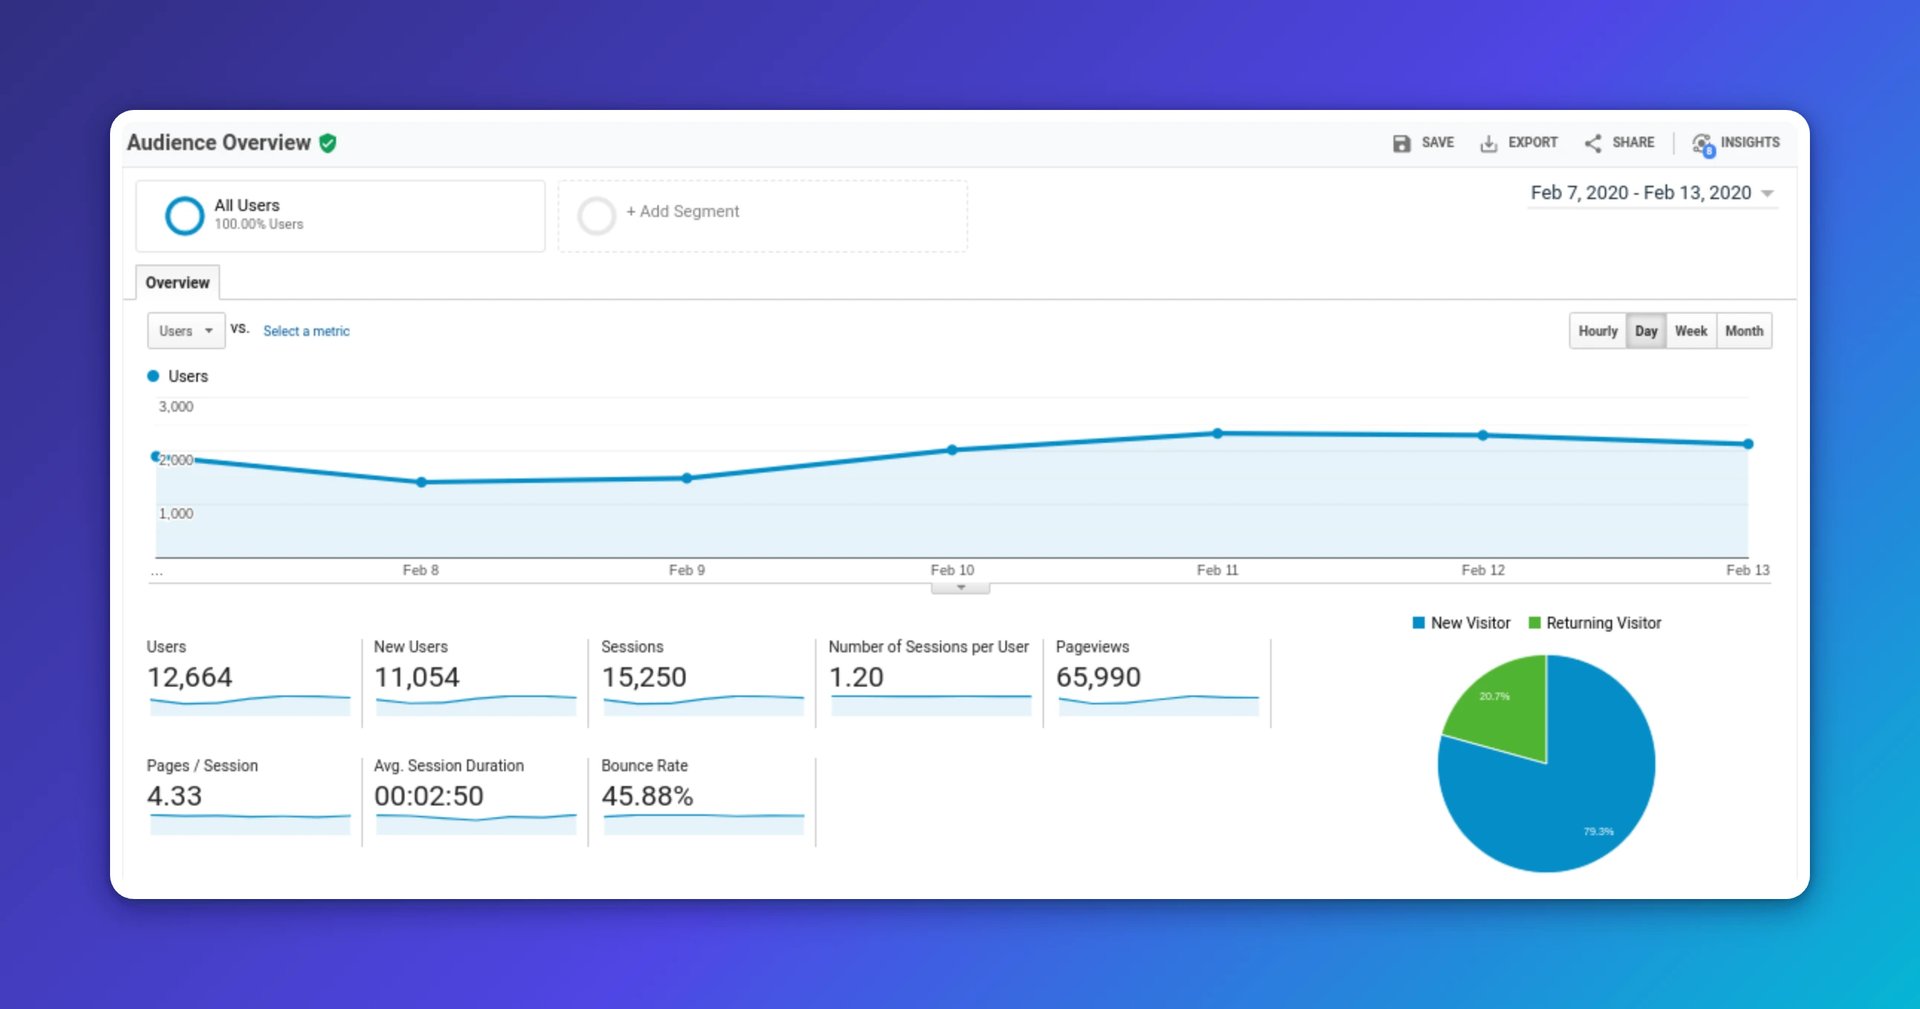
Watch your bounce rate, or the inverse, engagement rate. Both tell you whether visitors stick around or leave after one page.
To compare channels, open GA4 Reports > Acquisition > Traffic acquisition. You can compare source/medium against engagement and conversion metrics side by side.
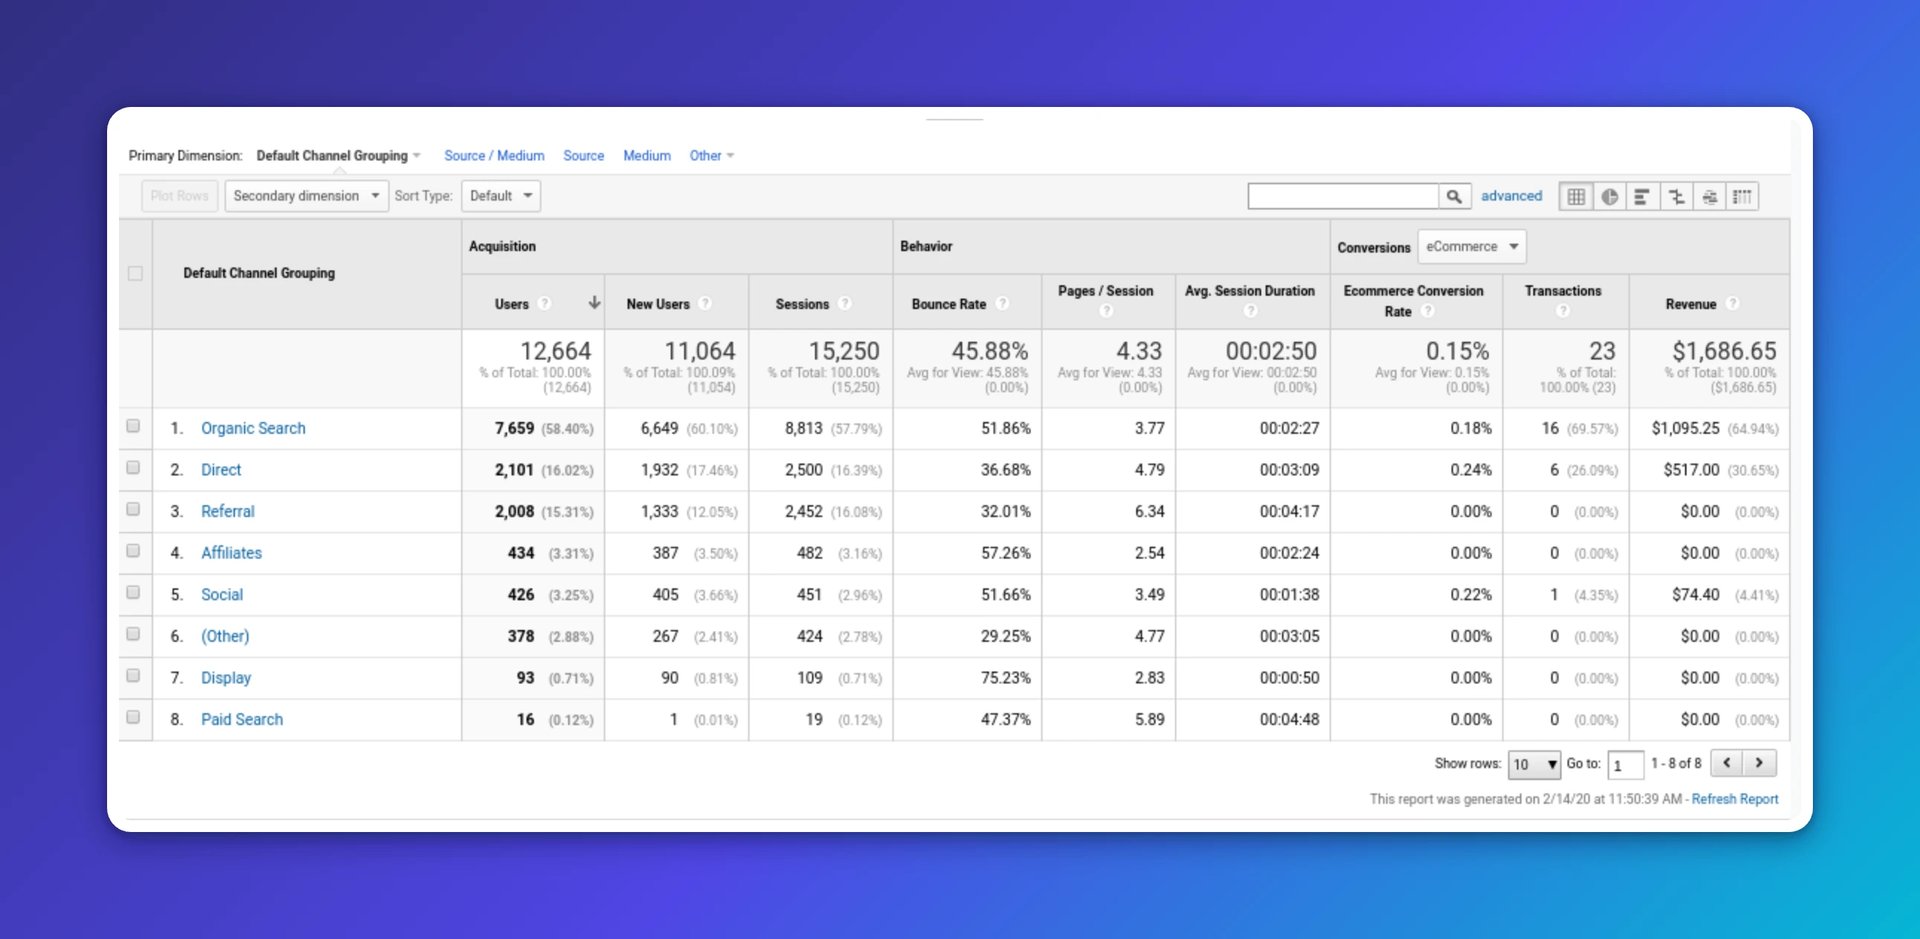
Once you know what the numbers say, act on them. Double down on channels that send qualified visitors. If social is working, expand those campaigns. If on-page SEO isn't moving the needle, test new formats, such as interactive guides from Outgrow. Keep experimenting, learn what sticks, and tune your mix. The goal isn't more data; it's knowing where to put your next dollar.
2. Cart abandonment
Cart abandonment rate is the share of users who add items to a cart but leave before purchasing. Every abandoned cart is revenue you almost had.
On average, about three in four users abandon their carts. Knowing where you stand tells you how much room you have to recover.
A high abandonment rate usually points to friction in your site or app. Track it over time so you can see whether changes help.
In GA4, track key checkout steps as events and mark completed purchases as conversions. Use Explorations > Funnel to see exactly where users drop off. The chart below illustrates the concept using a legacy report:
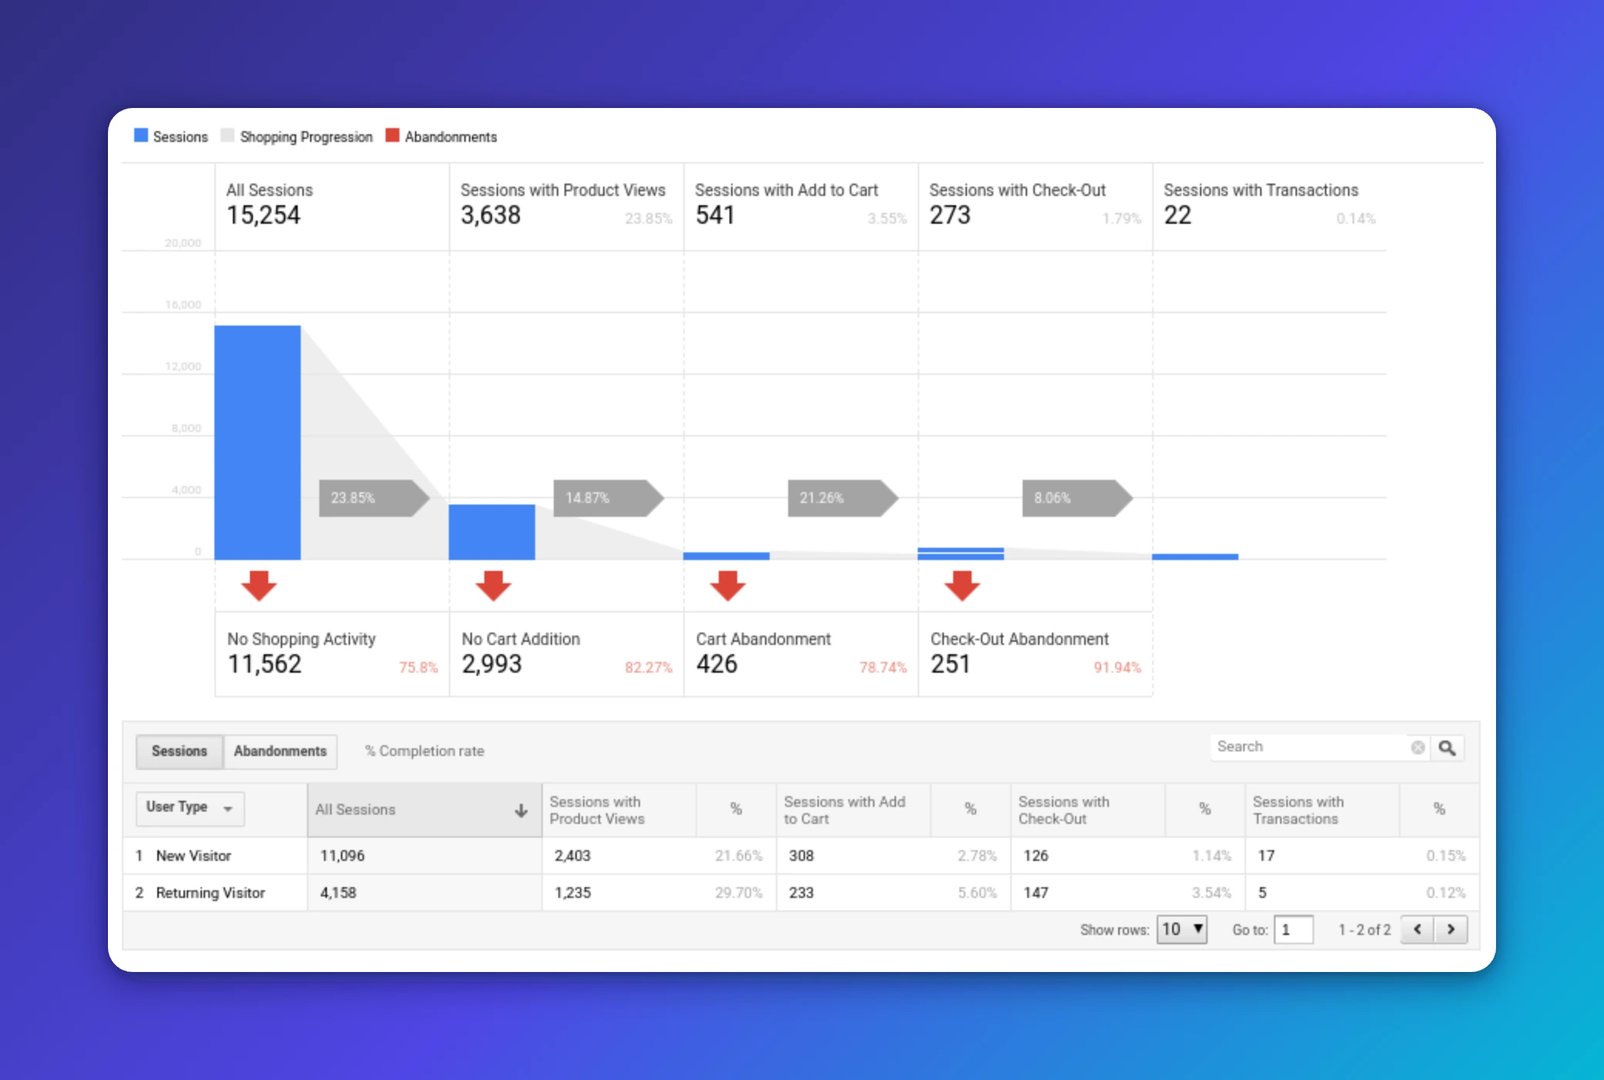
The top reasons shoppers abandon are extra costs, forced account creation, and a complicated checkout:
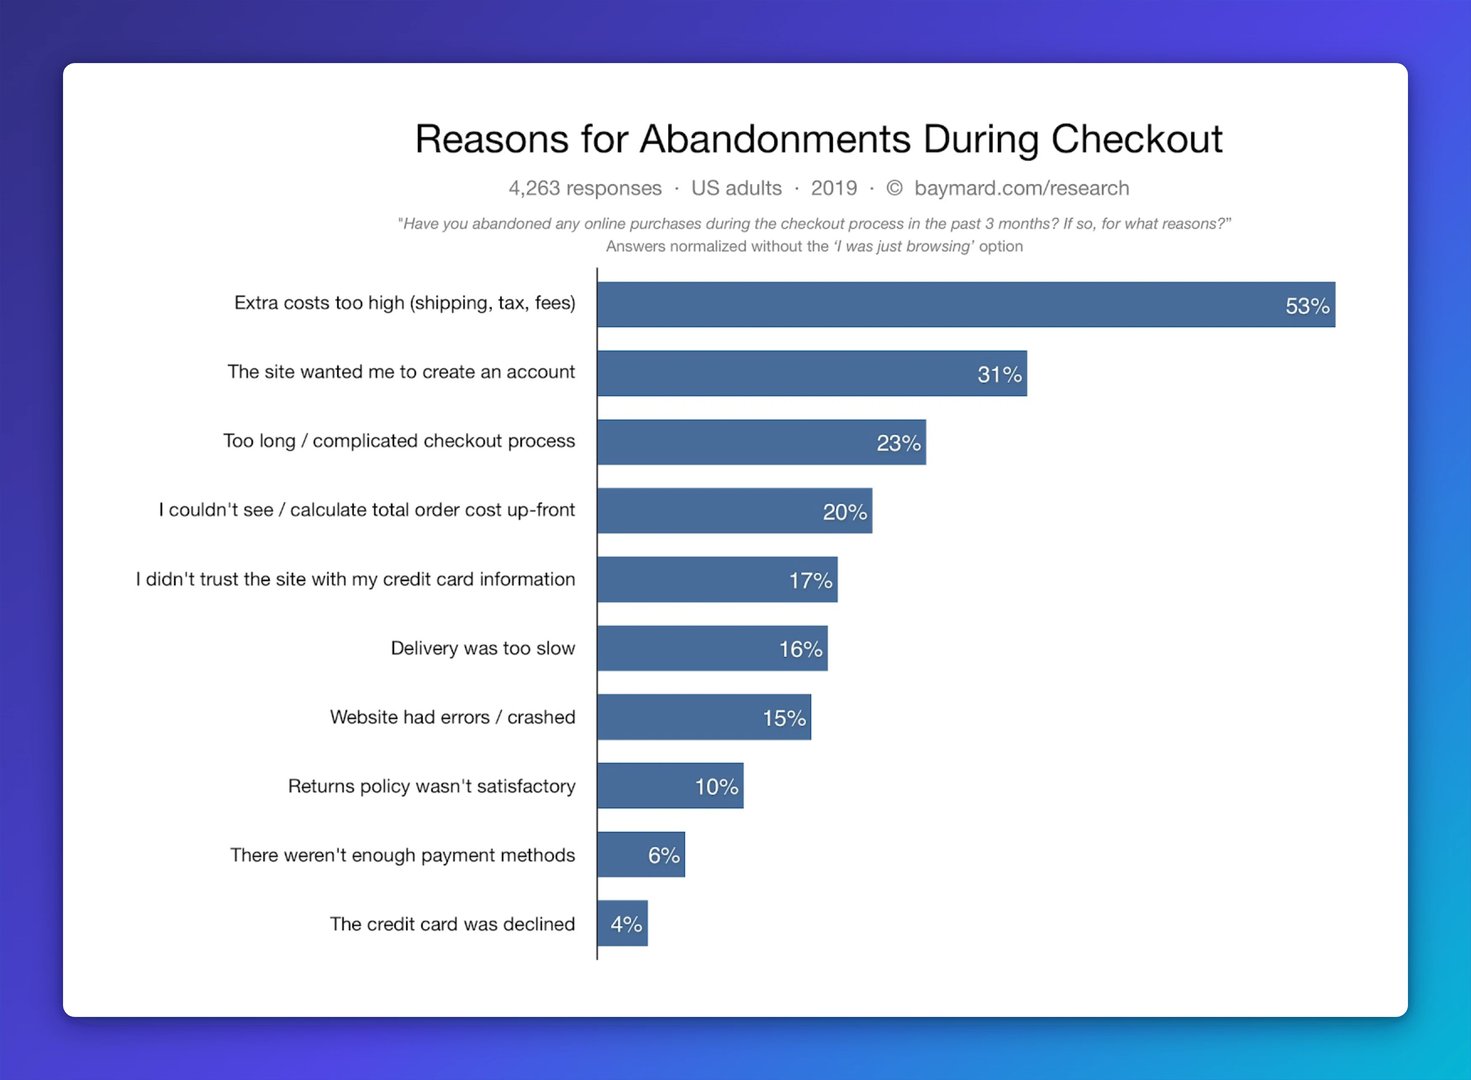
Start with the friction that costs you the most. Reduce shipping costs or lower the free-shipping threshold. Allow guest checkout. Run user tests or review screen recordings to spot where people hesitate.
An exit-intent pop-up can recover a sale before the visitor leaves, like this example:

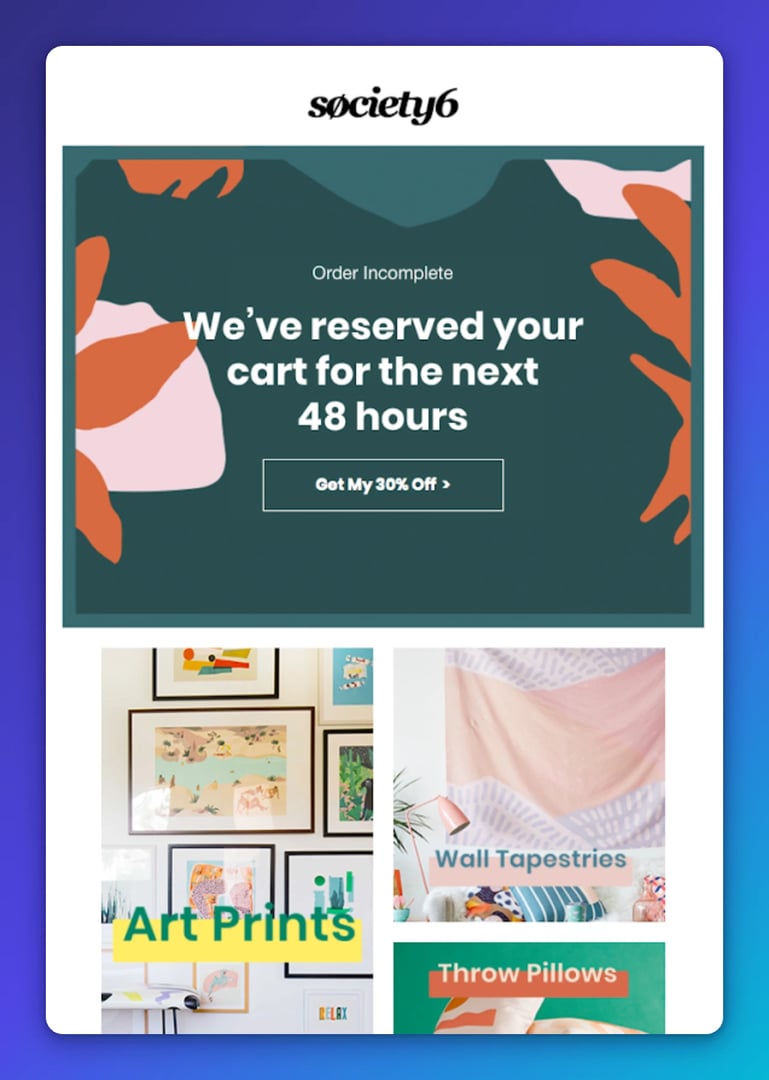
A well-timed follow-up email can bring them back, like this one:
Create custom dashboards for you and your team.
Get started with Klips3. Average Order Value (AOV)
Average order value is the average amount spent per transaction. Raising AOV grows revenue without finding new customers, which makes it one of the highest-leverage moves available to a lean team.
Benchmarks vary by industry and device. Here's a snapshot:
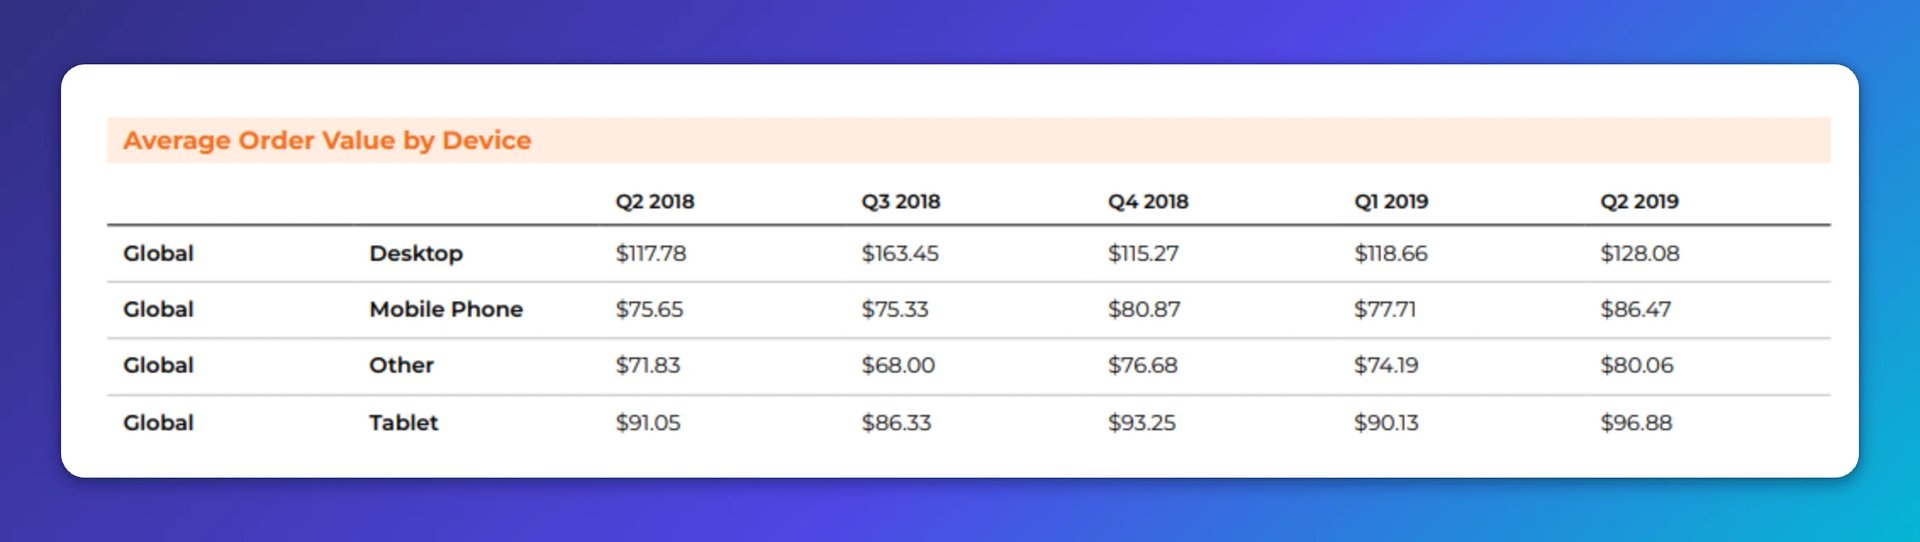
To check your AOV in GA4, add "Average purchase revenue per user" and related metrics to your standard reports, or build an Exploration:
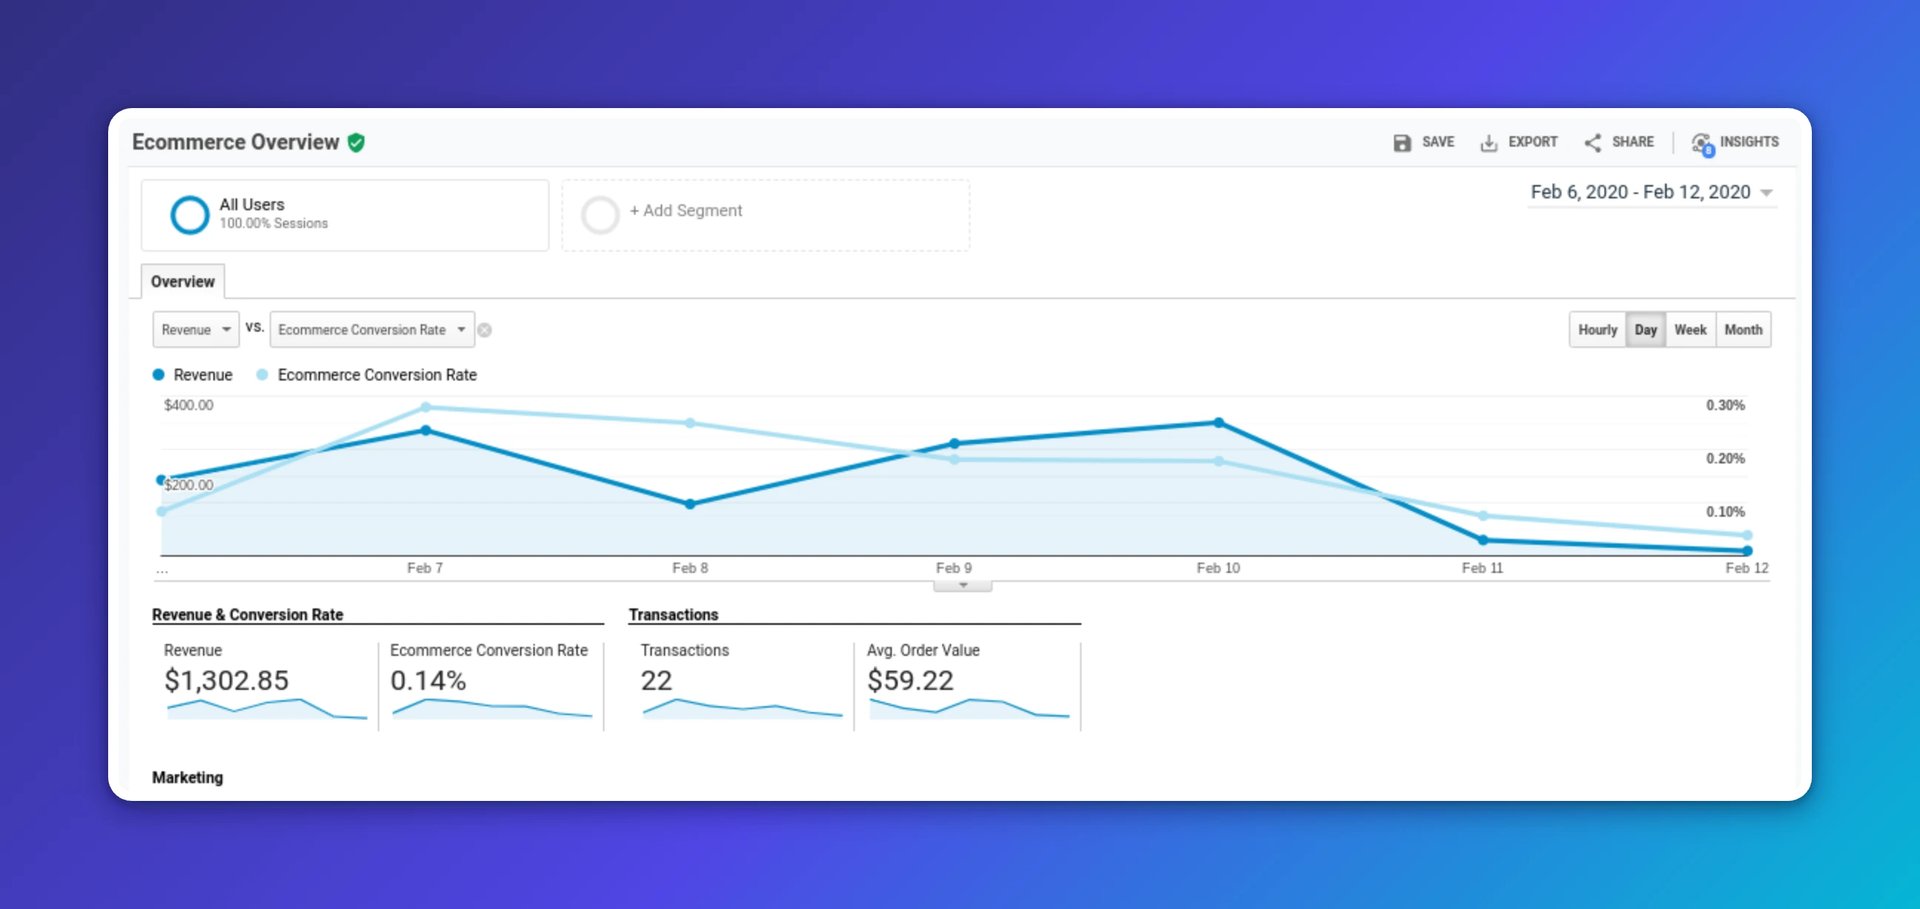
You can also compare AOV by channel. Review acquisition reports and the e-commerce tabs to see which sources drive higher spend:
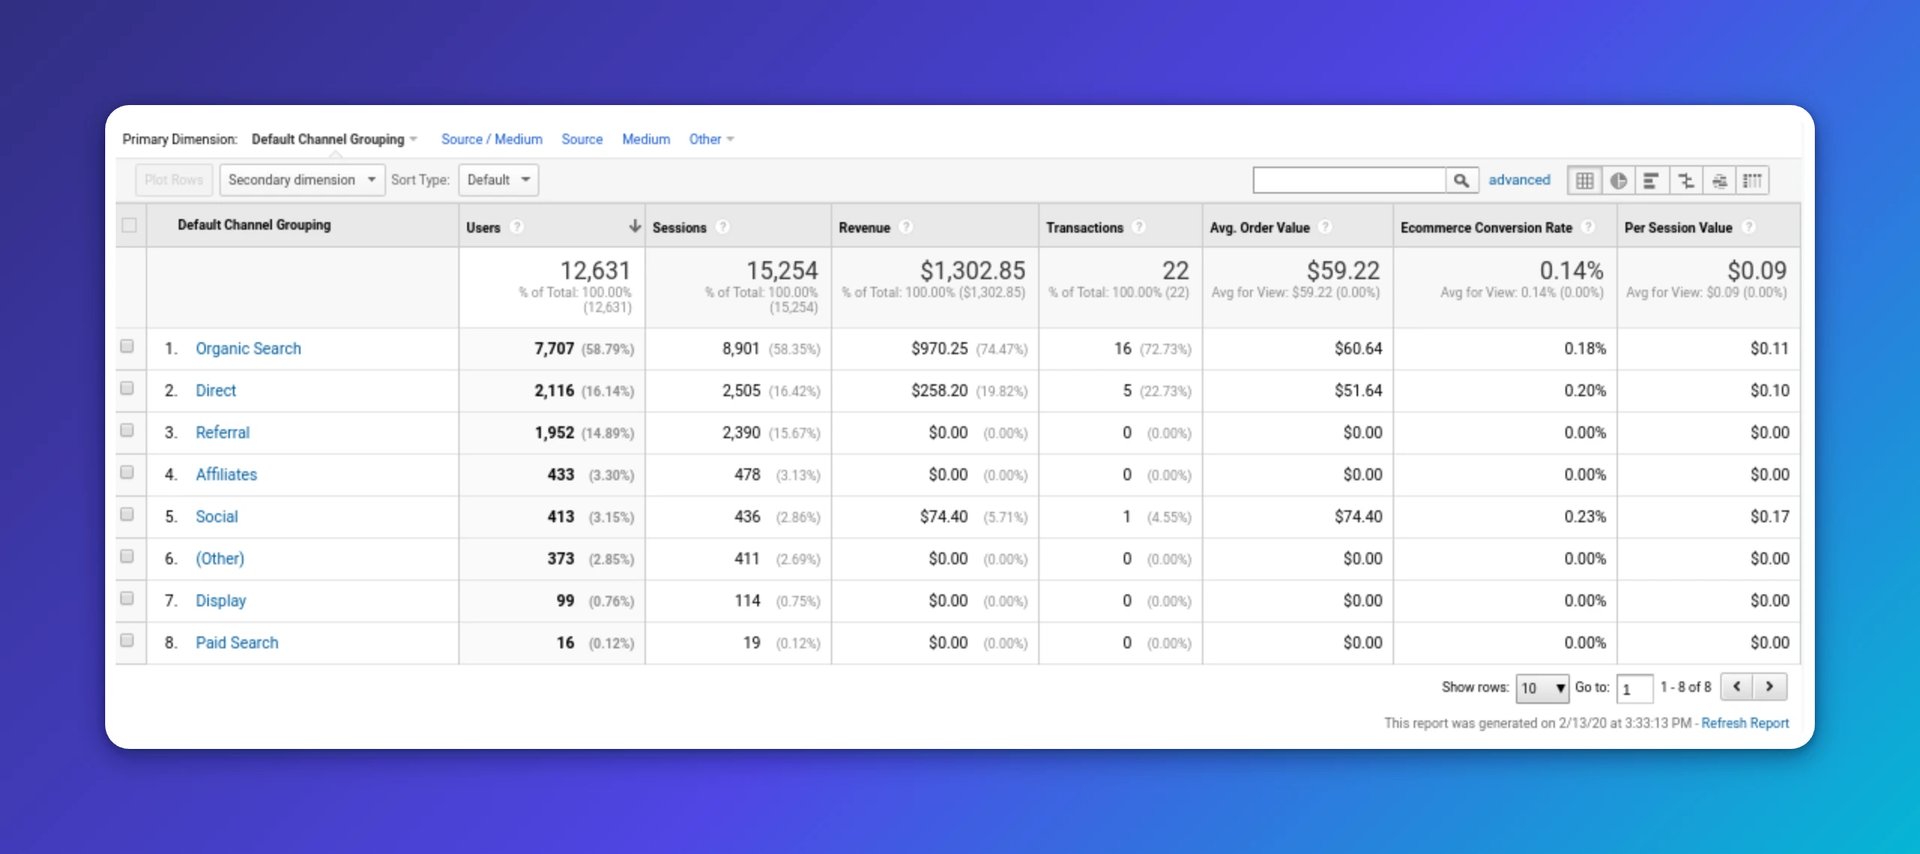
To raise AOV, adjust your store experience:
- Upsell to a higher-tier product. Show a premium configuration with more features or capacity.
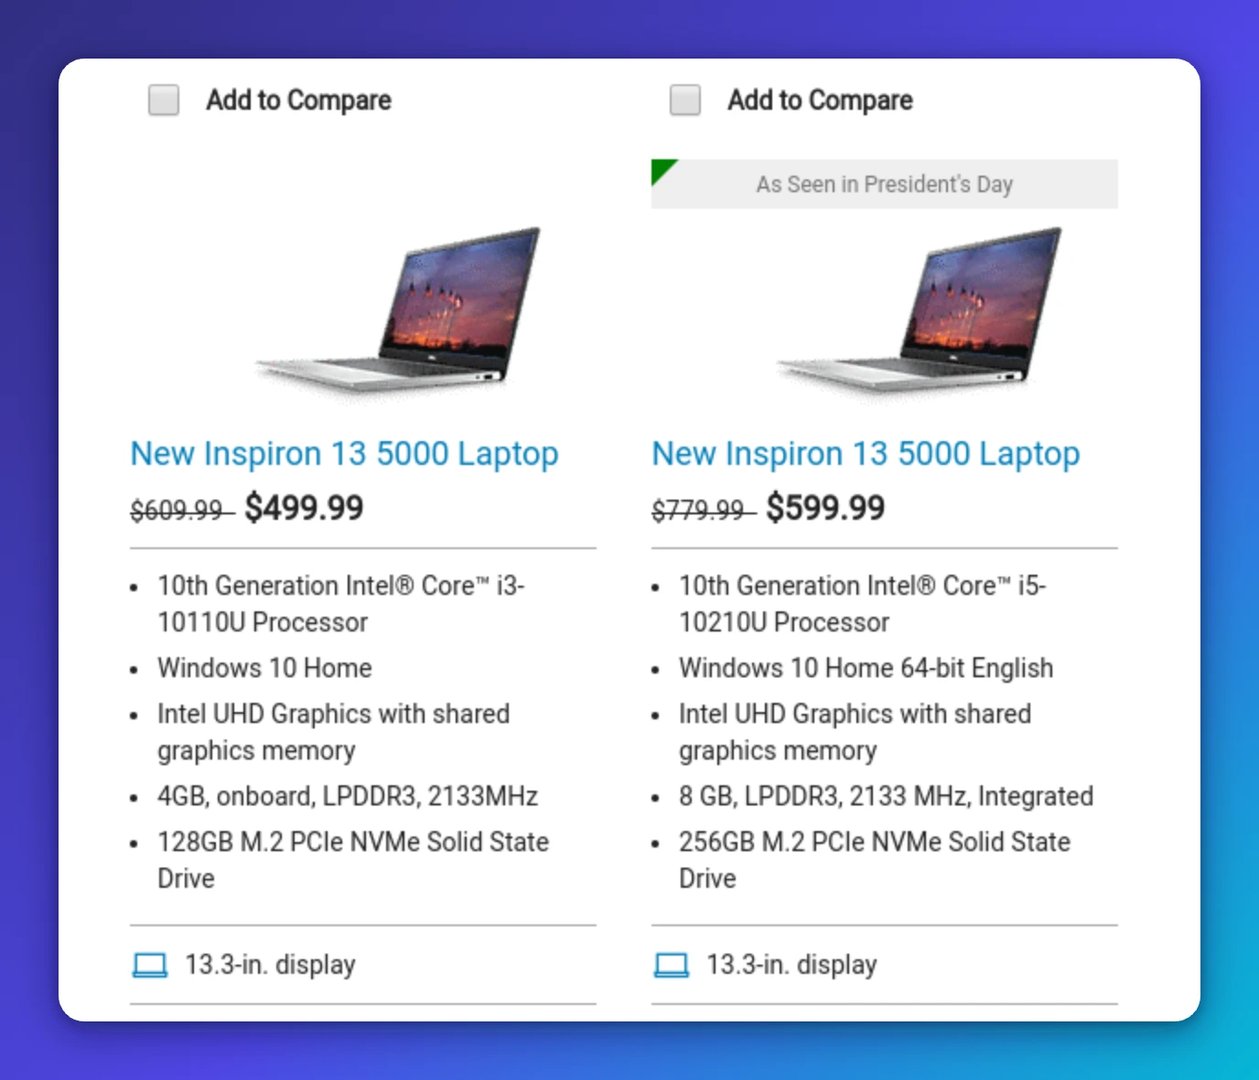
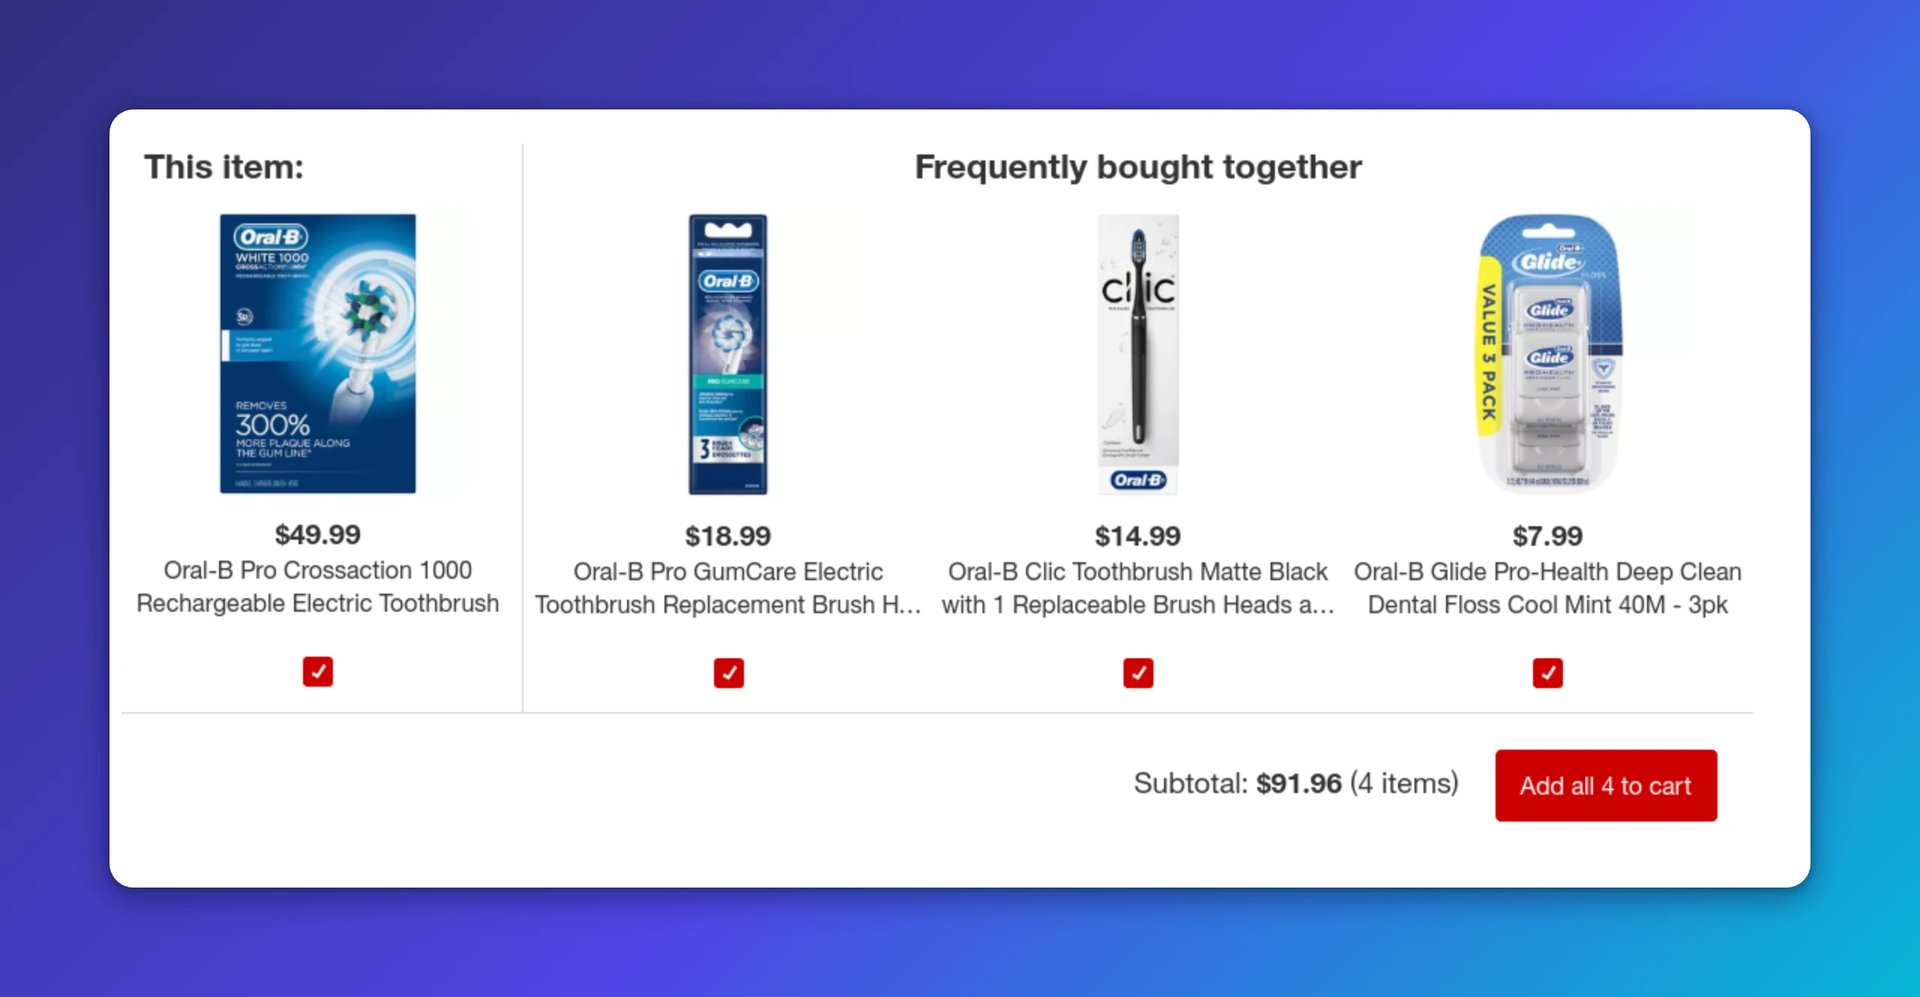
- Cross-sell related items and add-ons. Surface complementary products at the right moment.
- Display spending thresholds clearly. Highlight free shipping once a customer hits a set spend.
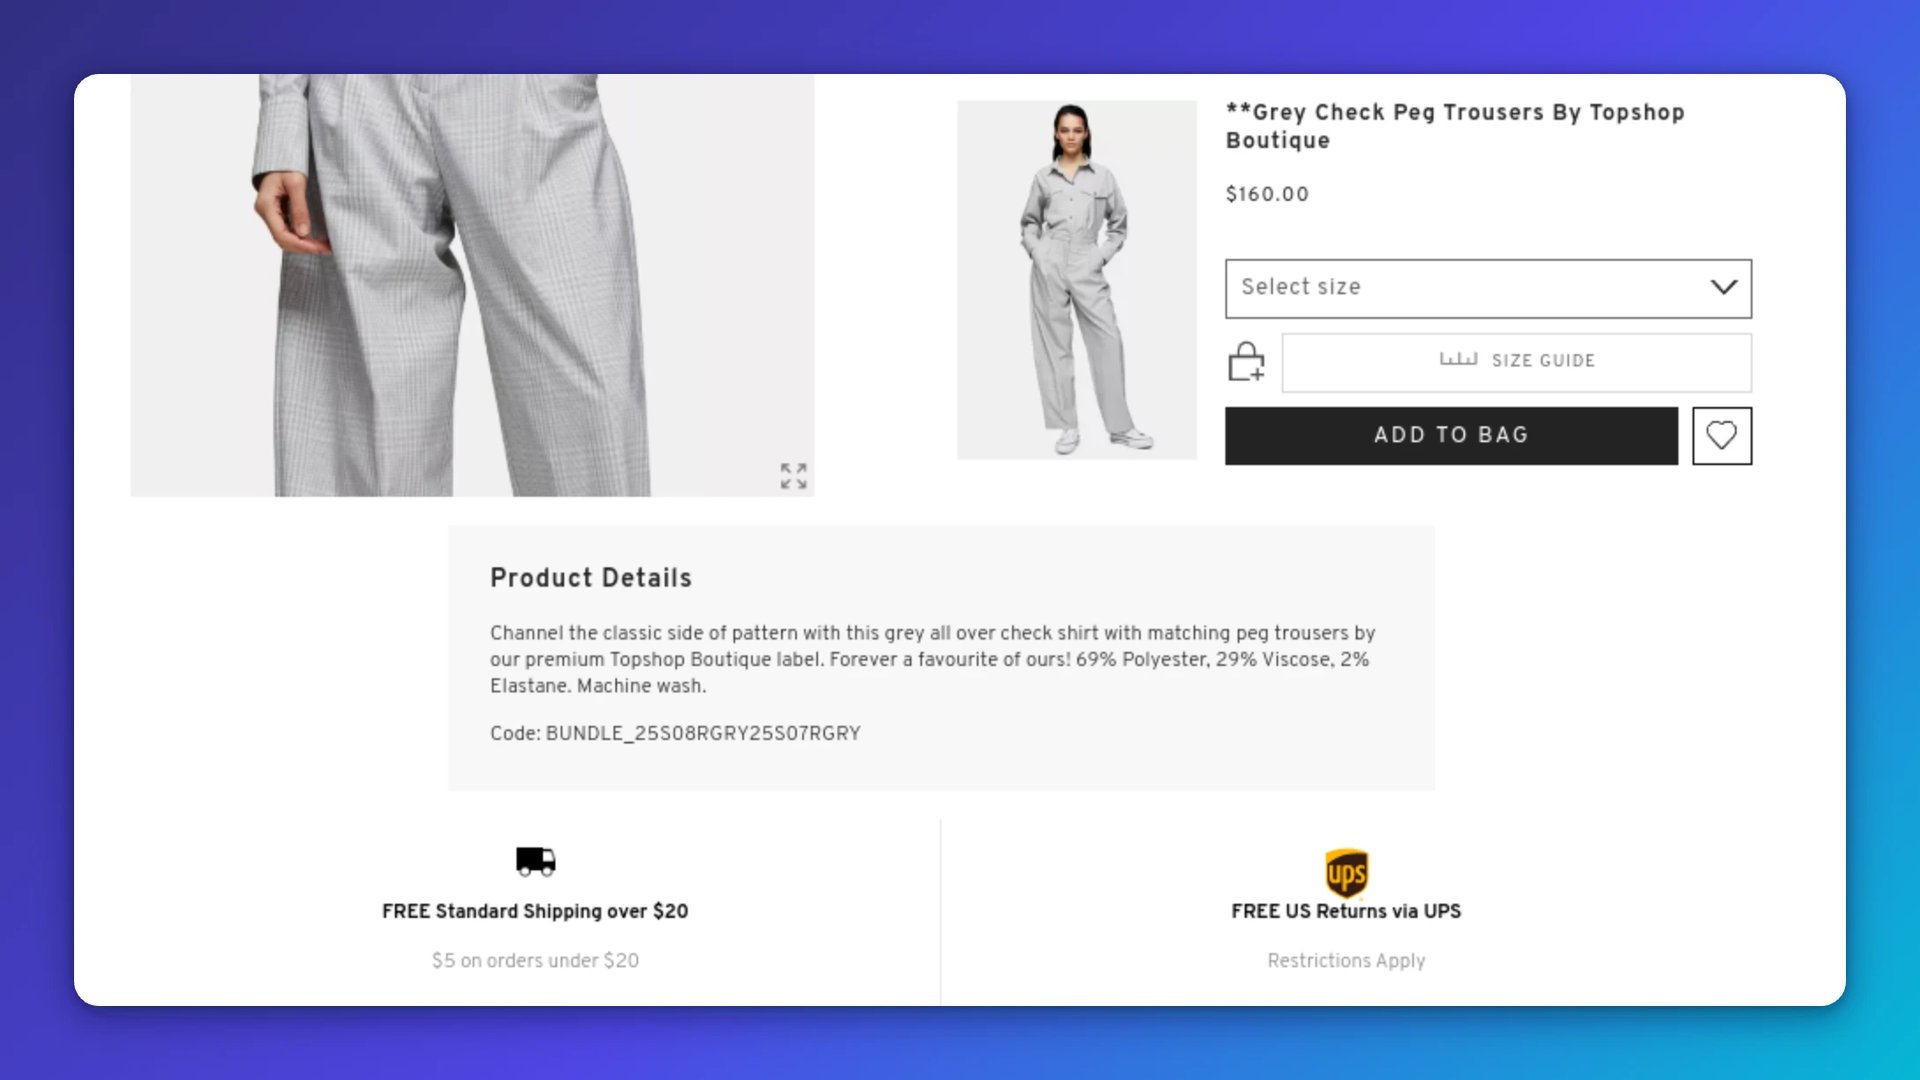
Each of these nudges works because it meets a customer at a decision point. When you track AOV alongside channel data, you stop guessing which campaigns bring the best buyers.
4. Conversions
Conversion rate is a core KPI, though it shouldn't be the only one you watch. The global average for online shopping is roughly 2.58–3.23 percent.
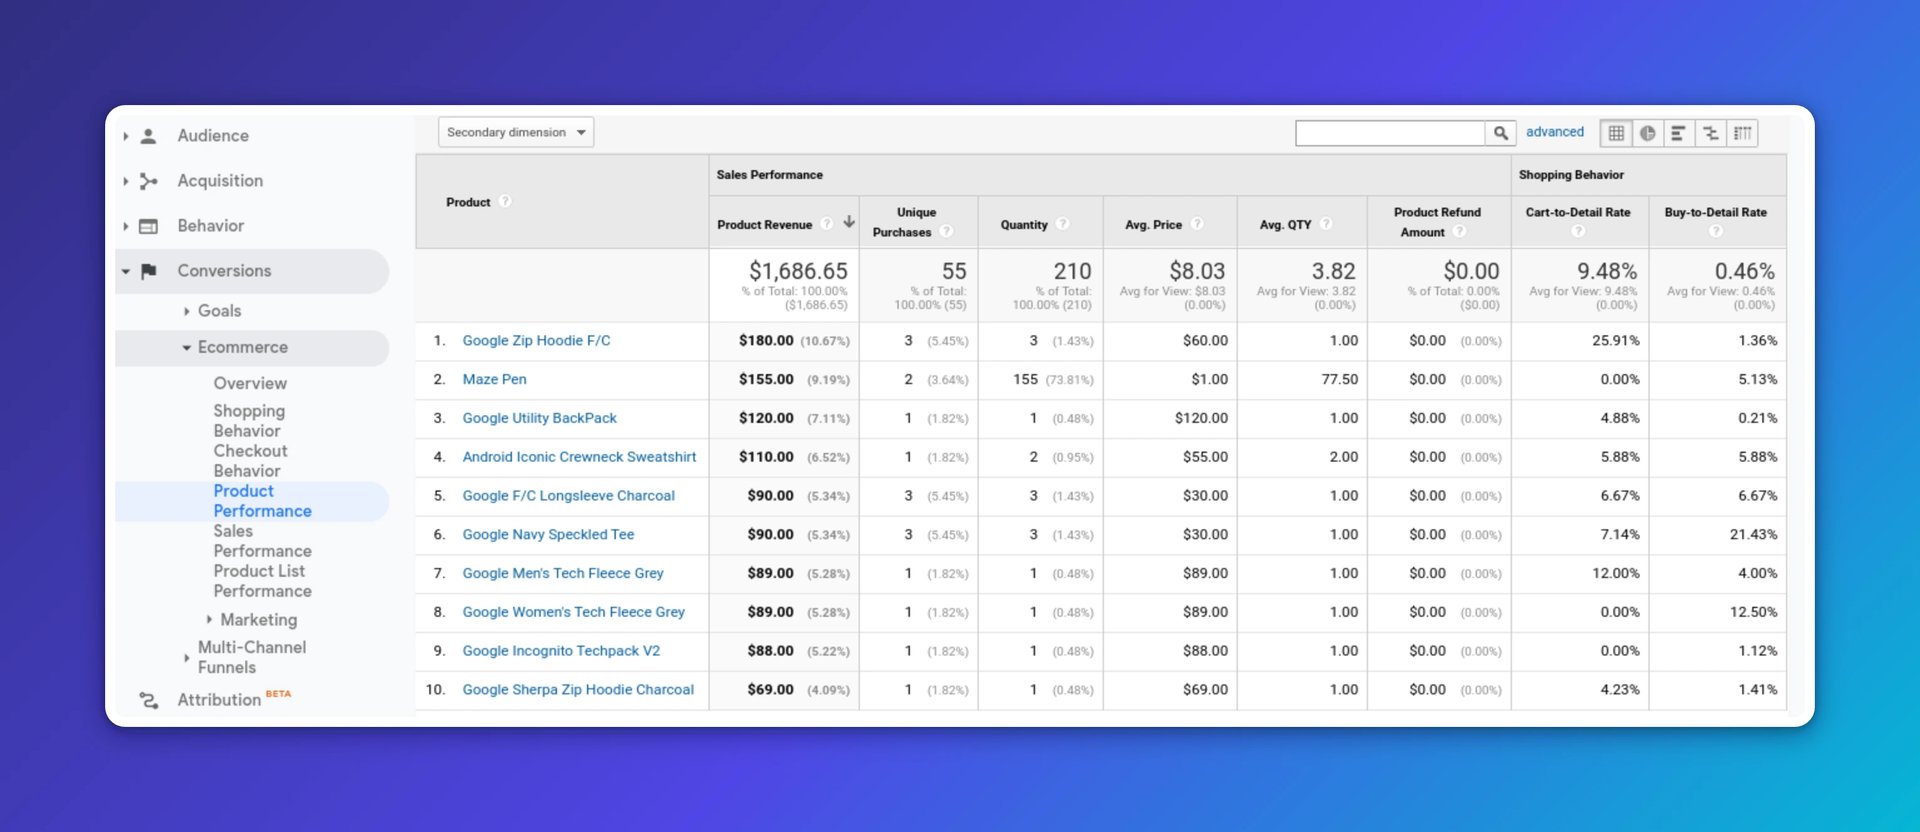
GA4 includes purchase revenue, item performance, and more in e-commerce reporting. Use it to see which marketing and sales efforts actually drive revenue:
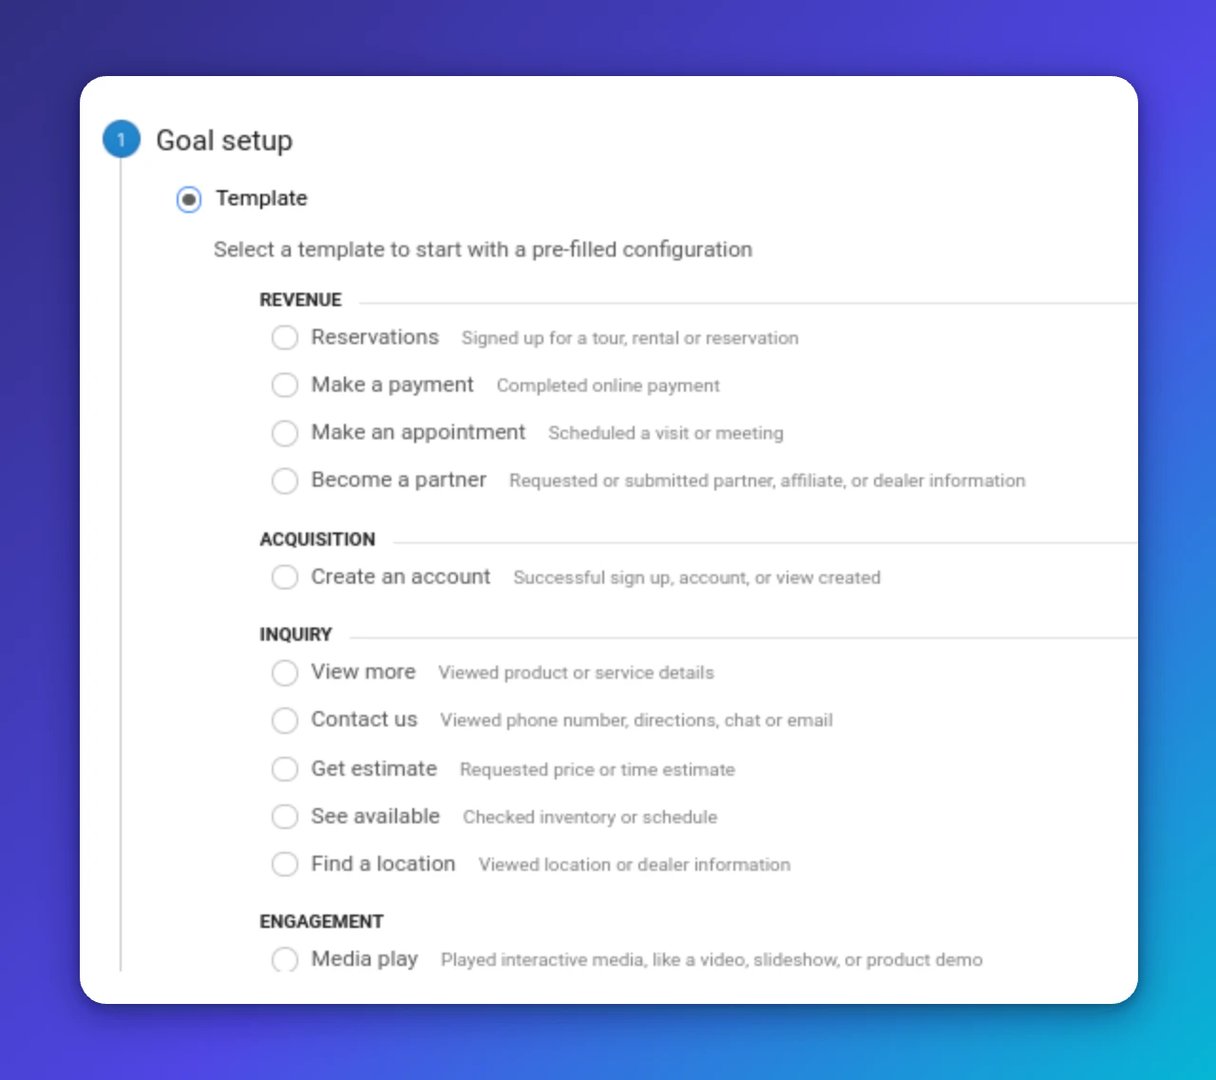
Set up conversions for the actions that matter most to your business. In GA4 Admin, mark key events as conversions. You can also track micro-conversions, such as email signups, to understand the full path to purchase. The screen below shows a legacy goals template list for reference:
Once you know where conversions happen and where they don't, you can improve the journey with confidence rather than instinct.
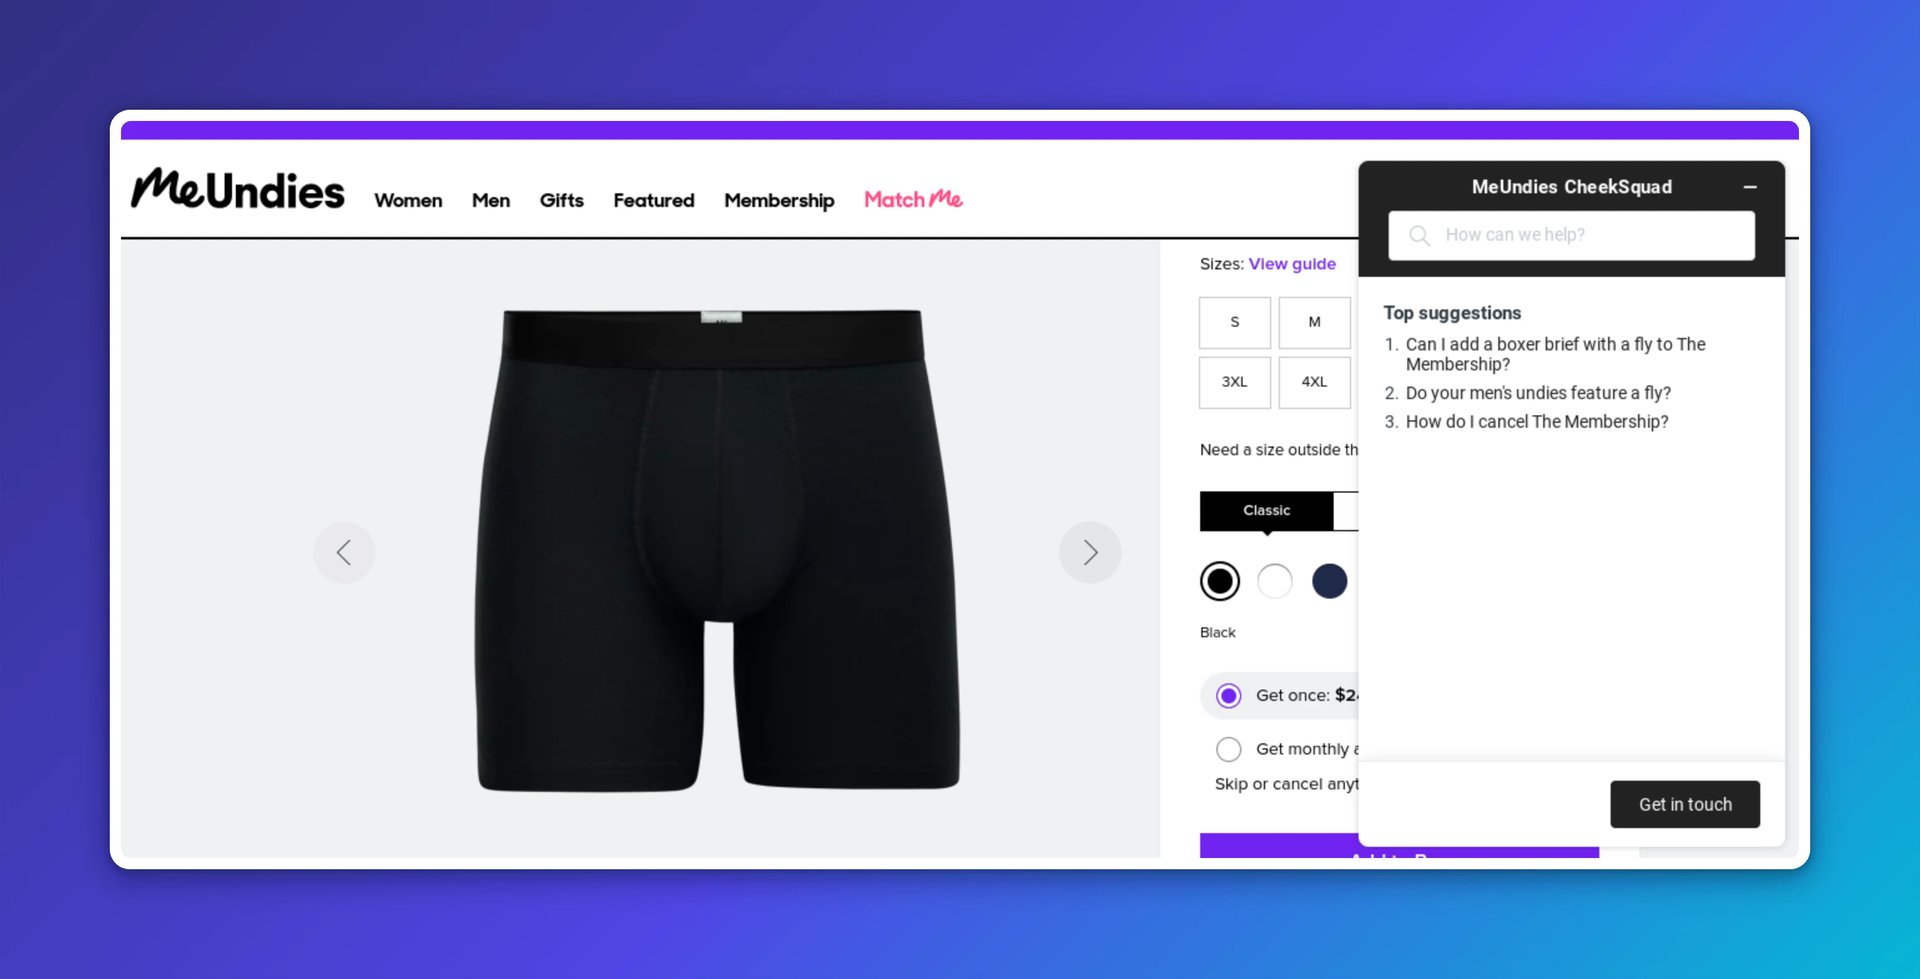
AI-assisted search and on-site assistants can guide shoppers to the right product faster. MeUndies, for example, uses a help assistant to surface relevant FAQs:
Voice search is growing too. Structure your product data so it's discoverable by voice assistants. The stores that show up in those results will have an edge over those that don't.
5. Customer Lifetime Value (CLV)
Customer lifetime value is the total revenue you expect from a customer across the full relationship. The longer they stay, the greater their value to your business.
B2C purchases can be impulsive, which makes long-term retention harder than in B2B. Yet existing customers spend about 67 percent more than new ones. Winning a customer once is good; keeping them is where the real return is.
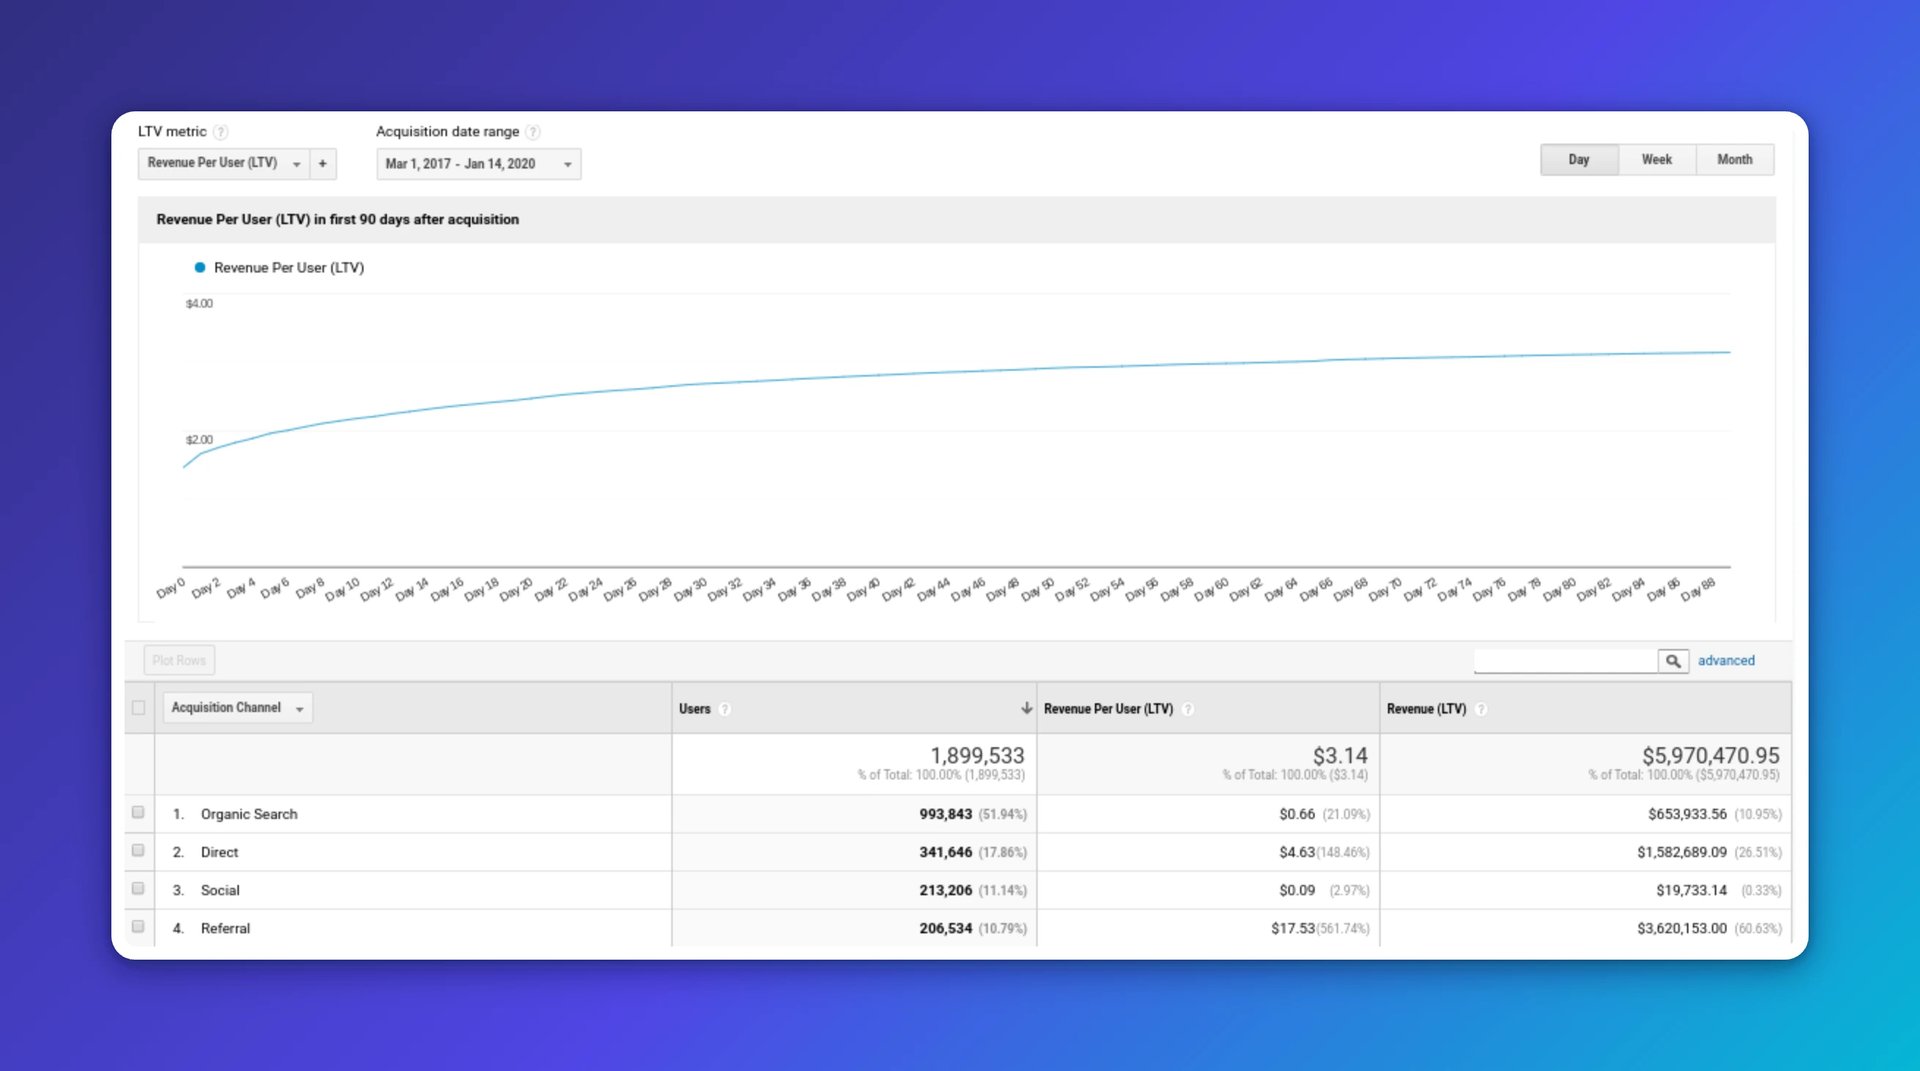
In GA4, build cohort and user exploration reports to estimate lifetime value by channel. The screenshot below shows a legacy LTV report for illustration:
Compare customer value with acquisition cost. If a channel brings in a high volume of low-value buyers, redirect that budget toward channels that create long-term customers.
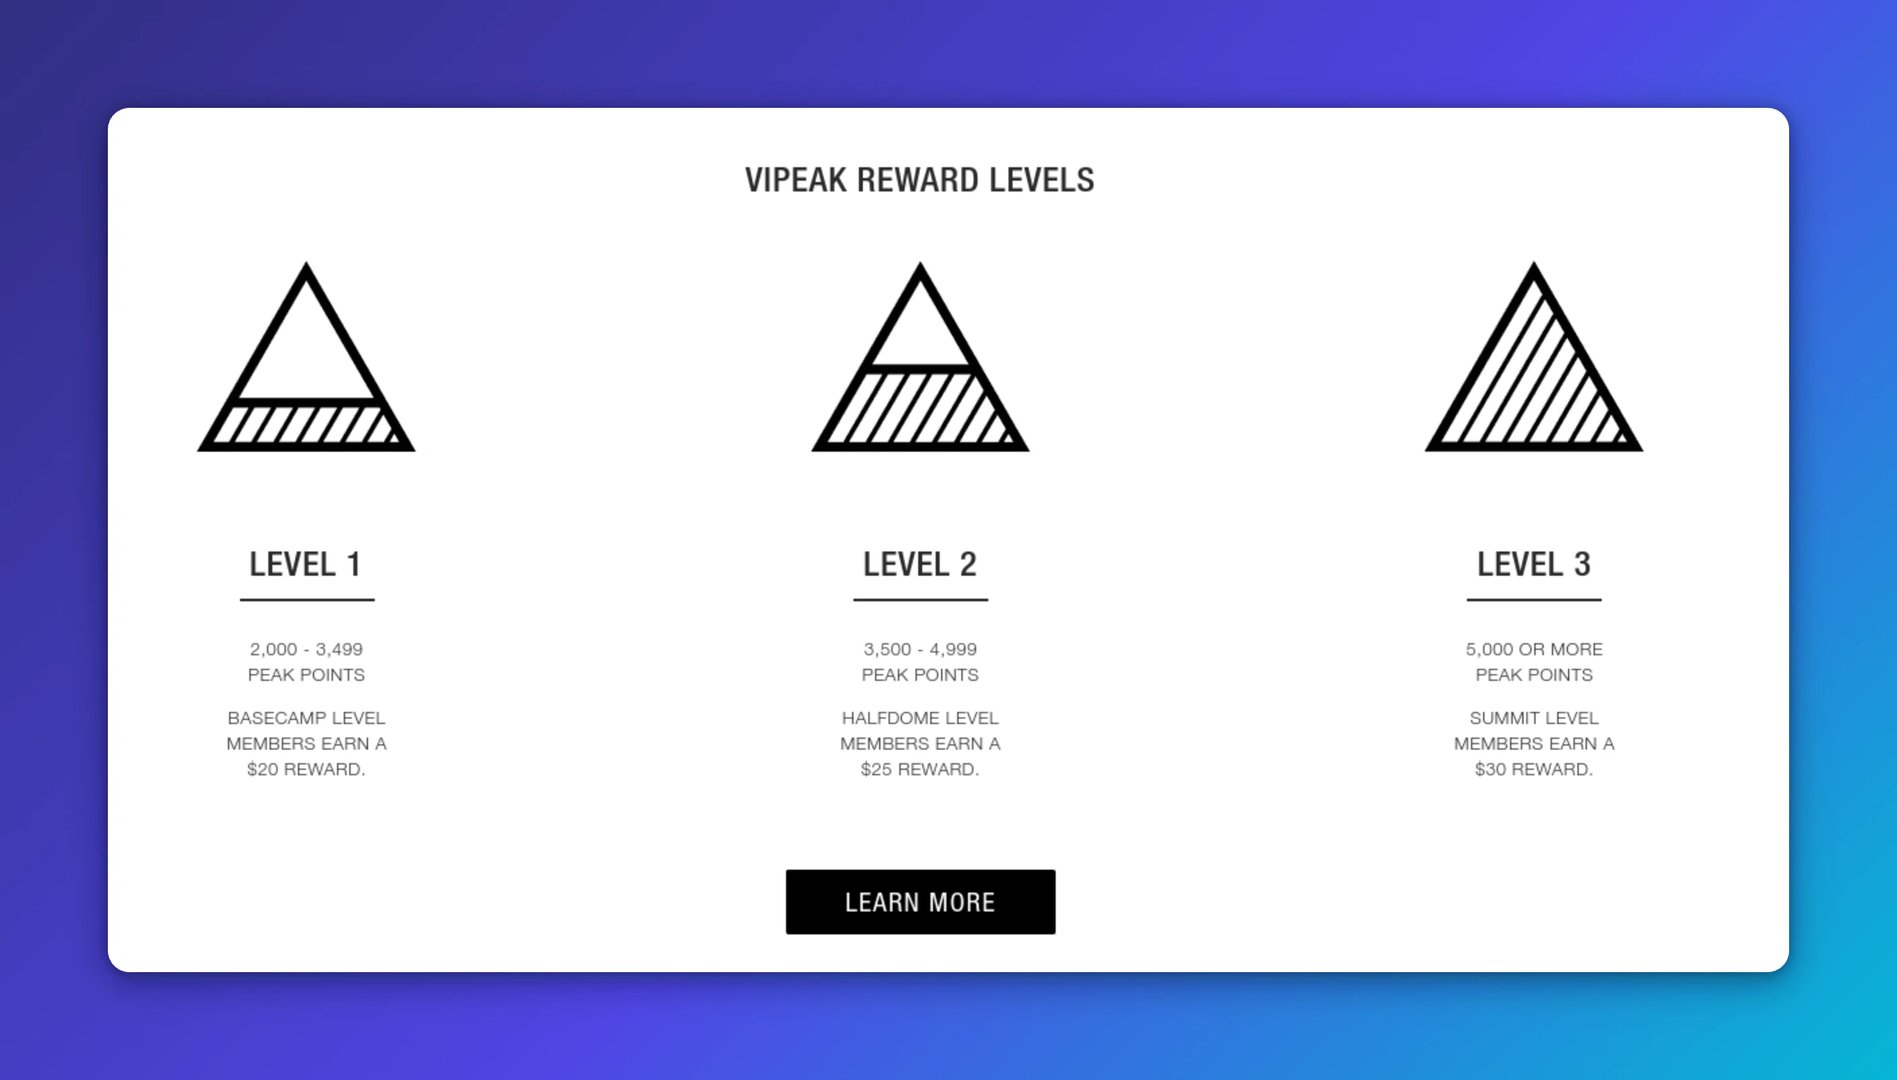
Loyalty programs and tiered rewards give customers a reason to come back. The North Face uses a tiered model that rewards repeat purchases:
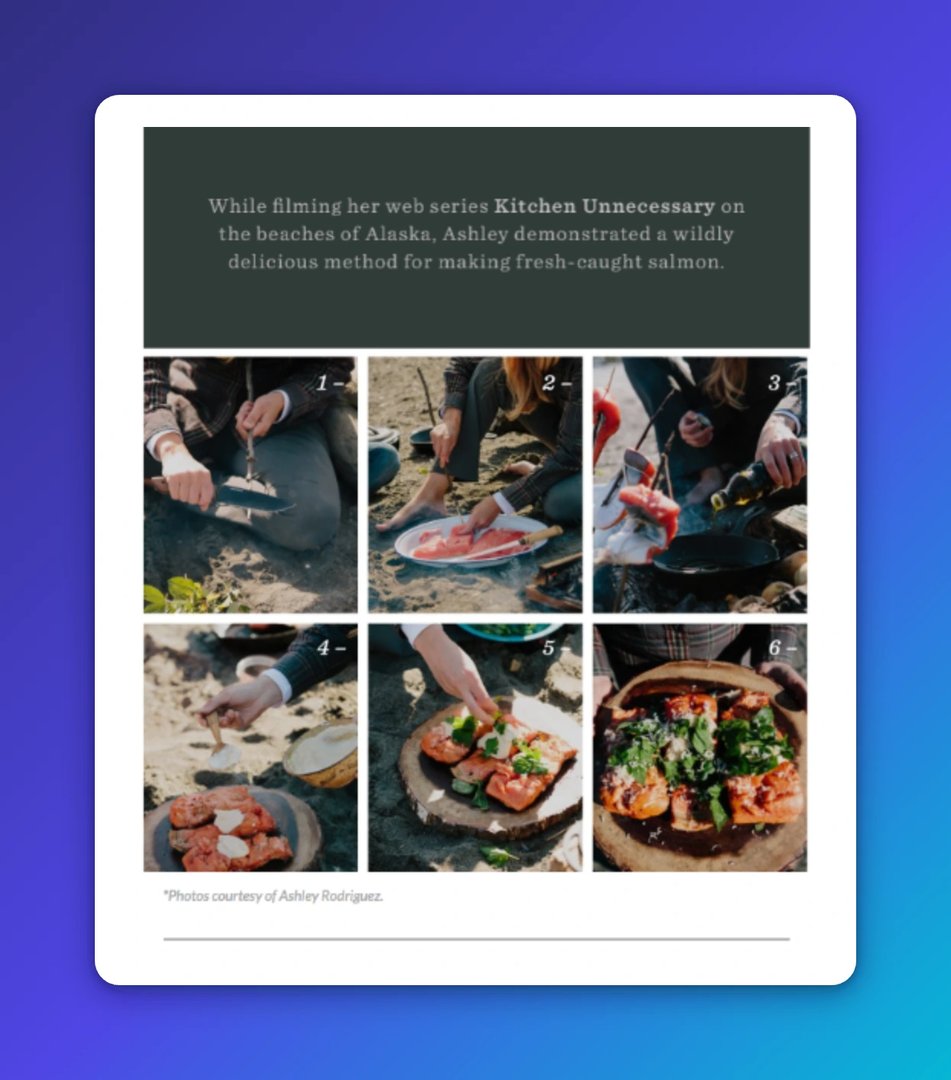
Useful content keeps customers engaged between purchases. Teach people how to get more from your products and show real-world value. This Barebones email is a good example:
Create custom dashboards for you and your team.
Get started with KlipsPut your KPIs to work
Tracking these five metrics gives you a reliable picture of your store's health. Traffic tells you who's arriving. Cart abandonment shows where you're losing them. AOV reveals how much they spend. Conversions confirm whether your funnel is working. CLV tells you who's worth keeping.
The numbers are only useful if you can trust them and act on them quickly. Monitor all five KPIs on live dashboards in Klipfolio Klips so your team always works from the same data, without waiting for someone to pull a report or paste figures into a spreadsheet.
Published 2026-08-21
More in eCommerce
Business Metrics vs. KPIs: What’s the Difference?

The 5 most important SEO KPIs for digital marketing success
What is a KPI, metric, or measure?

What are the best inbound marketing KPIs?

Why every digital marketer needs to learn how to deploy marketing technology
17 KPIs Every Data-Driven Manager Needs to Lead Their Team
Most recent
- AUG 11Beyond simple sign-ups: how True Trials and Activation predict growth
- JUL 7Why business leaders miss important trends in their dashboards
- JUN 19The best chart for the job: Visualizing data for non-technical users
- JUN 95 tips to understand (and organize) your restaurant data
- MAY 26Think in Horizons, Not Seconds
- MAY 2010 Cloud BI Dashboard Tools for Small Businesses in 2026